3028
Truly simultaneous preclinical PET-MRI in a 20cm 9.4 Tesla magnet with a retrofitted miniature detector: Initial results in the twitcher mouse model of Krabbe disease1Buffalo Neuroimaging Analysis Center, Department of Neurology, Jacobs School of Medicine and Biomedical Sciences, University at Buffalo, The State University of New York, Buffalo, NY, United States, 2Center for Biomedical Imaging, Clinical and Translational Science Institute, University at Buffalo, The State University of New York, Buffalo, NY, United States, 3Department of Medical Physics, University at Buffalo, The State University of New York, Buffalo, NY, United States, 4Hunter James Kelly Research Institute, Jacobs School of Medicine and Biomedical Sciences, University at Buffalo, The State University of New York, Buffalo, NY, United States, 5Department of Biochemistry, Jacobs School of Medicine and Biomedical Sciences, University at Buffalo, The State University of New York, Buffalo, NY, United States, 6Department of Neurology, Jacobs School of Medicine and Biomedical Sciences, University at Buffalo, The State University of New York, Buffalo, NY, United States
Synopsis
While the potential of PET-MRI is increasingly being explored in the clinical setting, preclinical PET-MRI is only slowly leaving the proof-of-concept stage, which may be explained by technical difficulties due to the size-constraints and strong magnetic fields used in preclinical MRI. In the current work, we present results from a first in vivo application of 18F-FDG PET-MRI using a retrofitted micro-PET detector in a commercial 9.4T magnet. We studied the twitcher mouse model of Krabbe disease, in which an altered glucose metabolism had been suggested.
Introduction
Positron Emission Tomography (PET) and Magnetic Resonance Imaging (MRI) rely on entirely different physical phenomena allowing truly simultaneous multimodal imaging. The potential of their combination lies in the ability to enrich the molecular PET information with MR imaging metrics that cannot be obtained merely by serial PET and MR imaging. PET-MRI in rodents would be particularly attractive as it would enable entirely new approaches to drug development and disease mechanism elucidation.1,2 However, while the potential of PET-MRI is increasingly being explored in the clinical setting, preclinical PET-MRI is only slowly leaving the proof-of-concept stage,3-5 which may be explained by technical difficulties due to the size-constraints (usable bore diameter of often <20 cm) and ultra-high magnetic fields in preclinical MRI.
We have previously presented an integration setup for retrofitting a micro-PET detector into a commercial 9.4T magnet.6 In the current work, we present results of a first in vivo application of 18F-Fludeoxyglucose (18F-FDG) PET-MRI in the twitcher mouse model of Krabbe disease, in which an altered glucose metabolism had been suggested.7
Methods
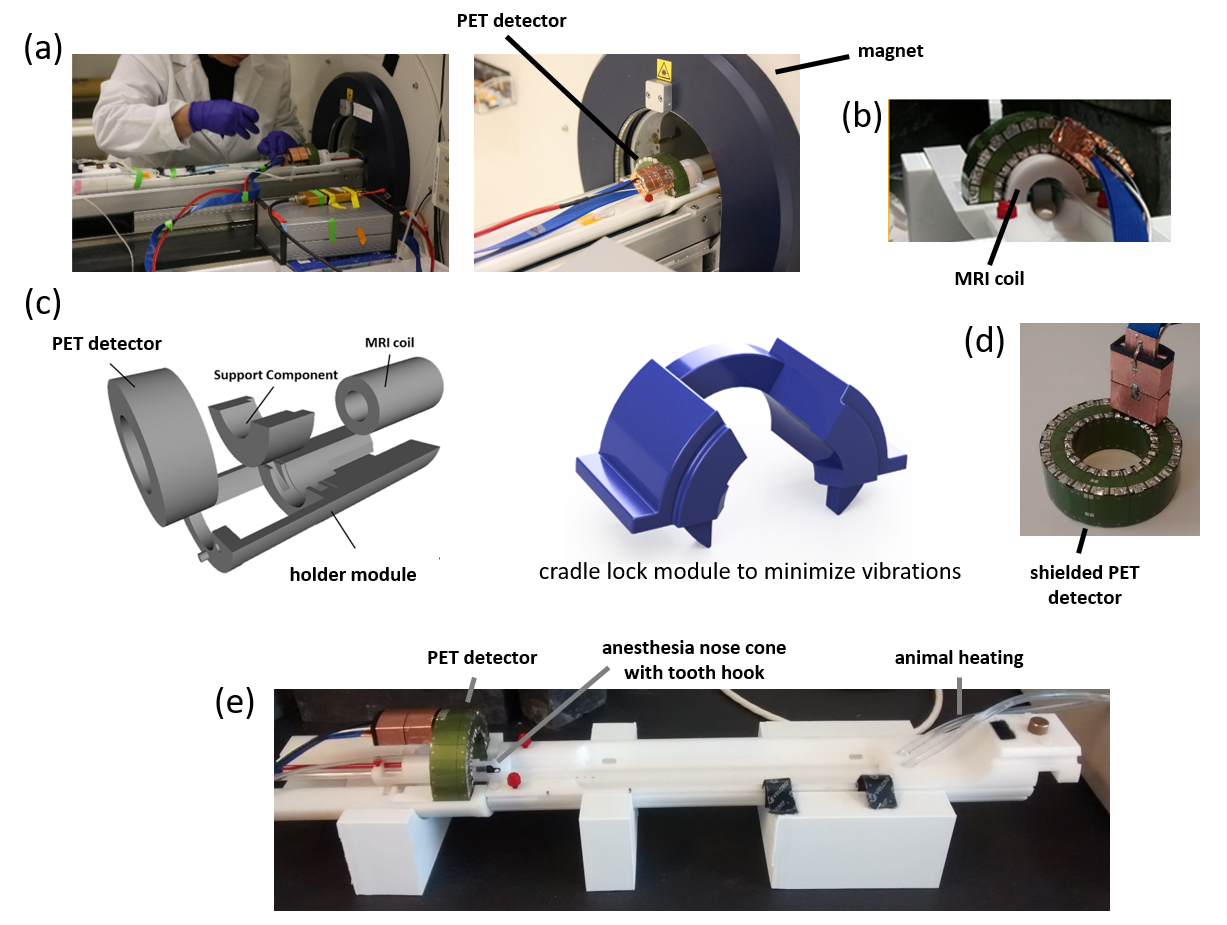
PET-detector: The employed prototype PET detector ring (SynchroPET, Inc.; Stony Brook, NY) had 44mm/80mm inner/outer shell diameters, a depth of 25mm (Fig. 1b), and comprised 12 radially oriented scintillator crystals (LYSO, 18.5x9.6x6mm3, 4x8 pixels) and avalanche photodiodes (APD, 415V). Eddy currents were minimized via a multilayered segmented copper shield (Fig. 1d). The system was connected via an optical fiber interface to a processing computer in the control room. A previous version of the detector platform had been described elsewhere.8
MRI Integration: We used a 20 cm diameter horizontal-bore 9.4 Tesla magnet (Biospec 94/20 USR, Bruker Biospin) equipped with a standard gradient coil (440 mT/m; 3440 T/m/s; BGA-12S HP; Bruker Biospin). We 3D-printed (ABS) a custom adapter6 for the MRI’s motorized sample positioning system to hold the PET detector (Fig. 1c,e), anesthesia and monitoring equipment (Fig. 1e) as well as a pre-tuned, shielded mouse-head volume circular polarized transceiver coil (Fig. 1b; Bruker BioSpin, T12969V3).
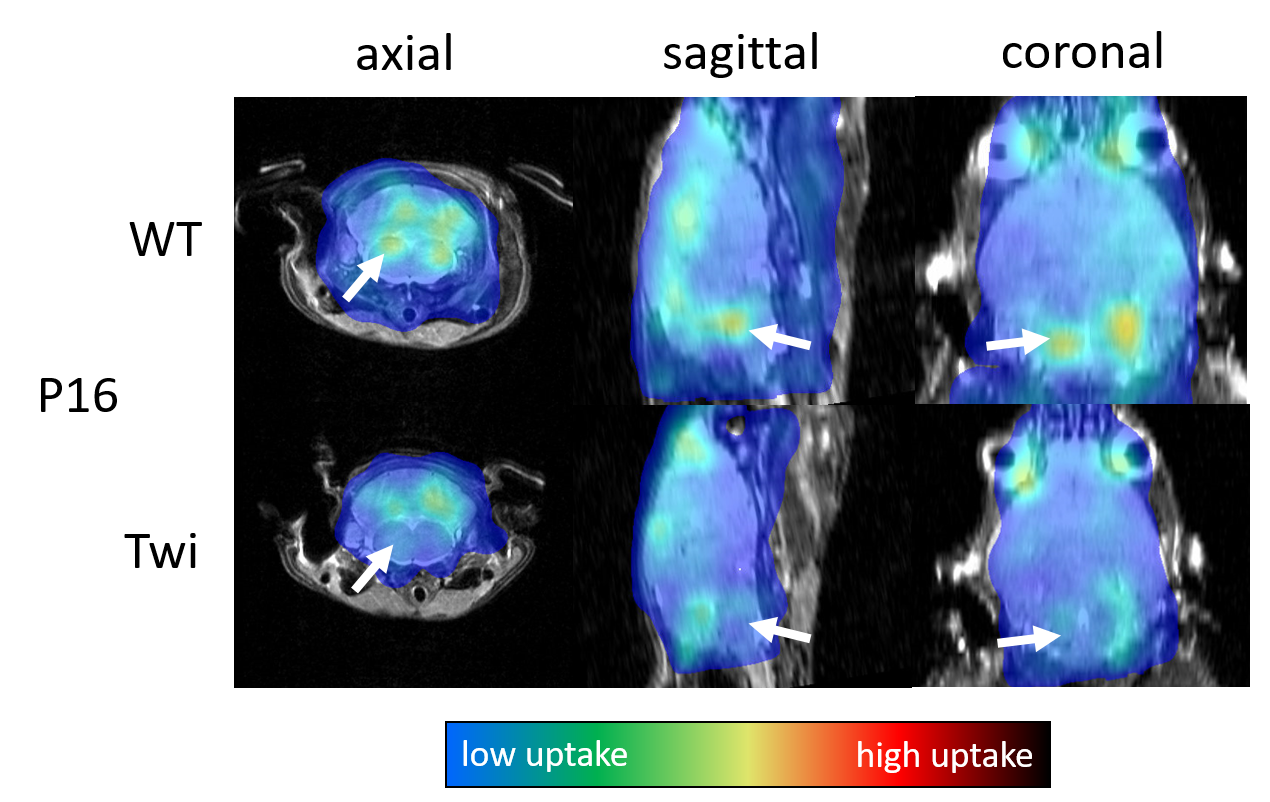
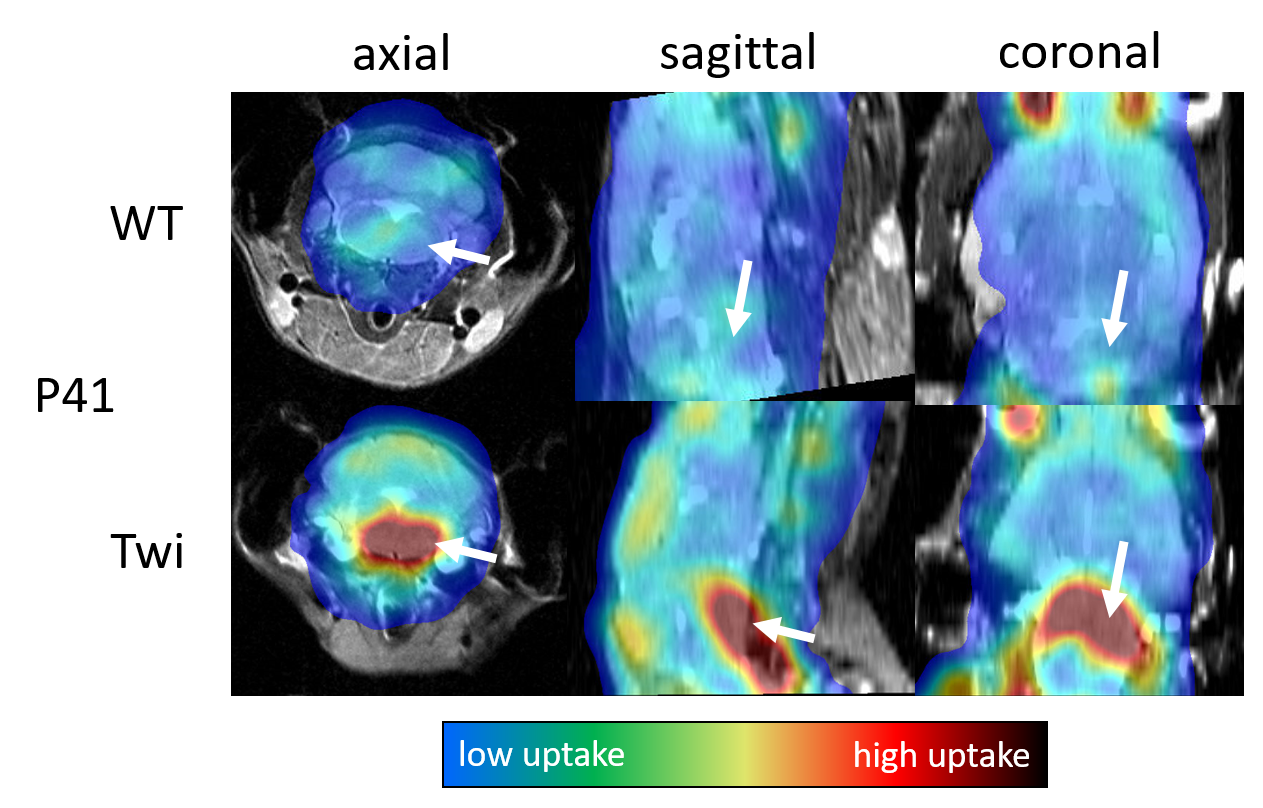
Experiments: The local radiation safety committee approved the experimental procedures, and all procedures involving animals were performed according to the guidelines of the Institutional Animal Care and Use Committee (IACUC). Twitcher mice were maintained on the background of C57BL/6N. Breeder C57BL/6N mice were purchased from Charles River Laboratories (Kingston, PA). Between postnatal (P) days 16 (pre-symptomatic) and 41 (full signs of disease), we injected animals with 200 to 500 μCi 18F-FDG in volumes between 100µl and 200µl, depending on body weight. After 20 minutes awake uptake time under a heat lamp, the animals were anesthetized with Isoflurane. PET acquisition was started 30 minutes after the injection and continued for up to 60 minutes. During the PET scanning, we acquired axial T2-RARE and T1-RARE images with MRI.
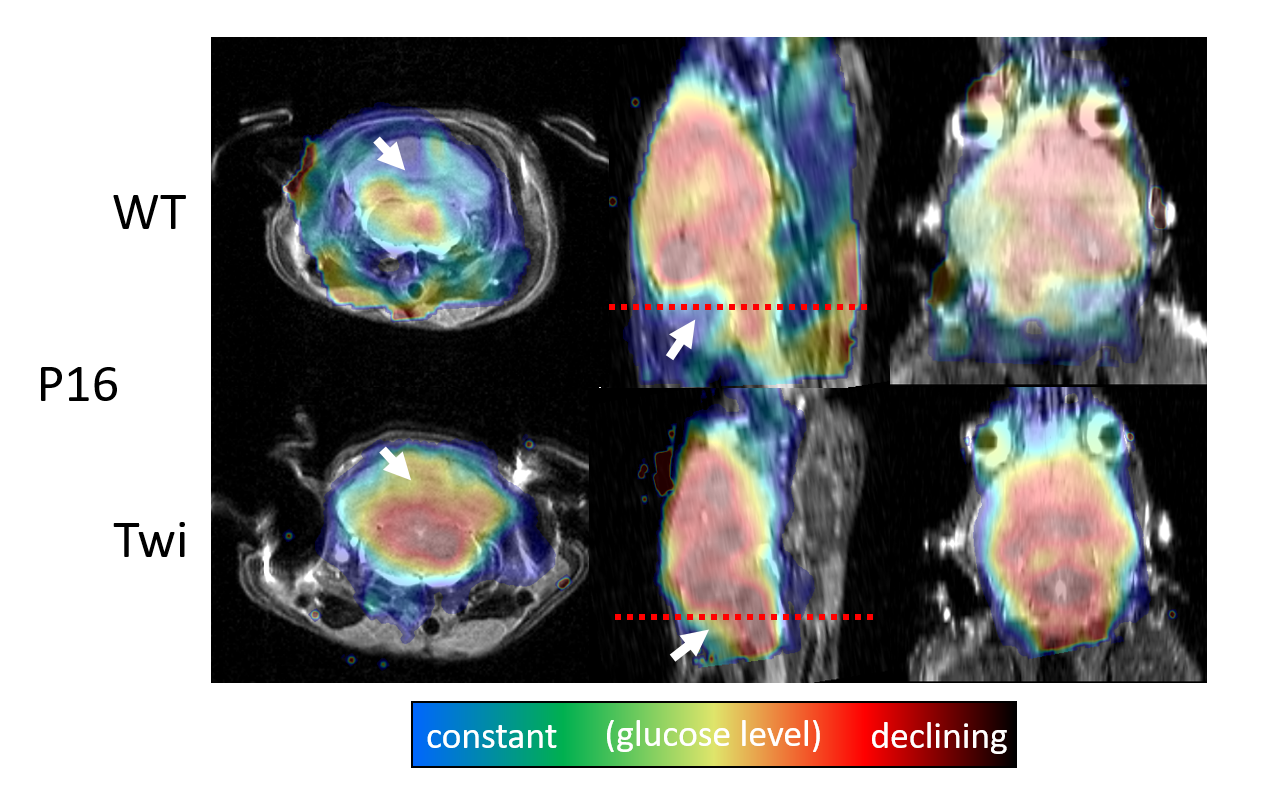
Image reconstruction: We reconstructed PET images at intervals of 5 minutes with an iterative 3D maximum likelihood-expectation maximization (MLEM) algorithm using a response matrix created with the Monte Carlo SimSET package (University of Washington, Seattle, WA)8 and a 3D spline-based 4-fold spatial interpolation resulting in a voxel size of 0.24x0.24x0.29mm3. We decay-corrected image intensities to the injection time, normalized them by animal body weight and injected dose, and calculated the voxel-wise glucose uptake constant using an exponential uptake function. All resulting images were registered and overlaid over the T2-weighted MR images.
Results
Discussion
Our study demonstrated the feasibility of simultaneous PET-MRI in live mice on a conventional 9.4T MRI system retrofitted with a miniature-PET ring. Once animals were anesthetized, the MRI workflow and experimental setup were similar to conventional MRI experiments. Our preliminary findings in Twitcher mice are in line with a previous metabolomics analysis suggestive of alterations in brain glucose metabolism. A brain region-specific analysis based on segmented MRI scans will allow a more detailed quantification and statistical analysis of the glucose matabolism.Conclusion
Using a retro-fitted miniature PET detector, simultaneous PET-MRI allows detecting altered radiotracer uptake in sub-regions of the brain of mouse pups at 9.4T. The use of 18F-FDG with this innovative technology may be generalized to other disorders involving oligodendrocytes, such as multiple sclerosis and various leukodystrophies. Other PET-tracers and dynamic studies exploring the temporal resolution of PET and MRI as well as advanced MRI metrics such as diffusion and metabolite spectroscopy will be the subject of future research.Acknowledgements
The authors are grateful to Nicola Bertolino for his support with the design of the experimental setup. Also, we thank Drs. D. Schlyer, S.D. Smith for scientific guidance and inspiration and D. Hertz and M. Hamburger for their professional attitude and support to this project.
Research reported in this publication was funded by the National Center for Advancing Translational Sciences of the National Institutes of Health under Award Number UL1TR001412. The content is solely the responsibility of the authors and does not necessarily represent the official views of the NIH.
References
[1] T. S. C. Ng, J. R. Bading, R. Park, H. Sohi, D. Procissi, D. Colcher, P. S. Conti, S. R. Cherry, A. A. Raubitschek, and R. E. Jacobs, “Quantitative, Simultaneous PET/MRI for Intratumoral Imaging with an MRI-Compatible PET Scanner,” J Nuc Med, 53(7):1102–1109, 2012.
[2] K. Büscher, M. S. Judenhofer, M. T. Kuhlmann, S. Hermann, H. F. Wehrl, K. P. Schäfers, M. Schäfers, B. J. Pichler, and L. Stegger, “Isochronous assessment of cardiac metabolism and function in mice using hybrid PET/MRI.” J Nuc Med, 51(8):1277–1284, 2010.
[3] B. J. Pichler, M. S. Judenhofer, C. Catana, J. H. Walton, M. Kneilling, R. E. Nutt, S. B. Siegel, C. D. Claussen, and S. R. Cherry, “Performance test of an LSO-APD detector in a 7-T MRI scanner for simultaneous PET/MRI.” J Nuc Med, 47(4):639–647, 2006.
[4] J. Wehner, B. Weissler, P. M. Dueppenbecker, P. Gebhardt, B. Goldschmidt, D. Schug, F. Kiessling, and V. Schulz, “MR-compatibility assessment of the first preclinical PET-MRI insert equipped with digital silicon photomultipliers,” Phys Med Biol, 60(6):2231–2255, 2015.
[5] A. L. Goertzen, Q. Bao, M. Bergeron, E. Blankemeyer, S. Blinder, M. Canadas, A. F. Chatziioannou, K. Dinelle, E. Elhami, H.-S. Jans, E. Lage, R. Lecomte, V. Sossi, S. Surti, Y.-C. Tai, J. J. Vaquero, E. Vicente, D. A. Williams, and R. Laforest, “NEMA NU 4-2008 Comparison of Preclinical PET Imaging Systems,” J Nuc Med, 53(8):1300–1309, 2012.
[6] N. Bertolino, Y. Sinelnikov, D. Shah, R. Zivadinov, and F. Schweser, “Integrated setup and characterization of an MRI-compatible PET camera for preclinical ultra-high eld imaging,” ISMRM 2017, p4087.
[7] N. I. Weinstock, L. Wrabetz, M. L. Feltri, and D. Shin, “Metabolic profiling reveals biochemical pathways and potential biomarkers associated with the pathogenesis of Krabbe disease,” J Neurosci Res, 94(11):1094–1107, 2016.
[8] S. H. Maramraju, S. D. Smith, S. S. Junnarkar, D. Schulz, S. Stoll, B. Ravindranath, M. L. Purschke, S. Rescia, S. Southekal, J.-F. Pratte, P. Vaska, C. L. Woody, and D. J. Schlyer, “Small animal simultaneous PET/MRI: initial experiences in a 9.4 T microMRI.” Phys Med Biol, 56(8):2459–80, 2011.
Figures