3025
ADC-corrected SUV derived from voxel-based SUV-ADC scatter plots for the evaluation of soft-tissue tumor treatment response in FDG-PET/MR hybrid imaging1Philips Japan, Tokyo, Japan, 2Department of Molecular Imaging and Diagnosis, Kyushu University, Fukuoka, Japan, 3Department of Clinical Radiology, Kyushu University, Fukuoka, Japan
Synopsis
It is often difficult to quantify tumor treatment response with SUVmax because a single voxel measurement does not always represent a whole tumor. In this study, we developed a new parameter called cellular SUV (cSUV) from the SUV-ADC scatter plots. Cluster analysis also applied to the cSUV-measurement of a tumor consisting of multiple components such as liposarcoma, necrotic tumor after treatment, etc. The percent change in cSUV between pre- and post-treatment correlated better with the RECIST1.0 assessment than that of SUVmax. The cSUV combined with cluster analysis could be a promising bio-imaging marker for monitoring treatment response of soft-tissue tumors.
Purpose
The combined use of FDG-PET and apparent diffusion coefficient (ADC) has provided better diagnostic performance for the assessment of malignancy in some types of tumor. However, quantifying treatment response with maximum standardized uptake value (SUVmax) demonstrated the limitation because SUVmax showed high dependence on a single voxel definition which could lead to uncertainty in assessing treatment response.1 In this study, a newly-developed parameter, “cellular SUV” (cSUV), was designed to incorporate cellular density information of ADC into glucose metabolism of SUV. Regardless of tumor heterogeneity, cSUV was devised to provide an improved indicator for the diagnosis of tumor malignancy and the early assessment of treatment effect. The purpose of the present study was to investigate the feasibility of cellular SUV combined with cluster analysis in the evaluation of treatment effect of soft-tissue tumors.Methods
Subjects: Eight patients with high-grade soft-tissue sarcomas (2 osteosarcomas, 2 pleomorphic sarcomas, 1 synovial sarcoma, 1 clear cell sarcoma, 1 myxofibrosarcoma, and 1 liposarcoma) were included in this study. 6 patients underwent chemotherapy and 2 patients underwent heavy-particle radiotherapy.
PET/MR imaging: PET/MR data were obtained on the Ingenuity TF PET/MR (Philips, Cleveland, Ohio, USA) before and after the treatment. After acquiring a 3D T1-weighted image for attenuation correction, PET imaging was performed with 5-minute TOF-acquisition per station and reconstructed with the voxel size of 2 × 2 × 2 mm3 using 3D-ordered subset expectation maximization (OSEM) iterative method. Subsequently, MR scans were carried out to acquire anatomical 3D fat-suppressed T2-weighted TSE image and zoomed DWI with a spin-echo EPI sequence (TR 4200 ms, TE 53 ms, slice thickness 7 mm, b = 0 and 800 sec/mm2). ADC map was generated from b-0 and b-800 images of zoomed DWI.
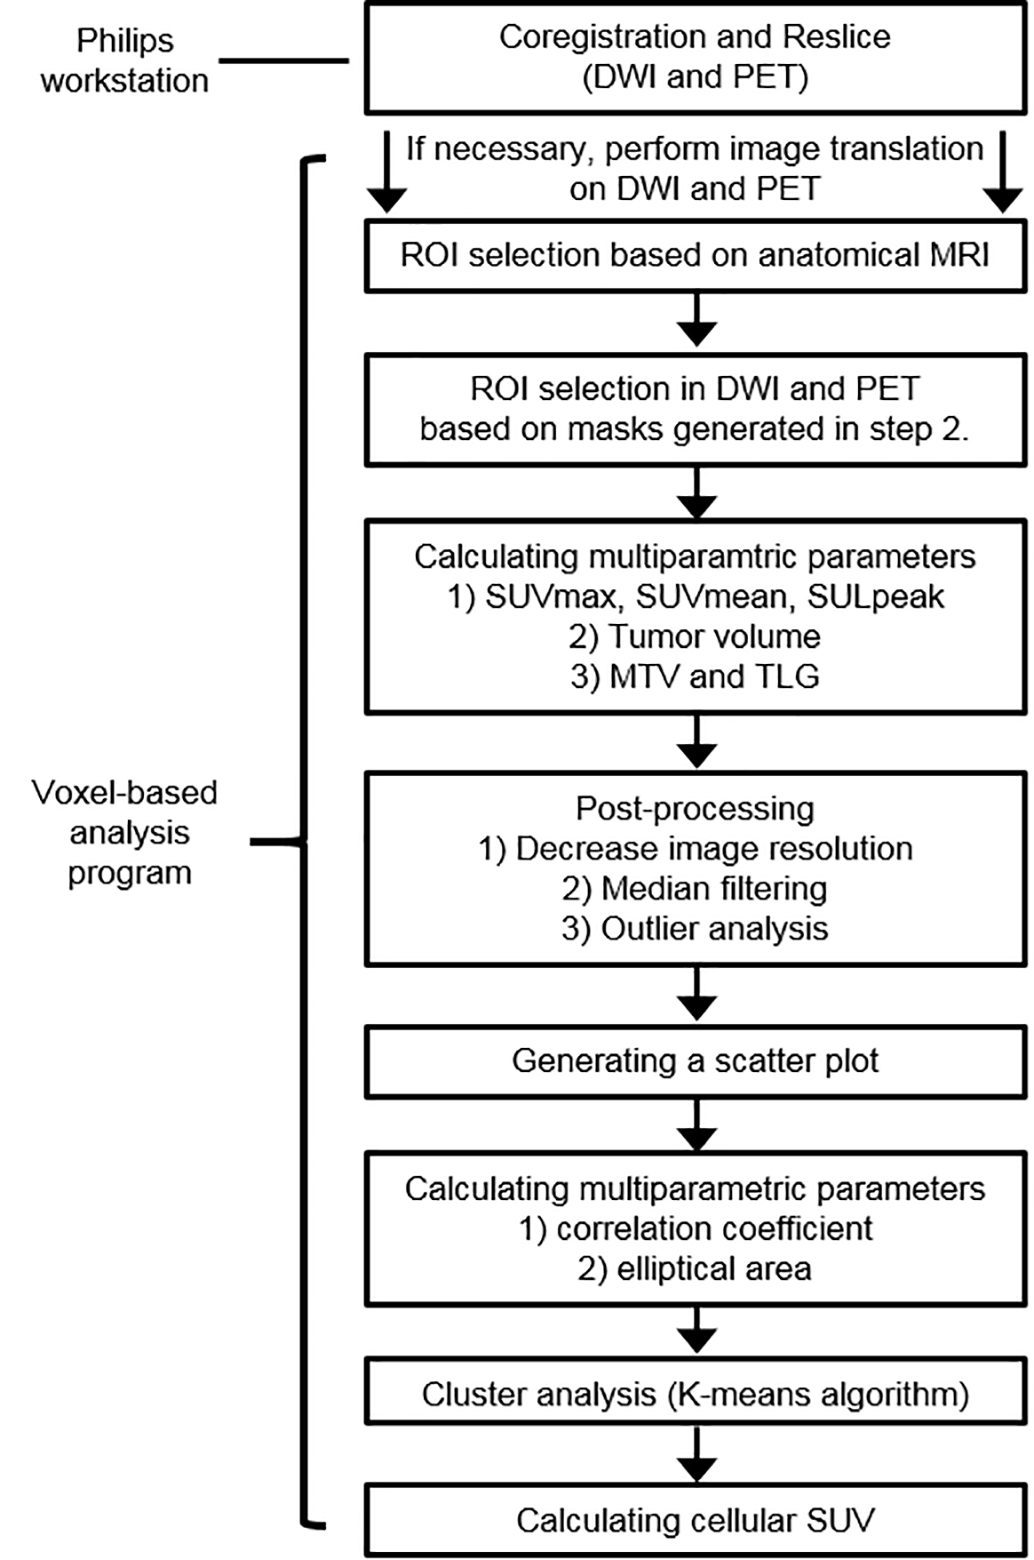
Voxel-wise analysis: An overall procedure necessary for the voxel-based analysis is illustrated in Figure 1. First, image co-registration and reslice of T2WI and PET image was performed based on ADC map (IntelliSpace Portal workstation version 6.0, Philips Healthcare). On 3D-T2WI, regions of interest (ROIs) were manually drawn along the border of the tumor in all slices, and propagated onto the ADC maps and PET images. After extracting the tumor area, in-plane image resolution was interpolated to 42mm from 22 mm. The values of ADC and SUV were recorded on a voxel-by-voxel basis along with x-y coordinates for all slices, and scatter plots of SUV/ADC vs. ADC were generated for each tumor. Several parameters including SUVmax, SUVmean, tumor volume, metabolic tumor volume (MTV) and total lesion glycolysis (TLB) were calculated before applying three processing steps such as downsampling, median filter and outlier removal necessary for making homogenous data distribution. Subsequently correlation coefficient and regression line were derived from the processed values based on a scatter plot (SUV/ADC vs ADC), and k-means clustering algorithm2 was applied to define two groups representing tumor heterogeneity.
Cellular SUV calculation: Cellular SUV was assigned as a SUV/ADC value (y axis) on the regression line of total least squares fit where ADC was 0.5 × 10⁻⁶ mm2/sec (x axis) by using our in-house program written with MATLAB 2015b (MathWorks, Natick, MA, USA).
Results and Discussion
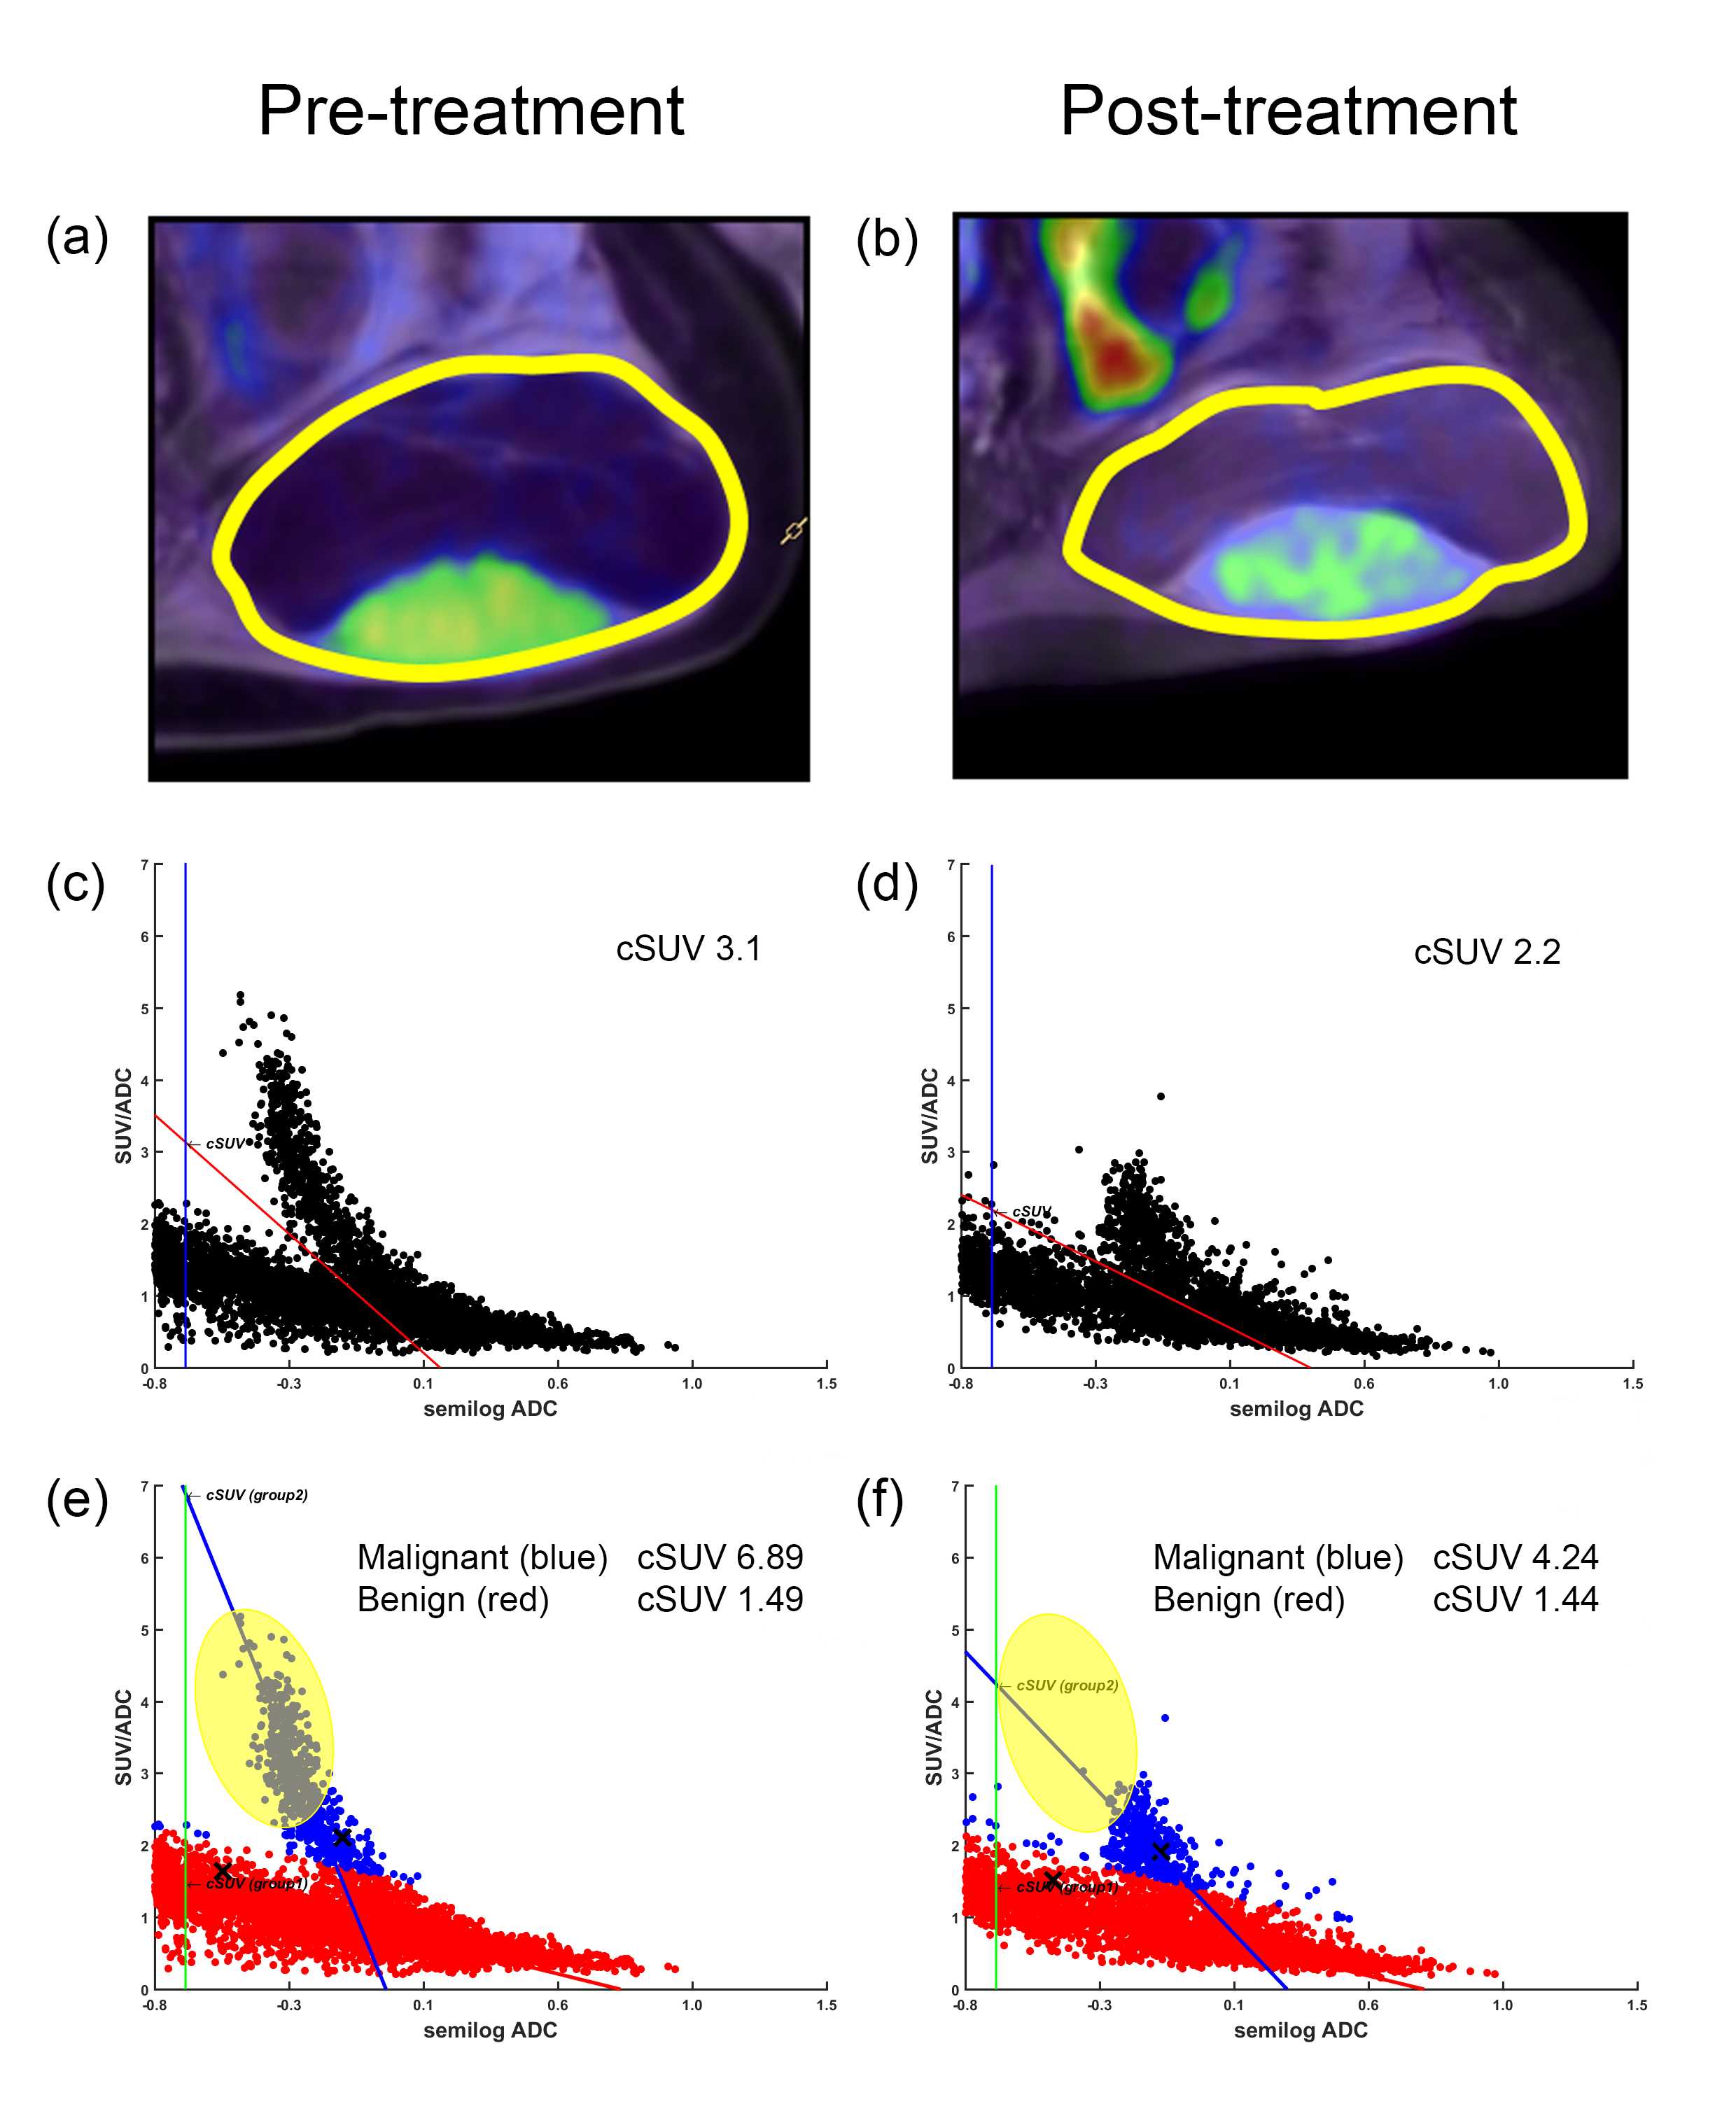
A representative case of liposarcoma before and after chemotherapy is shown in Figure 2. PET/MR fusion images including selected ROIs (yellow line) show decreased FDG uptake in post-treatment (b) compared to pre-treatment (a). Two distinct scatter groups in a scatter plot illustrates heterogeneous composition including benign lipoma and malignant dedifferentiated liposarcoma components. A remarkable decrease of cSUV of malignant component was observed, and the change in cSUV of benign lipoma portion was minimal (e, f), though the sole utilization of cSUV as a whole enables the reliable assessment of tumor response (c, d). In addition, a visual inspection of tumor response could be possible by observing decreased scatter points along the total least squares fit marked with ellipsoids (e, f).
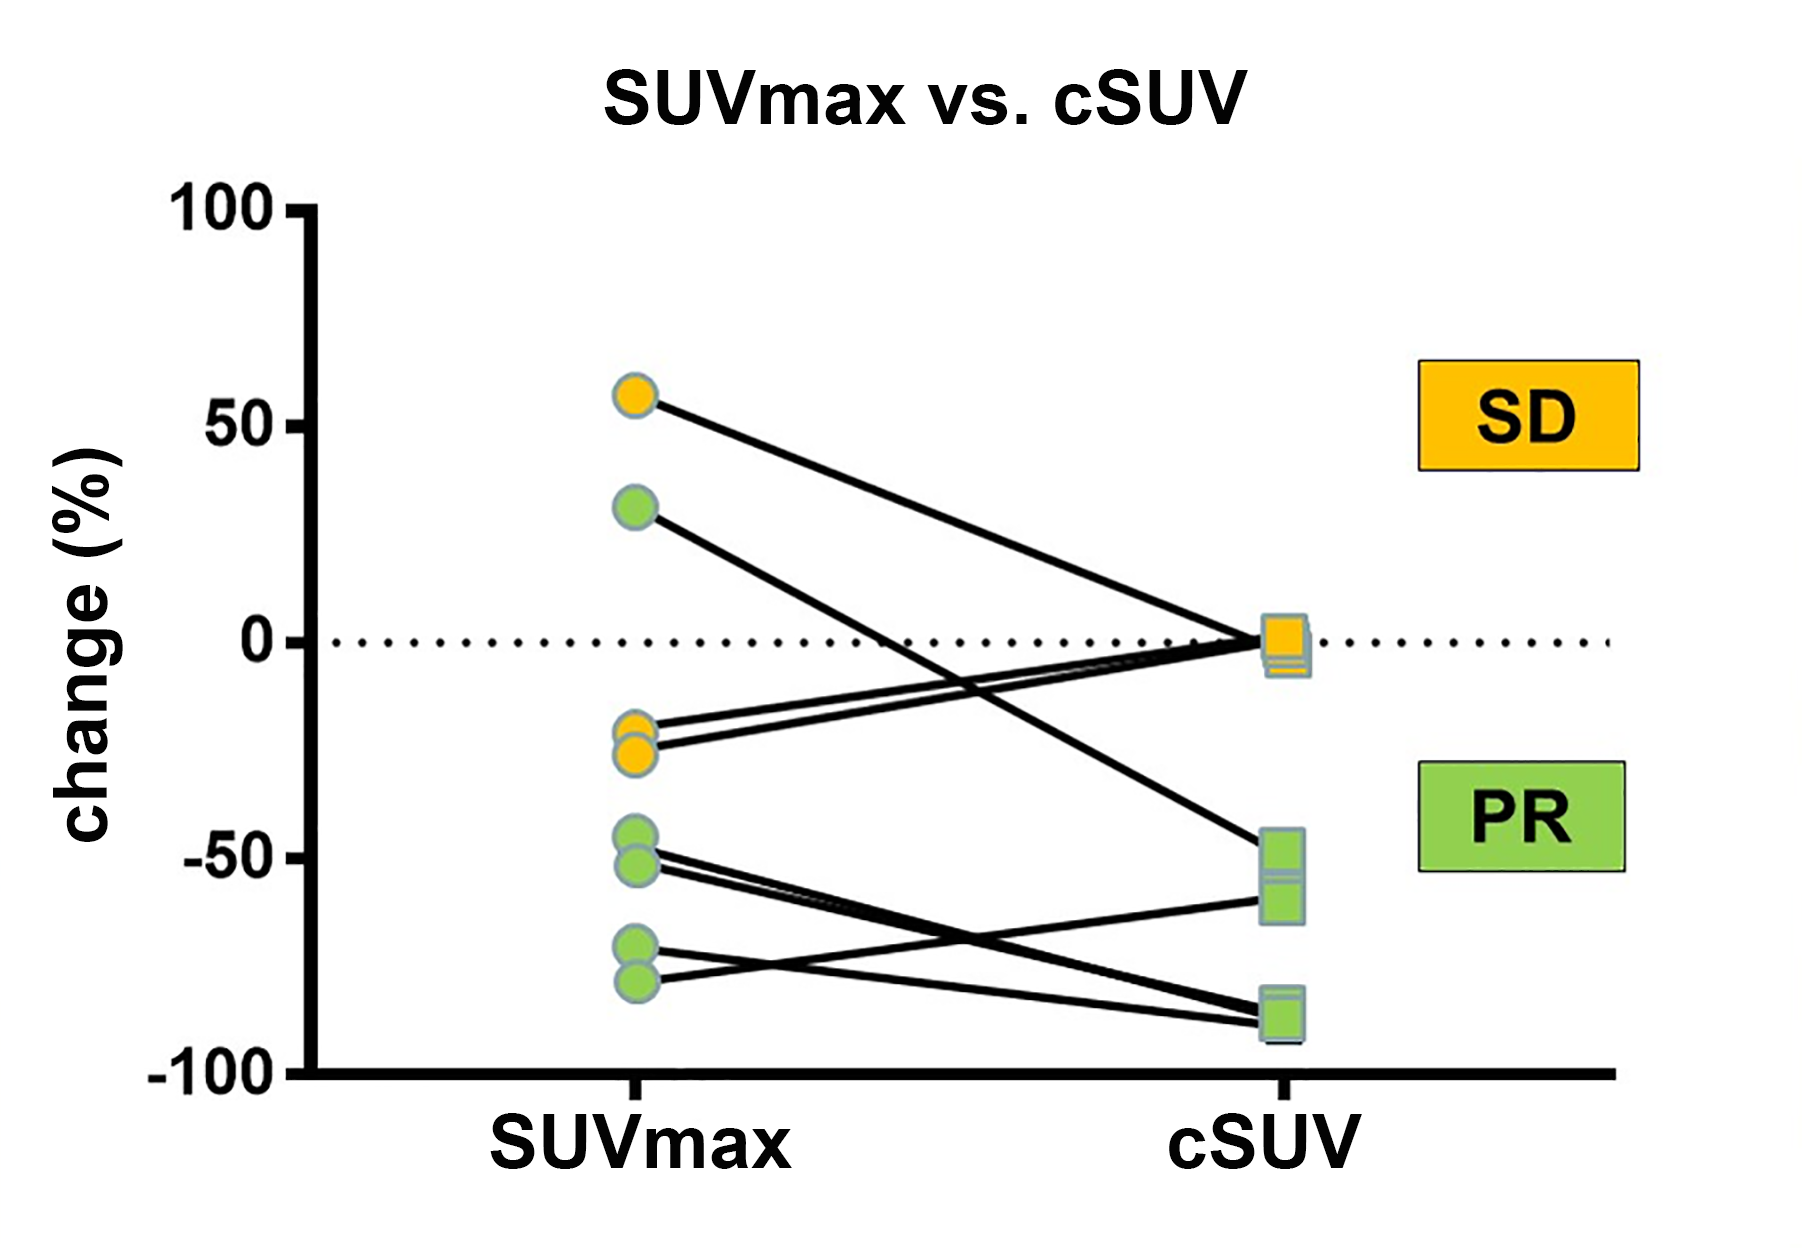
When comparing the percent change of pre-and post-treatment between cSUV and SUVmax (Fig. 3), cSUV demonstrated more than 30% decrease in 5 patients (all cases in partial response) and no interval change in 3 patients (all cases in stable disease), while SUVmax showed more than 30% increase in two cases (one in partial response, one is stable disease), implying the potential benefit on monitoring therapy response with cSUV.
Conclusion
The new approach to combining cellular SUV with cluster analysis could be a promising tool for monitoring treatment response in patients with soft-tissue tumors.Acknowledgements
No acknowledgement found.References
1. Vanderhoek M, Perlman SB, and Jeraj R. Impact of the Definition of Peak Standardized Uptake Value on Quantification of Treatment Response. J Nucl Med. 2012;53:4–11.
2. Anderberg, MR. Cluster Analysis for Applications. Academic Press; 1973.
Figures