3024
A Voxelwise Analysis of PET/MR DATA towards Characterization of Prostate Cancer1PLA 301 General Hospital, Nuclear Medicine Department, Beijing, China, 2Siemens Healthcare, MR Collaborations NE Asia, Shanghai, China
Synopsis
The combined use of diffusion-weighted and 11C-Choline PET images can provide complementary information on prostate cancer. However, it is still unknown how to combine these multiple parameters to give a simple indication for malignant lesions. Based on a scatterplot analysis of standardized uptake values (SUVs) and apparent diffusion coefficient (ADC) values, we clustered voxels into groups corresponding to different tissue types. The proposed method shows promising results in differentiating the lesion of tumor from normal tissue.
Introduction
Diffusion-weighted magnetic resonance imaging (DW-MRI) and imaging of glucose metabolism by positron emission tomography (PET) can provide complementary information on tissue biology, and is potentially useful for the evaluation of prostate lesions including primary and recurrent cancers 1. However, due to the tumor heterogeneity and large amount of data, it is still unknown how to combine these multiple parameters as a reliable indicator for prostate cancer. In this study, based on standardized uptake values (SUVs) and apparent diffusion coefficient (ADC) values, we propose to use voxelwise analysis to delineate lesions and investigate the tissue characterization within them.Methods
Nine male patients with evaluated prostate-specific antigen were scanned with 11C-Choline PET/MRI (Biograph mMR, Siemens Healthcare, Erlangen, Germany), then received standardized ultrasound guided sextant core biopsy. The PET/MRI protocol consists of T1W, T2W, a readout-segmented DWI (RESOLVE) sequence prototype and 15 minutes list-mode PET (injection is counted from 0 minute) for the pelvis region; this was followed by T1W, T2W, single-shot DWI from throat to pelvis regions. PET and MR images were coregistered using a 3D rigid transformation and voxel interpolation. In total, the VOI of each patient was selected based on suspicious findings in T2W, DWI 2 and high uptake in 11C-Choline PET images.
For each VOI, voxelwise analysis of ADC and SUV from PET/MR data was conducted using MATLAB (Mathworks, Natick, MA, USA). Based on the ADC and SUV values, clustering analysis was performed, where each cluster was characterized with a bivariate Gaussian distribution described by the mean and covariance matrix. The voxels in each cluster were mapped to the position of corresponding SUV and ADC images. Each voxel was assigned to either cancer group or healthy group according to the results of clustering.
Results
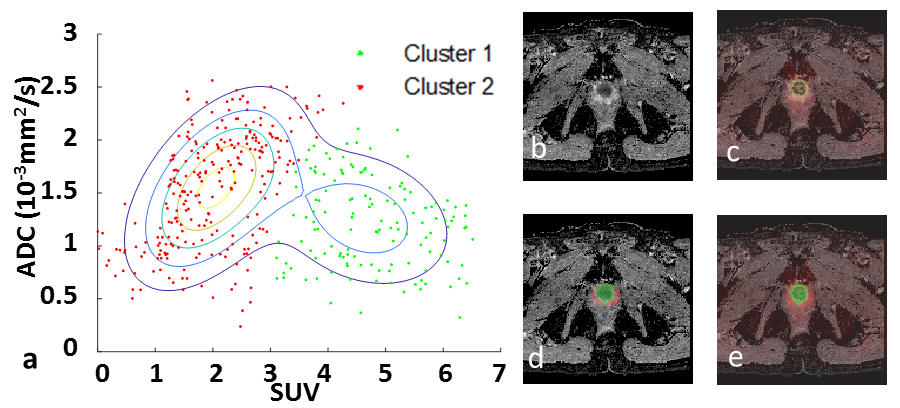
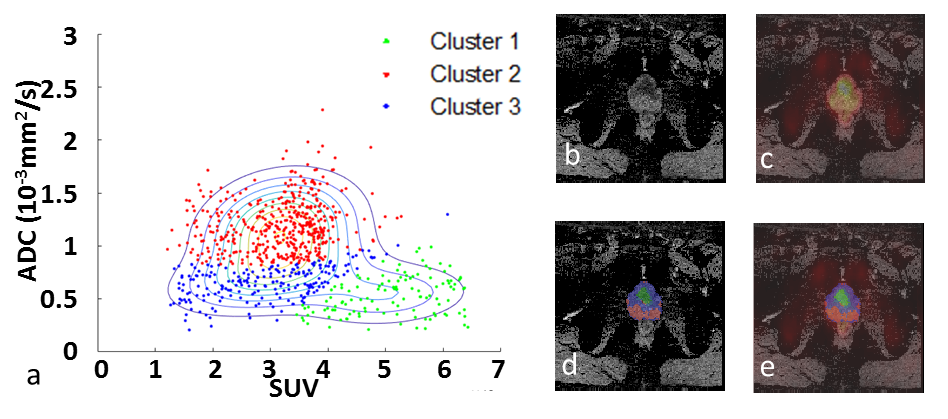
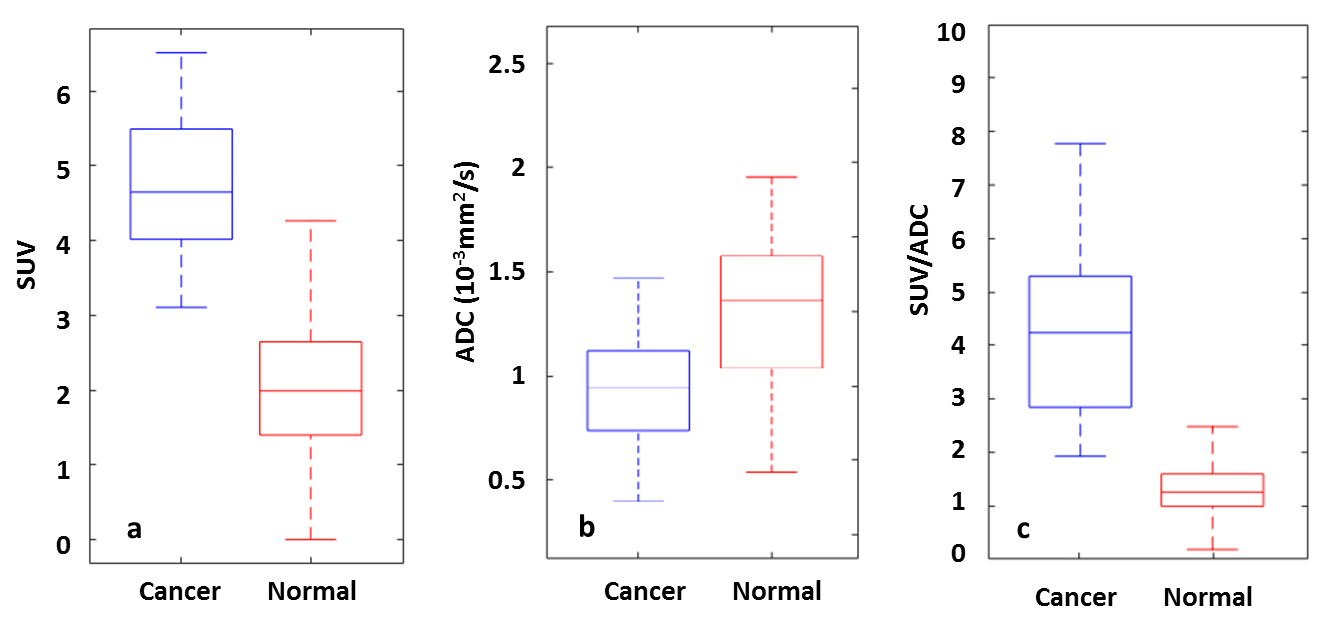
The scatterplots of two typical patients were shown in Figure 1 and 2. It should be noted that the previous biopsy was reported as false negative for them. This is due to the spatial location of the lesions (tip of prostate), which is difficult to reach. For the first patient (69 years old, PSA 10.3 ng/ml, Gleason score 3+4), two clusters were found with ADCmean = 1.1×10⁻³ ,1.5×10-3 mm2/s and SUVmean = 4.7, 2.1 (Figure 1). For the second patient (50 years old, PSA 11.8 ng/ml, Gleason score 4+4), three clusters were identified with ADCmean = 0.5×10⁻³ ,1.1×10-3, 0.6 ×10⁻³ mm2/s and SUVmean = 4.9, 3.4, 2.8 (Figure 2). This is consistent with a previous study, which showed that low ADC could be observed in areas with high glucose metabolism but also in regions of low glucose metabolism 3. As expected, the cancer group had higher SUV values and lower ADC values than the normal group, the ratio between SUV and ADC could even better differentiate cancer from normal tissue (Figure 3).Discussion
In all the patients with prostate cancer including those not shown, at least two clusters can be found separated by SUV values. For example, in Patient 1 (Figure 1), the cluster with high SUV should correspond to tumor tissue, and the other cluster with low SUV should represent normal tissue. In some other patients, the low SUV cluster can be further divided into 2 sub-clusters with regard of their ADC values. Specifically, in Patient 2 (Figure 2), 69% of the low-SUV voxels show high ADC (Cluster 2) and may indicate normal tissue. 31% of the low-SUV voxels showed low-ADC values (Cluster 3). These voxels surround cancer tissue and could relate to inflammatory tissue 4. Thus, a voxelwise analysis allows for differentiation of tumor properties from other tissue and might facilitate the delineation of lesion for a targeted regional therapy. Furthermore, the quantitative cluster analysis reveals an additional value of this method in the diagnosis of cancer as the combination SUV/ADC outperforms the single ADC or SUV in differentiating tumor group from normal tissue group 5 (Figure 3). Further evaluation on the clinical usage of voxelwise scatterplot analysis in a larger primary prostate population is necessary. In the future, a comparison should also be made between the segmentation of tumor by cluster analysis and pathological section images.Conclusion
The combined use of ADC and SUV maps are feasible for prostate cancer patient and can provide additional diagnostic value compared to single MR or PET. Although we only have a limited number of cases, the clustering analysis of SUV and ADC for each VOI shows promising results in the differentiation of tumor from normal tissue.Acknowledgements
No acknowledgement found.References
1. Wetter A, Nensa F, Schenck M, et al. Combined PET Imaging and Diffusion-Weighted Imaging of Intermediate and High-Risk Primary Prostate Carcinomas with Simultaneous [18F] Choline PET/MRI[J]. Plos One, 2014, 9(7):e101571.
2. Barentsz J O, Richenberg J, Clements R, et al. ESUR prostate MR guidelines 2012[J]. European Radiology, 2012, 22(4):746-757.
3. Schmidt H, Brendle C, Schraml C, et al. Correlation of simultaneously acquired diffusion-weighted imaging and 2-deoxy-[18F] fluoro-2-D-glucose positron emission tomography of pulmonary lesions in a dedicated whole-body magnetic resonance/positron emission tomography system[J]. Investigative Radiology, 2013, 48(5):247-55.
4. Gilman A, Noworolski S M, Johnson D T, et al. Diffusion-weighted MRI of the Liver at 3 T: Ability to Detect Early Fibrosis and Inflammation[C]. Radiological Society of North America 2011 Scientific Assembly and Meeting. 2011.
5. Yachao Liu, Jiangping Gao, Jiajin Liu, Hui Liu, Yong Xu, Baixuan Xu, and Jiahe Tian, SUV-ADC mapping of malignant and benign prostate lesions with PET-MRI. ISMRM 2015, #0673
Figures