3022
An Evaluation of Radial GRE Attenuation Correction Maps for Cardiac and Coronary PET-MRI Studies1Edinburgh Imaging facility QMRI, The University of Edinburgh, Edinburgh, United Kingdom, 2The British Heart Foundation/University of Edinburgh Centre for Cardiovascular Sciences, The University of Edinburgh, Edinburgh, United Kingdom, 3Translational and Molecular Imaging Institute, Icahn School of Medicine at Mount Sinai, New York, NY, United States, 4Cardiovascular Institute, Icahn School of Medicine at Mount Sinai, New York, NY, United States, 5Department of Nuclear Medicine, NHS Lothian, Edinburgh, United Kingdom, 6Siemens Healthcare GmbH, Erlangen, Germany
Synopsis
MR-based attenuation correction of PET images is essential for PET-MRI studies. An intensity threshold method for creating attenuation correction maps (µmaps) from 3D golden-angle radial spoiled gradient echo (radial GRE) images is presented. PET reconstructions using the Threshold µmaps, an existing radial GRE method for creating µmaps and the manufacturer Dixon VIBE µmaps are compared for quantification of 18F Sodium Fluoride (18F NaF) uptake in the aorta. Radial GRE µmaps better delineate the trachea and heart-lung boundaries. Dixon µmaps produced PET images with significantly lower aorta wall SUVmax values than radial GRE µmaps. µmaps must be characterised prior to implementation.
Introduction
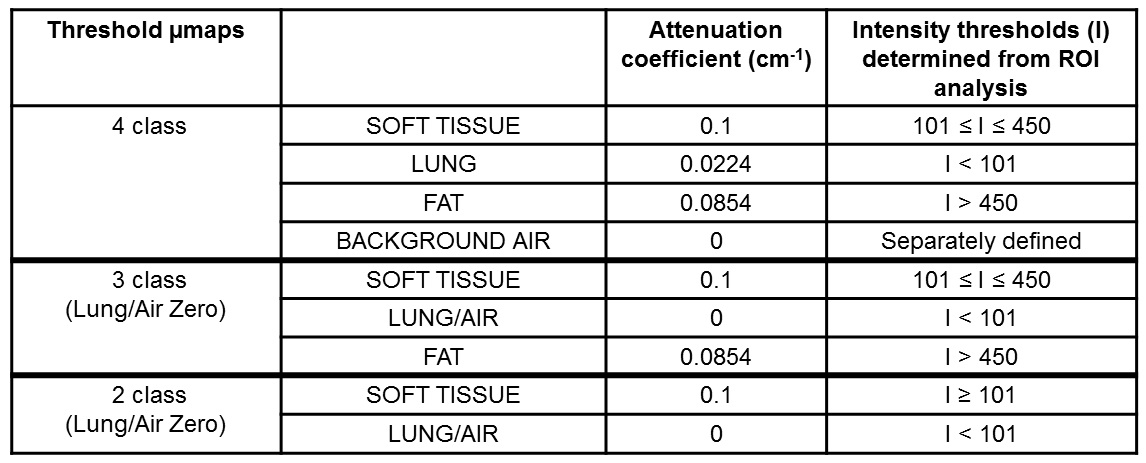
There is interest in using a 3D golden-angle radial spoiled gradient echo sequence (radial GRE) for attenuation correction of PET images for improved delineation of the heart and coronary vessels in PET-MRI studies1. Robson et al1 used a histogram of pixel intensities to segment the radial GRE images into two classes: background (air and lung) and soft tissue (soft tissue and fat). Respective attenuation coefficients of 0 and 0.1cm-1 are assigned to create µmaps (referred to here as Histogram µmap). We present an alternative method for creating µmaps (Threshold µmap) from radial GRE images using pre-defined intensity thresholds to segment and assign attenuation coefficients to lung (0.0224cm-1), soft tissue (0.1cm-1) and fat (0.0854cm-1), and an automatically generated mask to segment background air (0cm-1). PET reconstructions using the Threshold, Histogram and manufacturer's 3D Dixon VIBE µmaps2 are compared for quantification of 18F Sodium Fluoride (18F NaF) uptake in the aorta of three patients.Methods
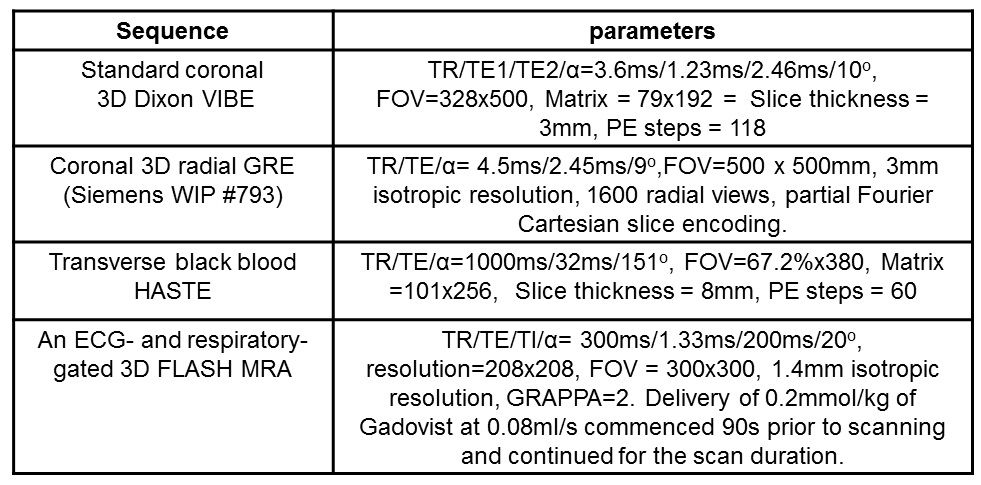
Patients with known coronary disease were recruited as part of a separate clinical study that included a PET-CT scan following an injection of 250MBq 18F NaF. PET-MRI (Biograph mMR, Siemens Healthcare, Erlangen, Germany) was performed 90 minutes after injection. MR signal was received from the mMR body array coil and selected elements of the spine coil. The PET-MRI protocol (Table 1) consisted of the standard 3D Dixon VIBE, a coronal radial GRE (Siemens WIP #793), 50-minute list mode PET and a HASTE sequence to provide anatomical reference for PET uptake. Three patients identified as having 18F NaF uptake in their aorta were included in the analysis.
Intensity values were measured from multiple areas of soft tissue, fat, lung and air observed on radial GRE images of 6 patients and used to establish the intensity thresholds shown in Table 2. Threshold μmaps (Table 2) were created using a custom Matlab program (Matlab R2017a, Mathworks, Natick, MA, USA) that applied these thresholds to each pixel of the radial GRE image (2- or 3-class) and applied an additional background air mask (4-class). The 2-tissue Threshold µmaps provided a direct comparison to the Histogram µmap. PET data were reconstructed with e7-tools (Siemens Healthcare) using each of the 5 different µmaps [Histogram, Dixon and 3 Threshold umaps] and the following parameters: OSEM algorithm, 3 iterations, 21 subsets, 256 matrix and 2mm Gaussian filter. SUVmax values of the aorta wall were measured on matched axial slices of aorta observed on different reconstructions for each patient (syngo.via, Siemens Healthcare). Differences in SUVmax for all 3 patients were plotted against the corresponding average SUVmax, and 95% limits of agreement (95%LoA) were calculated3. Paired t-tests were also performed with the level of significance set at p <0.05 (Minitab 16 Statistical Software. State College, PS: Minitab, Inc).
Results/Discussion
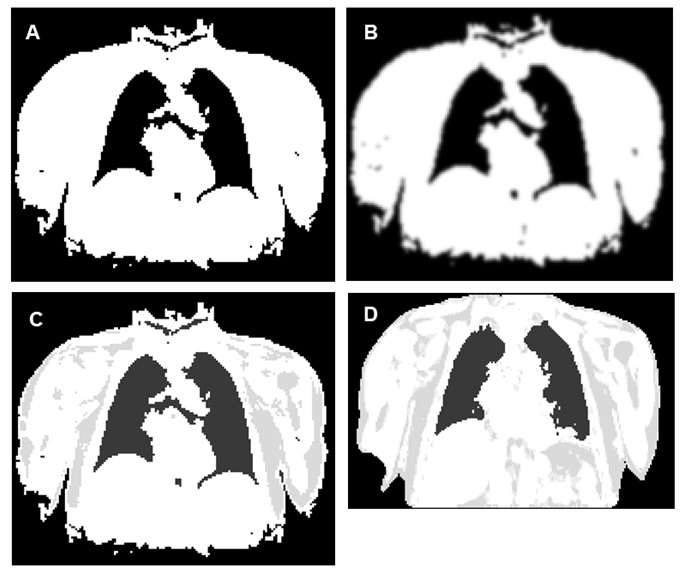
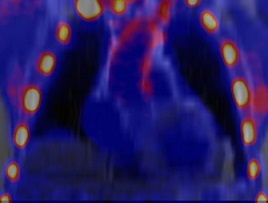
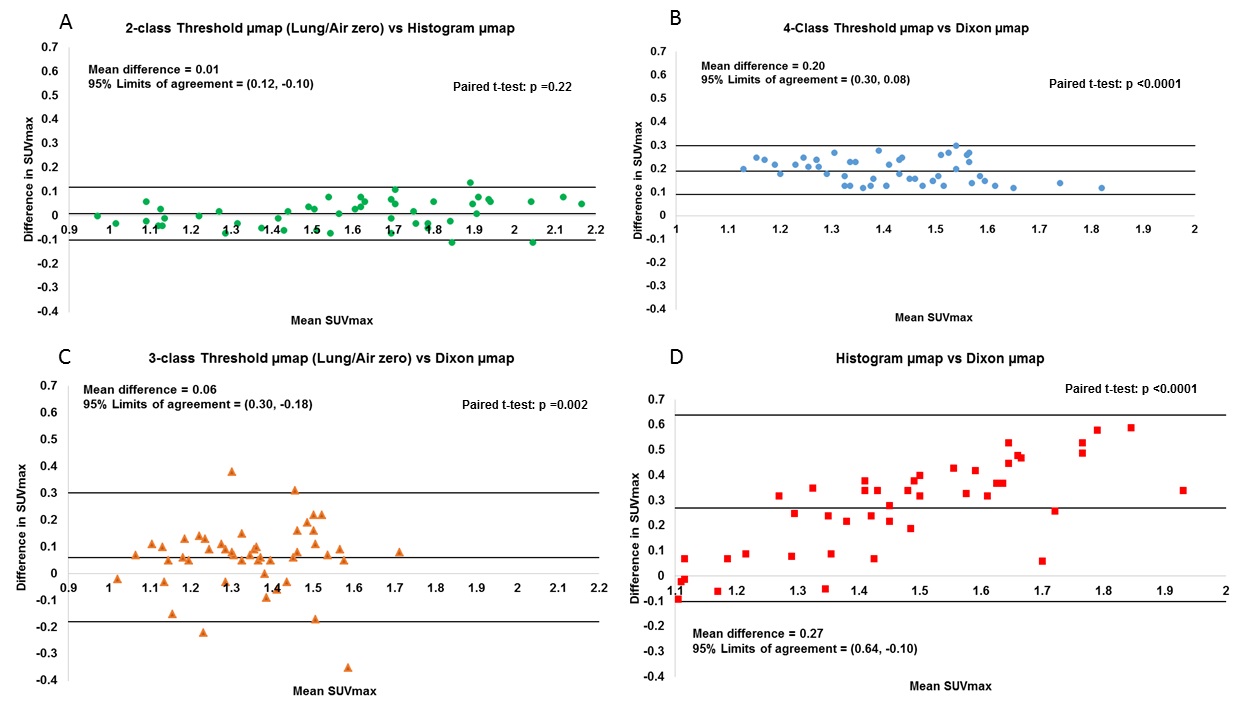
Four µmaps from an example slice, generated for 1 patient, are shown in Figure 1. All µmaps generated from the radial GRE sequence showed improved delineation of the trachea, bronchi and the heart-lung and liver-lung boundaries compared to the Dixon µmap. 18F NaF uptake in the aorta wall is shown in Figure 2 for a PET image reconstructed with a Threshold µmap. All SUVmax data sets followed a normal distribution. Figure 3 shows plots of differences in SUVmax versus mean SUVmax measured from PET images reconstructed using the different µmaps. Corresponding mean differences (Suvmax_MeanDiff), 95%LoA and paired t-test results are also shown. The repeatability coefficient for SUVmax measurements was ±0.07.
No significant difference was observed between PET reconstructions when attenuation correction was performed with the 2-class Threshold µmap or the Histogram µmap (Figure 3A). This demonstrates the equivalence of these methods for creating radial GRE µmaps. PET images reconstructed with the Dixon µmaps resulted in significantly lower aorta wall SUVmax values than those reconstructed with each of the different radial-GRE-based µmaps (Figure 3B-D). SUVmax values measured from 3- and 4-class Threshold µmap reconstructions are closest to those measured from Dixon µmap reconstructions (Figure 3B-C) but a discrepancy still exists. This is likely due to differences in how these methods segment the heart-lung boundaries and bone. This will be addressed in future work.
Conclusion
We have introduced an alternative method for creating radial GRE µmaps that can segment soft tissue, fat, lung, and background air. All radial GRE µmaps showed improved delineation of the heart compared to the Dixon µmap, but significant differences exist when quantifying PET images reconstructed with the Dixon µmap compared to each of the radial GRE µmaps. This study of aorta micro-calcification highlights the importance of characterising the performance of MR-based µmaps before commencing quantitative PET-MRI studies.Acknowledgements
We gratefully acknowledge the support of colleagues at the Translational and Molecular Imaging Institute and the Cardiovascular Institute at the Icahn School of Medicine at Mount Sinai in New York. We sincerely thank them for allowing us to use their technique for generating radial µmaps.
Many thanks to Siemens Healthcare for allowing us to use the Radial Selfgating Package (Work-in-Progress #793F). This Work in Progress is based on contributions from Simon Bauer, Robert Grimm and Matthias Fenchel.
Thanks also to Martin Connell for assistance with PET reconstructions using e7-tools and to Lucy Kershaw and David Morris for useful MATLAB discussions.
References
1. Philip M. Robson, Marc R. Dweck, Maria Giovanna Trivieri, Ronan Abgral, Nicolas A. Karakatsanis, Johanna Contreras, Umesh Gidwani, Jagat P. Narula, Valentin Fuster, Jason C. Kovacic, Zahi A. Fayad. Coronary Artery PET/MR Imaging Feasibility, Limitations, and Solutions. JACC: Cardiovascular Imaging 2017; 10: 1103-12.
2. A. Martinez-Möller, M. Souvatzoglou, G. Delso, R.A. Bundschuh, C. Chefd’hotel, S.I. Ziegler, N. Navab, M. Schwaiger, S.G Nekolla. Tissue classification as a potential approach for attenuation correction in whole-body PET/MRI: Evaluation with PET/CT data. J Nucl Med 2009; 50: 520-6.
3. Martin Bland and Douglas G. Altman. Statistical Methods for Assessing Agreement Between Two Methods of Clinical Measurements. Lancet 1986; i: 307-310.
Figures