3021
Investigating the relationship between perfusion and glucose metabolism by simultaneous PET/MRI in frontotemporal dementia.1Radiology & Nuclear Medicine, Erasmus MC - University Medical Center Rotterdam, Rotterdam, Netherlands, 2NAPLAB - SDN NeuroAnatomy and image Processing LABoratory, IRCCS SDN, Naples, Italy, 3Department of Psychology, University of Campania Luigi Vanvitelli, Caserta, Italy
Synopsis
Arterial spin labeling (ASL)-magnetic resonance imaging (MRI) and fluorodeoxyglucose (FDG)-positron emission tomography (PET) both have diagnostic value for dementia, particularly frontotemporal dementia (FTD). By using simultaneous FDG-PET/ASL-MRI, we investigated the relationship between brain metabolism and perfusion in FTD, to evaluate their suitability and complementarity. Exploratory analysis of simultaneous FDG-PET/ASL-MRI in 15 dementia patients showed that metabolism and CBF correlate well on a global level, both visually and quantitatively. On a regional level, one-on-one correlations are limited, supposedly to disease-specific regions such as frontotemporal, subcortical and parietal regions. These results will be substantiated in a larger and better differentiated dementia cohort.
Introduction
Magnetic resonance imaging (MRI) and positron emission tomography (PET) both have diagnostic value for dementia. Both modalities can capture changes in neuronal function occurring early in the disease process, by measuring brain metabolism with fluorodeoxyglucose (FDG)-PET and brain perfusion using arterial spin labeling (ASL)-MRI1,2. Frontotemporal dementia (FTD) in particular has a typical hypometabolic pattern, which is highly clinically relevant for differential diagnosis3. More recently, ASL has been proposed as a noninvasive alternative for PET with similar clinical utility4. Although metabolism and perfusion are tightly coupled5, on a detailed level discrepancies exist between FDG-PET and ASL-MRI, as there is not necessarily a one-to-one correlation between brain perfusion and metabolism. A systematic comparison with FDG-PET could pave the way for ASL’s introduction as a clinical tool.
Simultaneous PET-MR offers a unique opportunity to investigate the relationship between concurrent phenomena measured by MR and PET at the same physiological condition, to evaluate their suitability and complementarity as imaging markers for dementia. In this study we aim to explore the relationship between brain metabolism and perfusion in dementia acquired with simultaneous FDG-PET/ASL-MRI.
Methods
Patients suspected of frontotemporal dementia (FTD), both behavioral variant (bvFTD) and primary progressive aphasia (FTD-PPA) phenotype, were included in the current study.
All patients underwent simultaneous FDG-PET/ASL-MRI on a 3T Siemens Biograph mMR. PET data acquisition started 30 min after the injection of 18-FDG (3.5 MBq/Kg). The volume consists of 127 images with matrix size 256×256 and voxel size 4.1×2.6×3.1mm. For reconstruction details see Aiello et al.6 The MRI protocol included a transversal T1-weighted 3D-encoded gradient-echo sequence (TR/TE 2400/2.25ms; slice thickness 0.8mm; flip angle 8°; matrix size 256×256×240); 2D FLAIR sequence (TR/TE 9000/95ms; inversion time 2500ms; matrix size 256×256; slice thickness 4mm); transversal pseudo-continuous arterial spin labeling (20 slices of 5mm thickness, FOV 220x220mm2, matrix 64x64, TR/TE 3760/12ms, flip angle 90°, 90 acquisitions). The M0 control image sequence was replaced by the equilibrium magnetization value.
Cerebral blood flow (CBF) images in ml/100g of gray matter/min7 were calculated using the Matlab toolbox ASLtbx8. CBF and PET images were qualitatively compared by means of visual comparison. Subsequently, CBF and PET counts were extracted from 90 supratentorial cortical regions from the AAL Atlas using Marsbar9. To normalize intensities for a direct comparison, both FDG-PET and ASL values in these regions were transformed to z-scores. Pearson’s correlation coefficients between FDG-PET metabolism and ASL-CBF were determined within-subject and across regions using SPSS (p<0.05).
Results
15 patients were included (mean age 66.3±9.1 years, 5 female). After clinical evaluation of PET/MR imaging findings, four patients were diagnosed with bvFTD and 4 with FTD-PPA. The remaining 7 patients were diagnosed with progressive supranuclear palsy (n=1), gray matter heterotopia (n=1), and cerebrovascular disease (n=5).
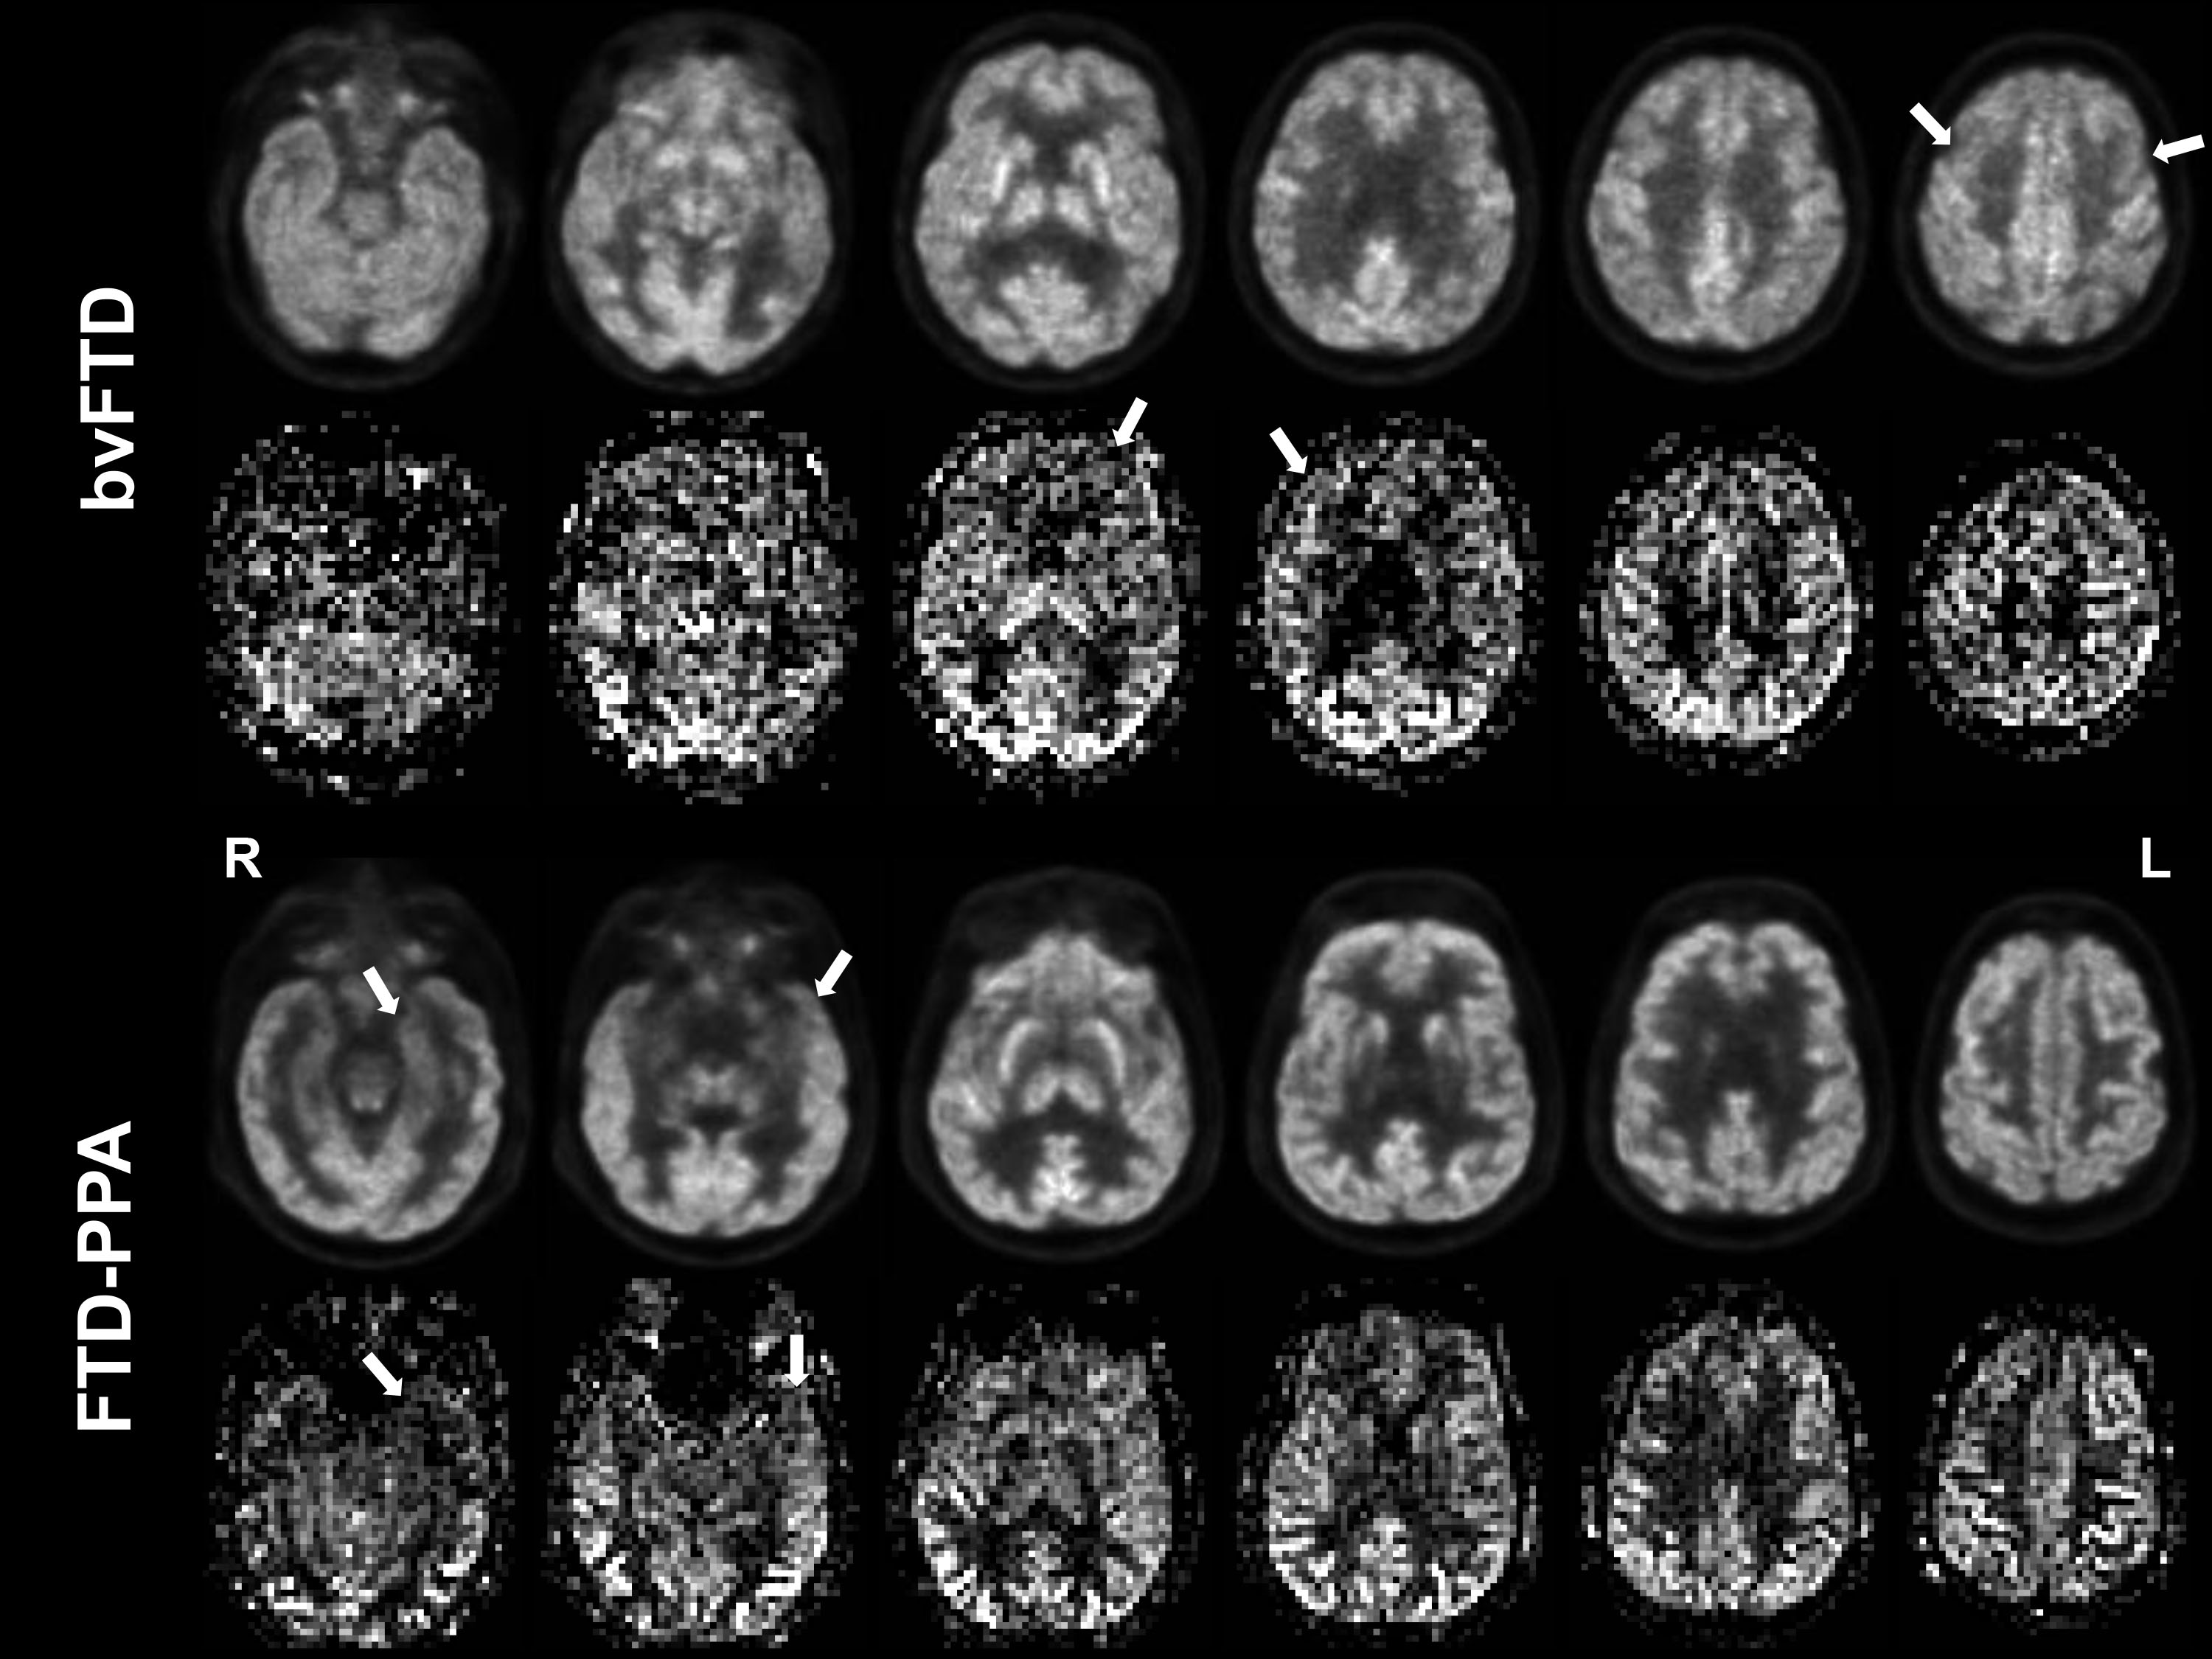
Qualitative comparison showed an overall visual correspondence between FDG-PET and ASL-CBF (Figure 1). In some cases, regional PET hypometabolism was slightly more evident than hypoperfusion. These visual differences could be due to the inherent susceptibility artefacts in the frontal areas in ASL.
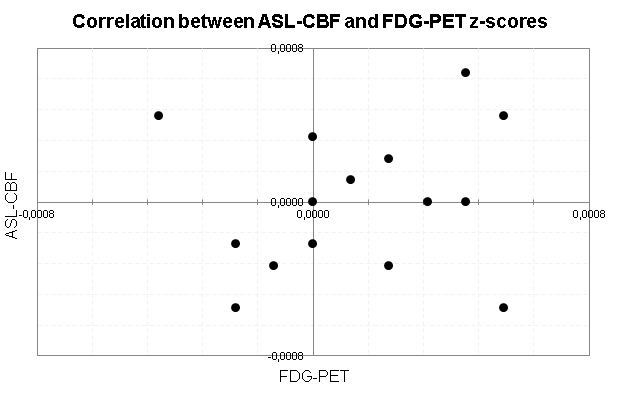
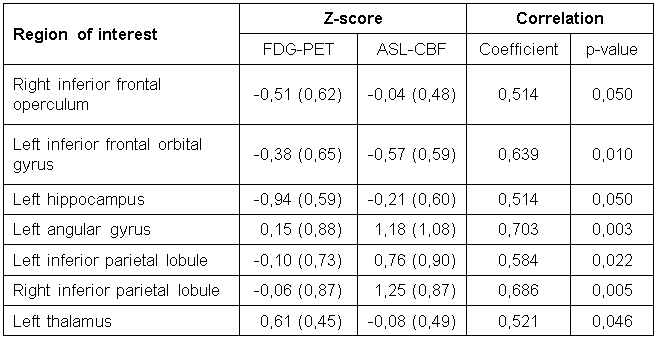
Within-subject correlations between ASL-CBF and FDG-PET across all 90 regions were significant in 13 out of 15 patients, ranging between r = .352 and .613. Correlations are plotted in Figure 2. When correlating the 90 regions across patients, 7 regions showed a significant positive one-on-one regional correlation between FDG metabolism and ASL-CBF (Table 1).
Discussion
Overall, simultaneous FDG-PET/ASL-MRI showed reasonable visual correspondence in a sample of suspected FTD patients. Moreover, the spatial distribution of FDG-PET and ASL-CBF maps significantly correlated within-subject across 90 supratentorial cortical regions. One-on-one regional correlations were limited to the bilateral inferior frontal operculum and inferior parietal cortex, as well as the left angular gyrus, hippocampus, and thalamus. This may be driven by the confirmed FTD patients in the sample, in whom neuronal dysfunction is known to occur in the frontal, temporal, and subcortical regions10 and as such captured by both FDG-PET and ASL-MRI. Parietal dysfunction is less common but also occasionally reported11. Moreover, correlational methodology allows for the detection of incipient abnormalities that may go undetected in comparative group analyses12.Conclusion
Exploratory analysis of simultaneous FDG-PET/ASL-MRI in 15 dementia patients shows that metabolism and CBF correlate quite well on a global level, both visually and quantitatively. On a regional level, one-on-one correlations are limited, supposedly to disease-specific regions. Future work is directed at driving forward the emerging strong correlation between FDG-PET and ASL, to definitively demonstrate in a large and better differentiated cohort of dementia patients the clinical suitability of ASL in dementia diagnosis, and furthermore at enabling the quantitative and topographic correlation of pathophysiological changes in dementia.Acknowledgements
No acknowledgement found.References
1. Chen Y, Wolk DA, Reddin JS, et al. Voxel-level comparison of arterial spin-labeled perfusion MRI and FDG-PET in Alzheimer disease. Neurology. 2011;77:1977-85.
2. Musiek ES, Chen Y, Korczykowski M, et al. Direct comparison of fluorodeoxyglucose positron emission tomography and arterial spin labeling magnetic resonance imaging in Alzheimer's disease. Alzheimers Dement. 2012;8:51-9.
3. Rohrer JD, Rosen HJ. Neuroimaging in frontotemporal dementia, Int Rev Psychiatry. 2013;25(2):221-229
4. Grade M, Hernandez Tamames, Pizzini FB, et al. A neuroradiologist's guide to arterial spin labeling MRI in clinical practice. Neuroradiology. 2015;57(12):1181-202.
5. Raichle ME. Behind the scenes of functional brain imaging: a historical and physiological perspective. Proc Natl Acad Sci USA. 1998;95:765-72.
6. Aiello M, Salvatore E, Cachia A, et al. Relationship between simultaneously acquired resting-state regional cerebral glucose metabolism and functional MRI: a PET/MR hybrid scanner study. Neuroimage. 2015;113:111-21
7. Wang J, Zhang Y, Wolf RL, et al. Amplitude-modulated continuous arterial spin-labeling 3.0-T perfusion MR imaging with a single coil: feasibility study. Radiology. 2005;235(1):218-28.
8. Wang Z, Aguirre GK, Rao H, et al. Empirical optimization of ASL data analysis using an ASL data processing toolbox: ASLtbx. Magn Reson Imaging. 2008;26(2):261-269.
9. Brett M, Anton J, Valabregue R, et al. Region of interest analysis using an SPM toolbox [abstract] Presented at the 8th International Conference on Functional Mapping of the Human Brain, June 2-6, 2002, Sendai, Japan. Available on CD-ROM in NeuroImage, Vol 16, No 2.
10. Zhang Y, Schuff N, Ching C, et al. Joint assessment of structural, perfusion, and diffusion MRI in Alzheimer's disease and frontotemporal dementia. Int J Alzheimers Dis. 2011:546871
11. Binnewijzend MA, Kuijer JP, van der Flier WM, et al. Distinct perfusion patterns in Alzheimer's disease, frontotemporal dementia and dementia with Lewy bodies. Eur Radiol. 2014;24(9):2326-2333.
12. Steketee RME, Meijboom R, de Groot M. Concurrent white and gray matter degeneration of disease-specific networks in early-stage Alzheimer's disease and behavioral variant frontotemporal dementia. Neurobiol Aging. 2016;43:119-28.
Figures