3020
Radiotracer dose reduction in 18F-FDG whole-body PET/MR: Effects on image quality and quantification1Highfield- and Hybrid MR Imaging, University Hospital Essen, Essen, Germany, 2Department of Nuclear Medicine, University Hospital Essen, Essen, Germany, 3Department of Diagnostic and Interventional Radiology, University Hospital Düsseldorf, Düsseldorf, Germany, 4Department of Diagnostic and Interventional Radiology and Neuroradiology, University Hospital Essen, Essen, Germany, 5Erwin L. Hahn Institute for Magnetic Resonance Imaging, Essen, Germany
Synopsis
The study goal is to investigate how the simulated reduction of injected radiotracer affects PET image quality and quantification in whole-body PET/MR in patients with oncologic findings. PET data of fifty-one patients was reconstructed with 4, 3, 2 and 1 minute/bed time interval. Image quality parameters were analyzed. As expected, the image quality decreases with shorter PET image acquisition times. Besides the two key factors acquisition time and injected activity, the image quality is influenced by the BMI. A lower BMI results in better image quality parameters. 2 minutes acquisition time per bed is sufficient to provide accurate lesion detection.
Purpose
In contrast to positron emission tomography/computed tomography (PET/CT) integrated PET/magnetic resonance (PET/MR) inherently reduces the overall patient radiation dose by replacing the ionizing CT modality by nonionizing MR imaging [1]. Moreover, the simultaneous data acquisition in PET/MR provides latitude for further reduction of the radiation dose. The rather long PET acquisition times to match the prolonged MR examinations may allow for a decrease in applied radiotracer activity [2]. The study goal, thus, is to investigate how the simulated reduction of injected radiotracer affects PET image quality and quantification in whole-body PET/MR in patients with oncologic findings.Methods
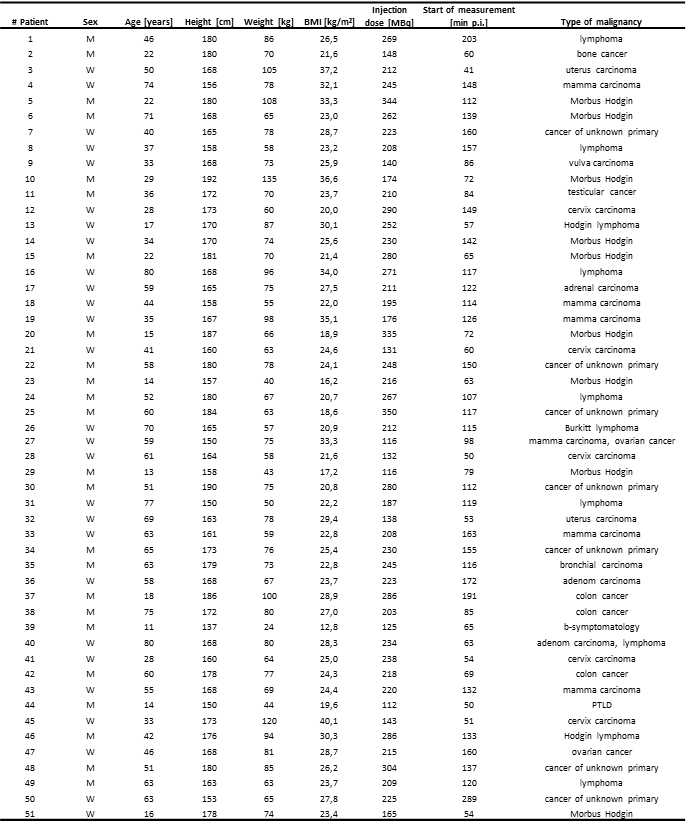
Fifty-one patients with different oncologic findings underwent a clinical whole-body 18F-Fluorodesoxyglucose PET/MR examination with 4 min acquisition time per bed position. Detailed patient information is listed in Tab.1. PET data in list-mode format was reconstructed with 4, 3, 2, and 1 min/bed time intervals for each patient. The 4-minute PET reconstructions served as reference standard. All whole-body PET data sets with four time intervals for each patient were reconstructed and analyzed regarding image quality, lesion detectability, PET quantification and standardized uptake values. Region-of-interests-analyses were generated in all detectable lesions, the liver, and in the mediastinal blood pool. Signal-to-noise ratio, contrast-to-noise ratio and image noise for each timeframe were calculated. An image quality score was defined (0 = non-diagnostic, 1 = poor, 2 = moderate, and 3 = good).Results
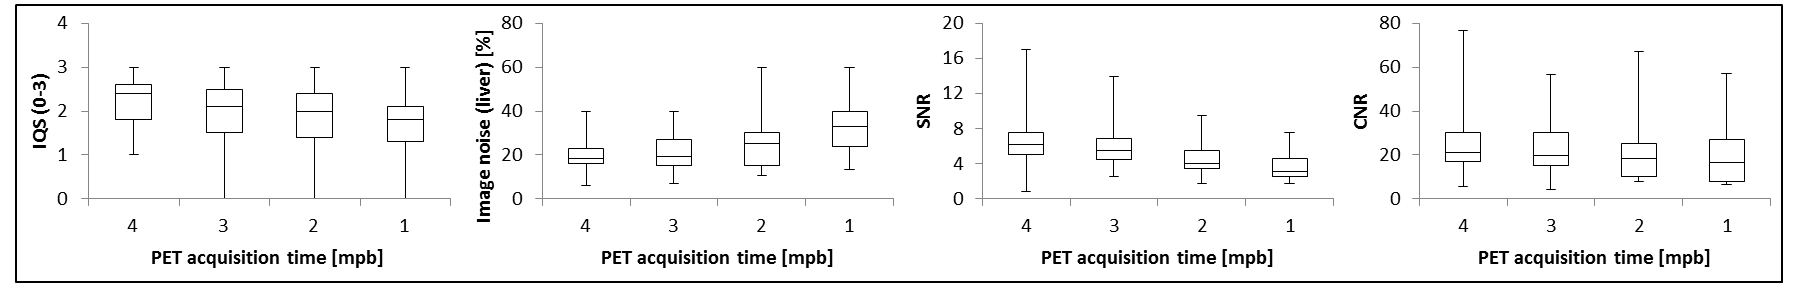
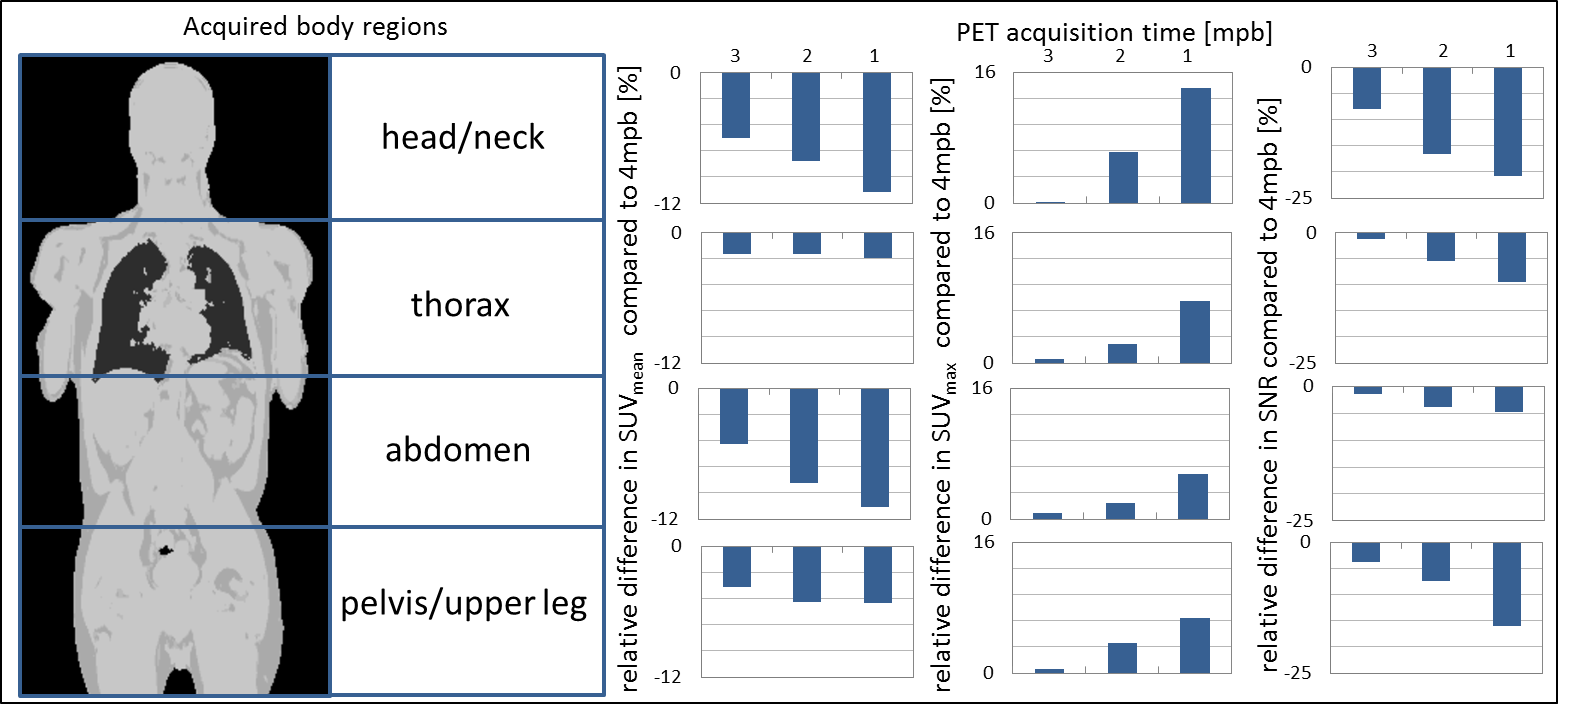
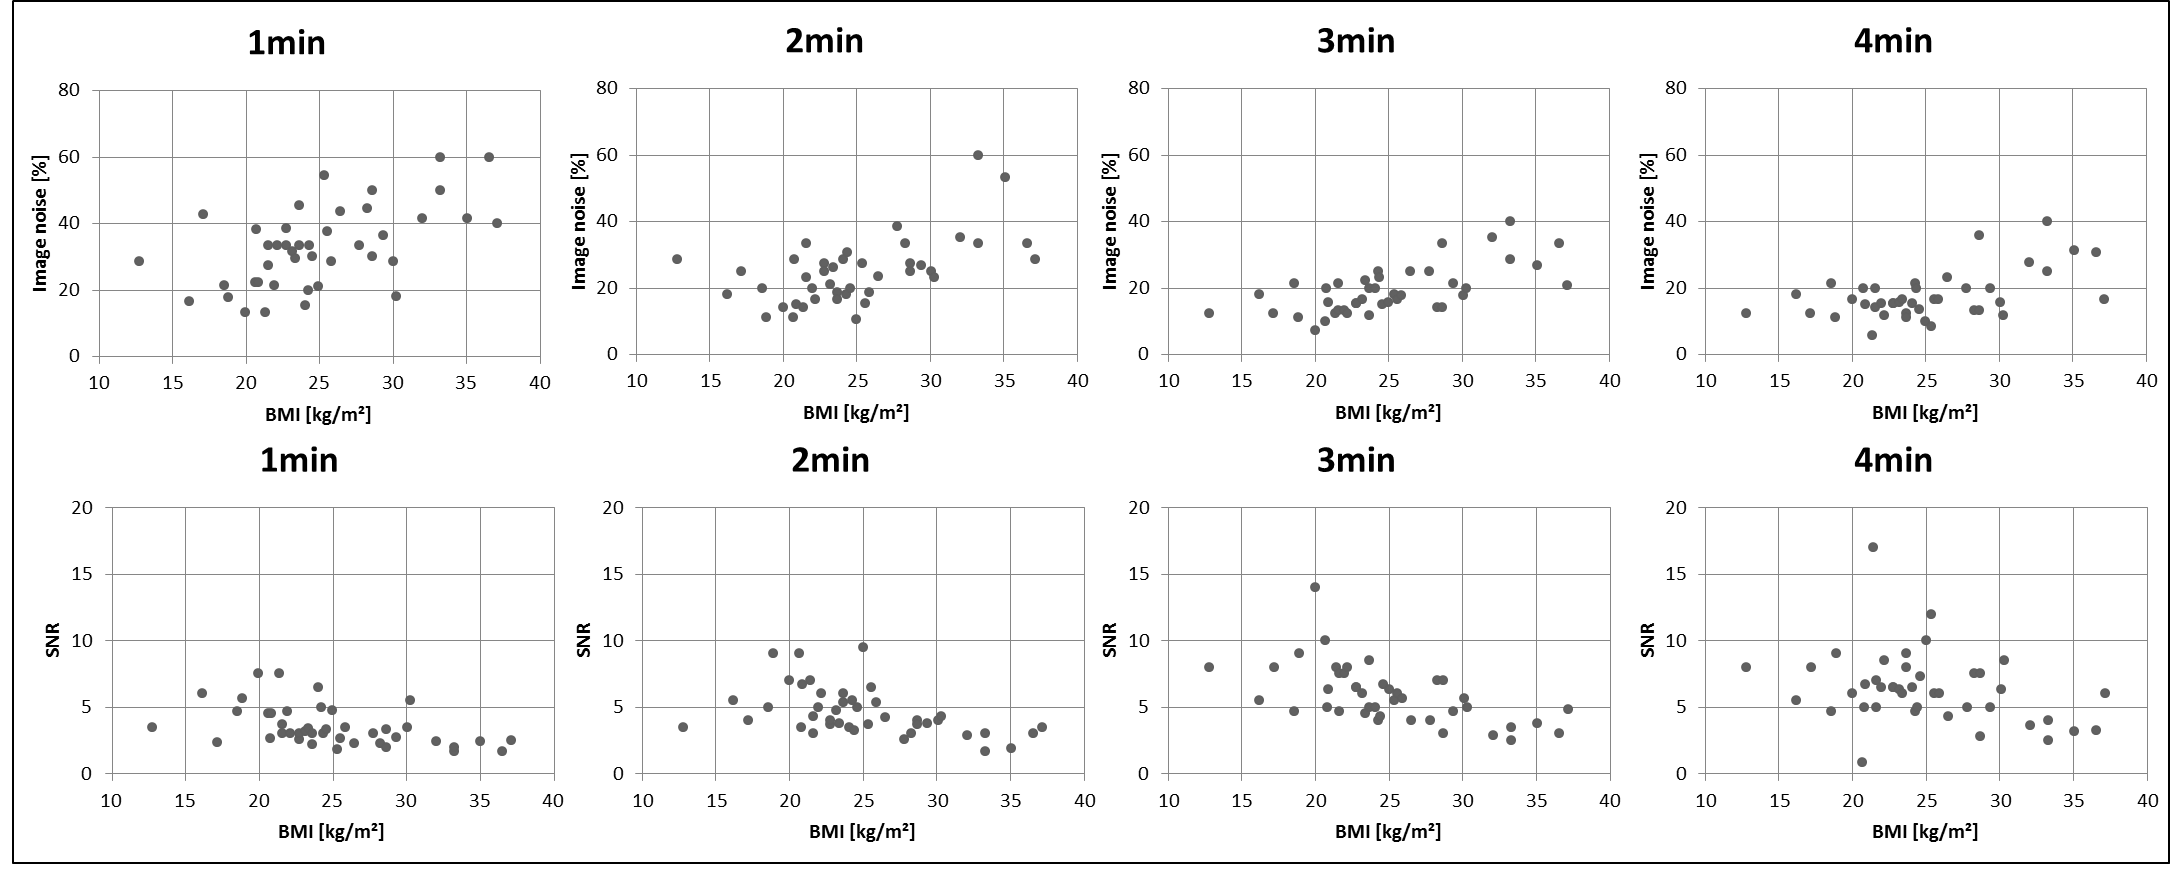
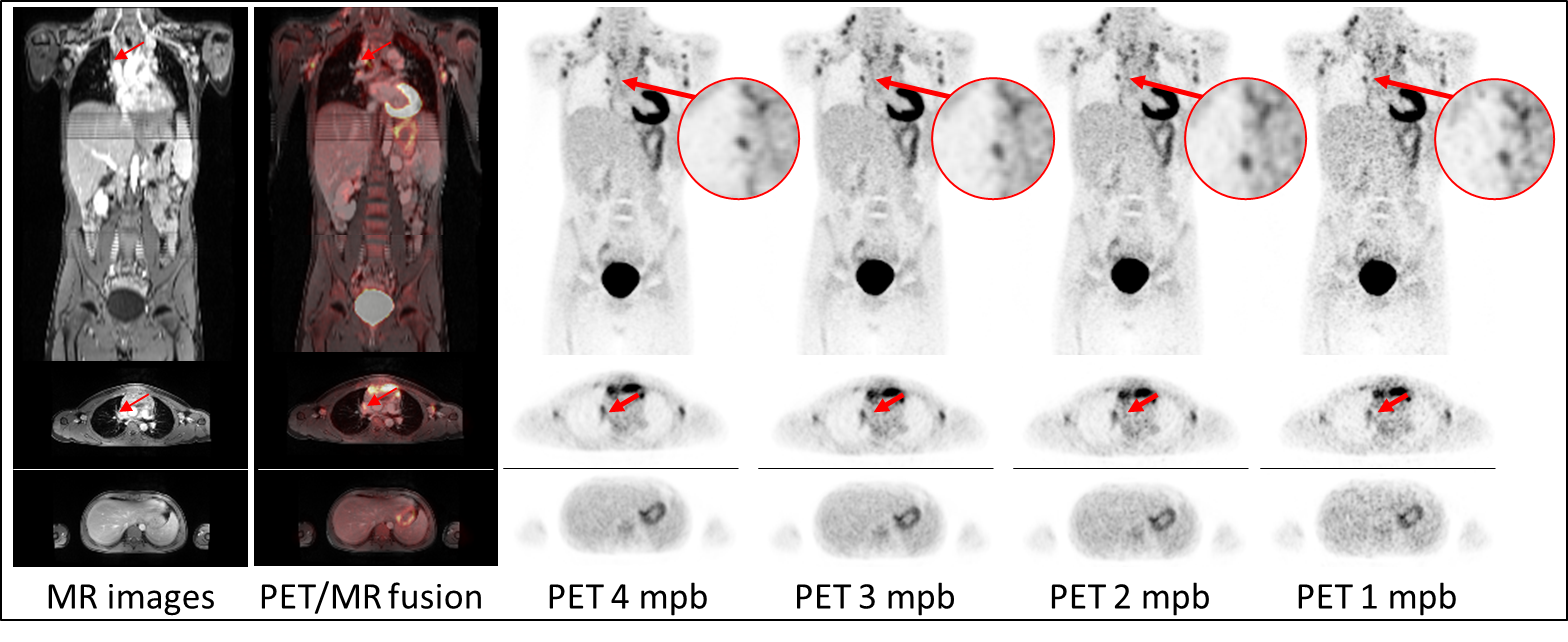
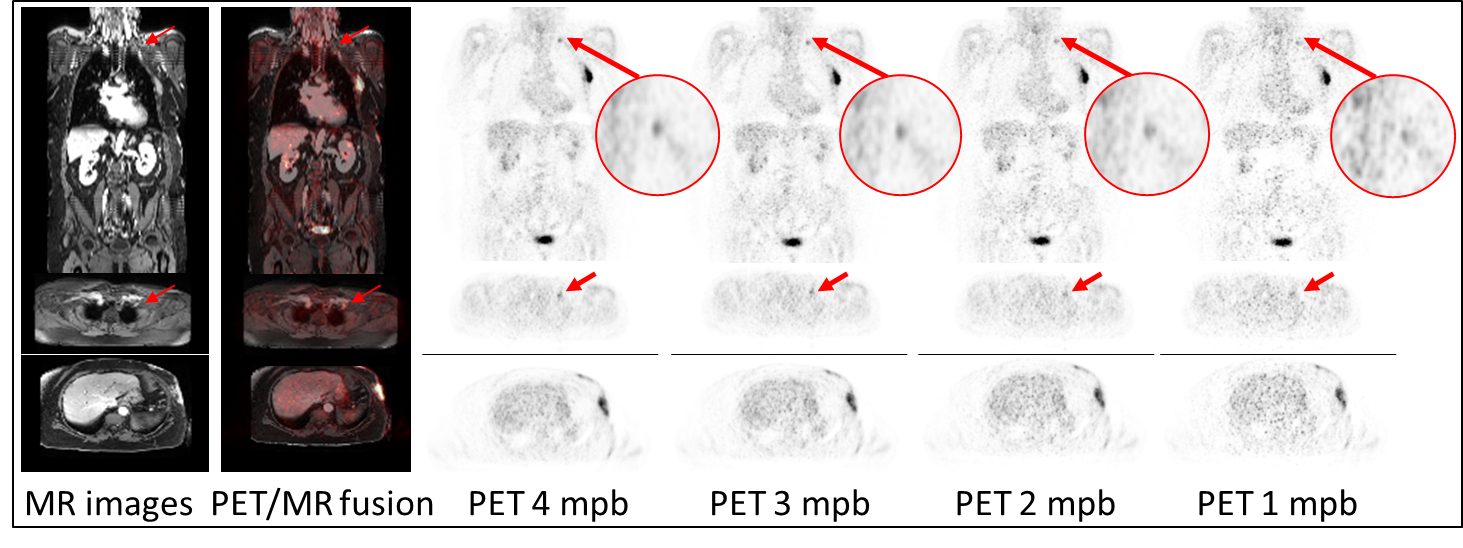
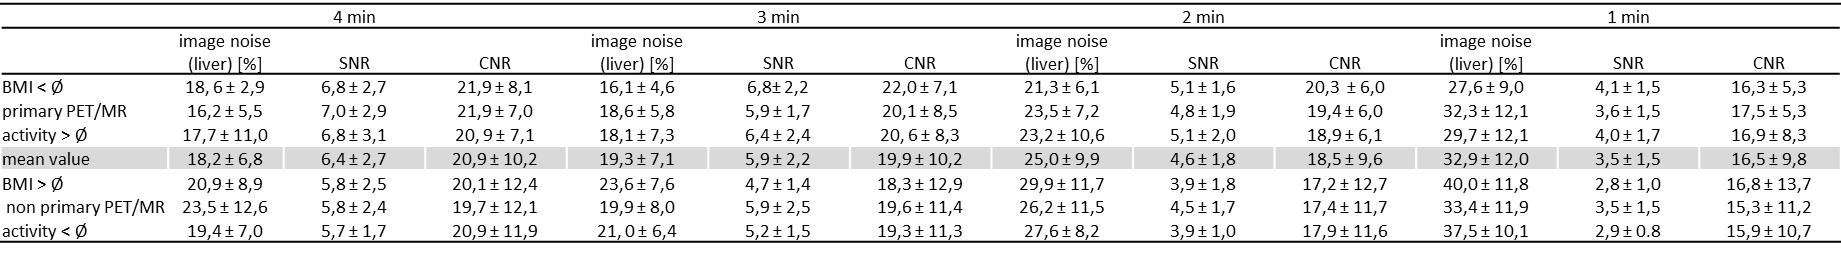
A total of 91 lesions were detected in the 4-minute PET reconstructions. The same number of congruent lesions was also noticed in the 3 and 2 mpb reconstructed images. A total of 2 lesions in 2 patients was not detected in the 1 minute PET data reconstructions due to poor image quality. The results of image quality parameters are shown in Fig.1. The image noise in the liver increased from 18.2 % in the 4 min timeframe to 32.9 % in the 1 min timeframe. The image quality score decreased from 2.4 at 4 mpb to 1.8 at 1 mpb. The signal-to-noise ratio also declined with shorter timeframes from 6.4 (4 mpb) to 3.5 (1 mpb). The contrast-to-noise ratio decreased from 20.9 at 4 mpb to 16.5 at 1 mpb. SUVmean and SUVmax showed no significant changes between 4 and 1 mpb reconstructed timeframes. Fig.2 depicts the overview of SUVs and SNR of detected lesion in four different body regions. In the head/neck region the differences in SUVs and SNR between 4 mpb and shorter reconstructed acquisition times is highest. The impact of reduced PET acquisition times on image quality and quantification parameters is lower for the thorax and pelvic body regions. Table 2 shows, that a lower BMI, a short time interval between activity injection and PET/MR examination and a higher activity are optimal conditions to obtain high image quality regardless of different PET reconstruction times. Besides the two key factors acquisition time and injected activity, the image quality is influenced by the BMI (Figure 3). A lower BMI results in better image quality parameters. Fig.4 depicts a patient example of consistently high image quality scores even in shorter imaging duration. The lesion is detectable in all image reconstructions. Fig.5 shows a patient example of significantly decreasing image quality with shorter PET acquisition times. The marked lesion is not detectable in in the 1 mpb reconstruction.Discussion and Conclusion
The study setup with retrospective reconstruction of PET data in list-mode format into different time-intervals allowed for a systematic and controlled evaluation of image quality and quantitative parameters. This allows eliminating numerous confounding factors that would have been present when multiple tracer injections and PET re-examinations would have been performed [3]. As expected, the image quality decreases with shorter PET image acquisition times. Besides the two key factors acquisition time and injected activity, the image quality is influenced by the BMI. A lower BMI results in better image quality parameters. Reconstruction of whole-body PET data with different time intervals has shown that 2 minutes instead of 4 minutes acquisition time per bed position is sufficient to provide accurate lesion detection, high image quality, SNR and CNR despite the trends to lower image quality with shorter PET acquisition times [4]. This result provides the foundation for the potential to reduce the PET acquisition time in fast 18F-FDG whole-body PET/MR imaging protocols [5, 6]. Another conclusion of this study is that radiotracer dose may be further reduced in 18F-FDG whole-body PET/MR in patients with oncologic findings while maintaining high image quality and accurate PET quantification.Acknowledgements
No acknowledgement found.References
1. Drzezga A, Souvatzoglou M, Eiber M, et al. First clinical experience with integrated whole-body
PET/MR: comparison to PET/CT in patients with oncologic diagnoses. J. Nucl. Med.
2012; 53:845-855.
2. Oehmigen M, Ziegler S, Jakoby BW, Georgi JC, Paulus DH, Quick HH. Radiotracer dose reduction in integrated PET/MR: implications from national electrical manufacturers association phantom studies. J. Nucl. Med. 2014; 55:1361-1367.
3. Gatidis S, Würslin C, Seith F, et al. Towards tracer dose reduction in PET studies: Simulation of dose reduction by retrospective randomized undersampling of list-mode data. Hell. J. Nucl. Med. 2016; 19:15-18.
4. Hartung-Knemeyer V, Beiderwellen KJ, Buchbender C, et al. Optimizing positron emission tomography image acquisition protocols in integrated positron emission tomography/magnetic resonance imaging. Invest. Radiol. 2013; 48:290-294.
5. Grueneisen J, Schaarschmidt BM, Heubner M, et al. Implementation of FAST-PET/MRI for whole-body staging of female patients with recurrent pelvic malignancies: A comparison to PET/CT. Eur J Radiol. 2015 Nov;84(11):2097-102
6. Kirchner J, Sawicki LM, Suntharalingam S, et al. Whole-body staging of female patients with recurrent pelvic malignancies: Ultra-fast 18F-FDG PET/MRI compared to 18F-FDG PET/CT and CT. PLoS One. 2017 Feb 22;12(2):e0172553.
Figures