3016
Frequency Dependence of Anisotropic Material Properties Estimated form Cardiac Magnetic Resonance Elastography: An In Silico Study1Anatomy and Medical Imaging, University of Auckland, Auckland, New Zealand, 2Auckland Bioengineering Institute, University of Auckland, Auckland, New Zealand, 3The Ohio State University Wexner Medical Center, Ohio State University, Columbus, OH, United States, 4Department of Engineering Science, University of Auckland, Auckland, New Zealand
Synopsis
Despite the anisotropy of myocardium, previous cardiac MR elastography studies have investigated isotropic stiffness of heart tissue. Anisotropic material properties could provide a better understanding of structural changes that occur in the heart due to pathologies such as diastolic heart failure. However, optimal imaging parameters to measure anisotropic properties are yet unknown. This study investigates the optimal loading frequency that accurately recovers anisotropic stiffness measurements using simulations of cardiac MR elastography experiments in the presence of Gaussian noise and known fibre orientations. The optimised virtual fields method is used as an inversion method to translate harmonic displacements to stiffness parameters.
Introduction
Myocardial stiffness is an important determinant of cardiac function, and significant increases in global stiffness are thought to be associated with some forms of diastolic heart failure1. Although magnetic resonance elastography (MRE) has been previously used to estimate isotropic stiffness in the heart, myocardium has anisotropic material properties with greatest stiffness along the fibre direction. In addition to anisotropy, the heart provides significant challenges to MRE due to thin-walled structure2. At loading frequencies below 60 Hz, not enough wavelengths are present within the thin wall to accurately estimate material properties since at least half of one wavelength is needed. Biological tissue, including myocardium, is viscous and results in large wave attenuation at frequencies greater than 200 Hz. Previous studies, estimating isotropic shear moduli within myocardium, have used frequencies ranging from 80 Hz – 220 Hz. It is unknown, however, the optimal loading frequencies for estimating anisotropic material properties. Therefore, this study investigated the impact of loading frequency on the estimation of transversely isotropic material properties in silico in a left ventricular (LV) model with simulated harmonic displacements.Methods
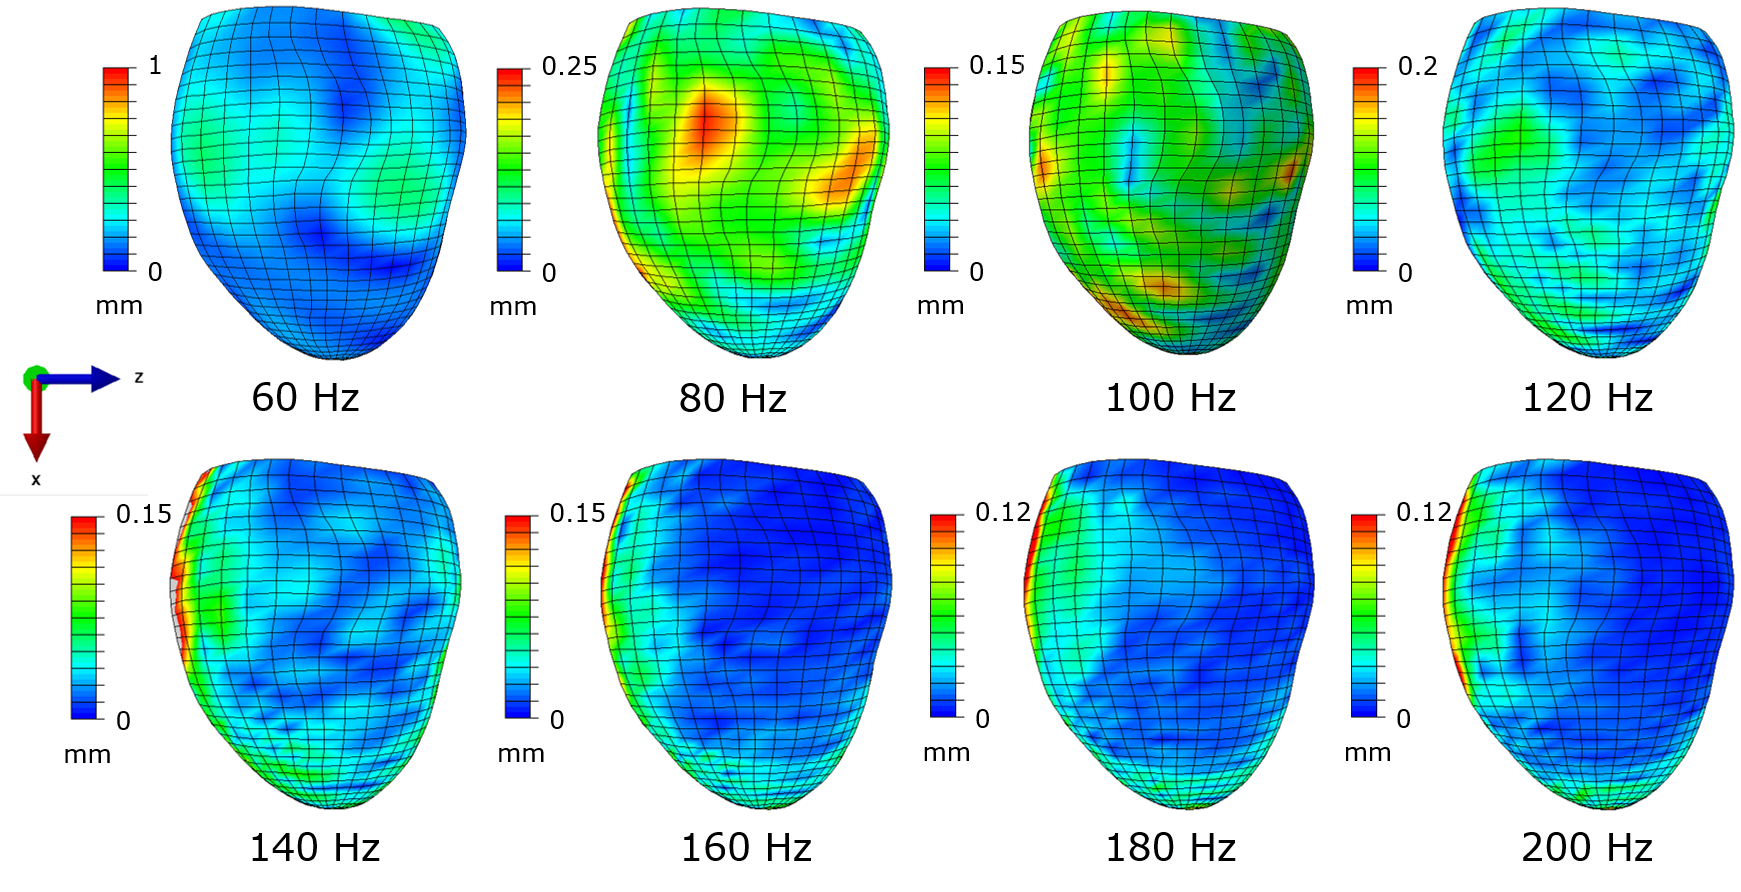
The optimised virtual fields method2,3 (VFM) was used to estimate homogeneous transversely isotropic material properties from simulated harmonic displacements in a canine LV model with fibre orientations measured from histology. Simulations of steady-state harmonic displacement were run at loading frequencies ranging from 60 Hz – 200 Hz (Figure 1). A Monte Carlo simulation was run at each frequency (n = 30) in which the five independent properties of the elasticity matrix (C11, C33, C13, C44 and C66), which fully describe a transversely isotropic material, were estimated from reference displacements with added Gaussian noise (σNoise = 15% · σDisp). Material constants (G12, G13, E1, E3 and v31) were then calculated from the inverse of the elasticity matrix. A similar Monte Carlo simulation was run estimating three parameters4,5 (G12, G13 and τ), which avoided estimation of the longitudinal wavelength. The optimised VFM is an iterative method and the maximum number of iterations was set to 30.Results
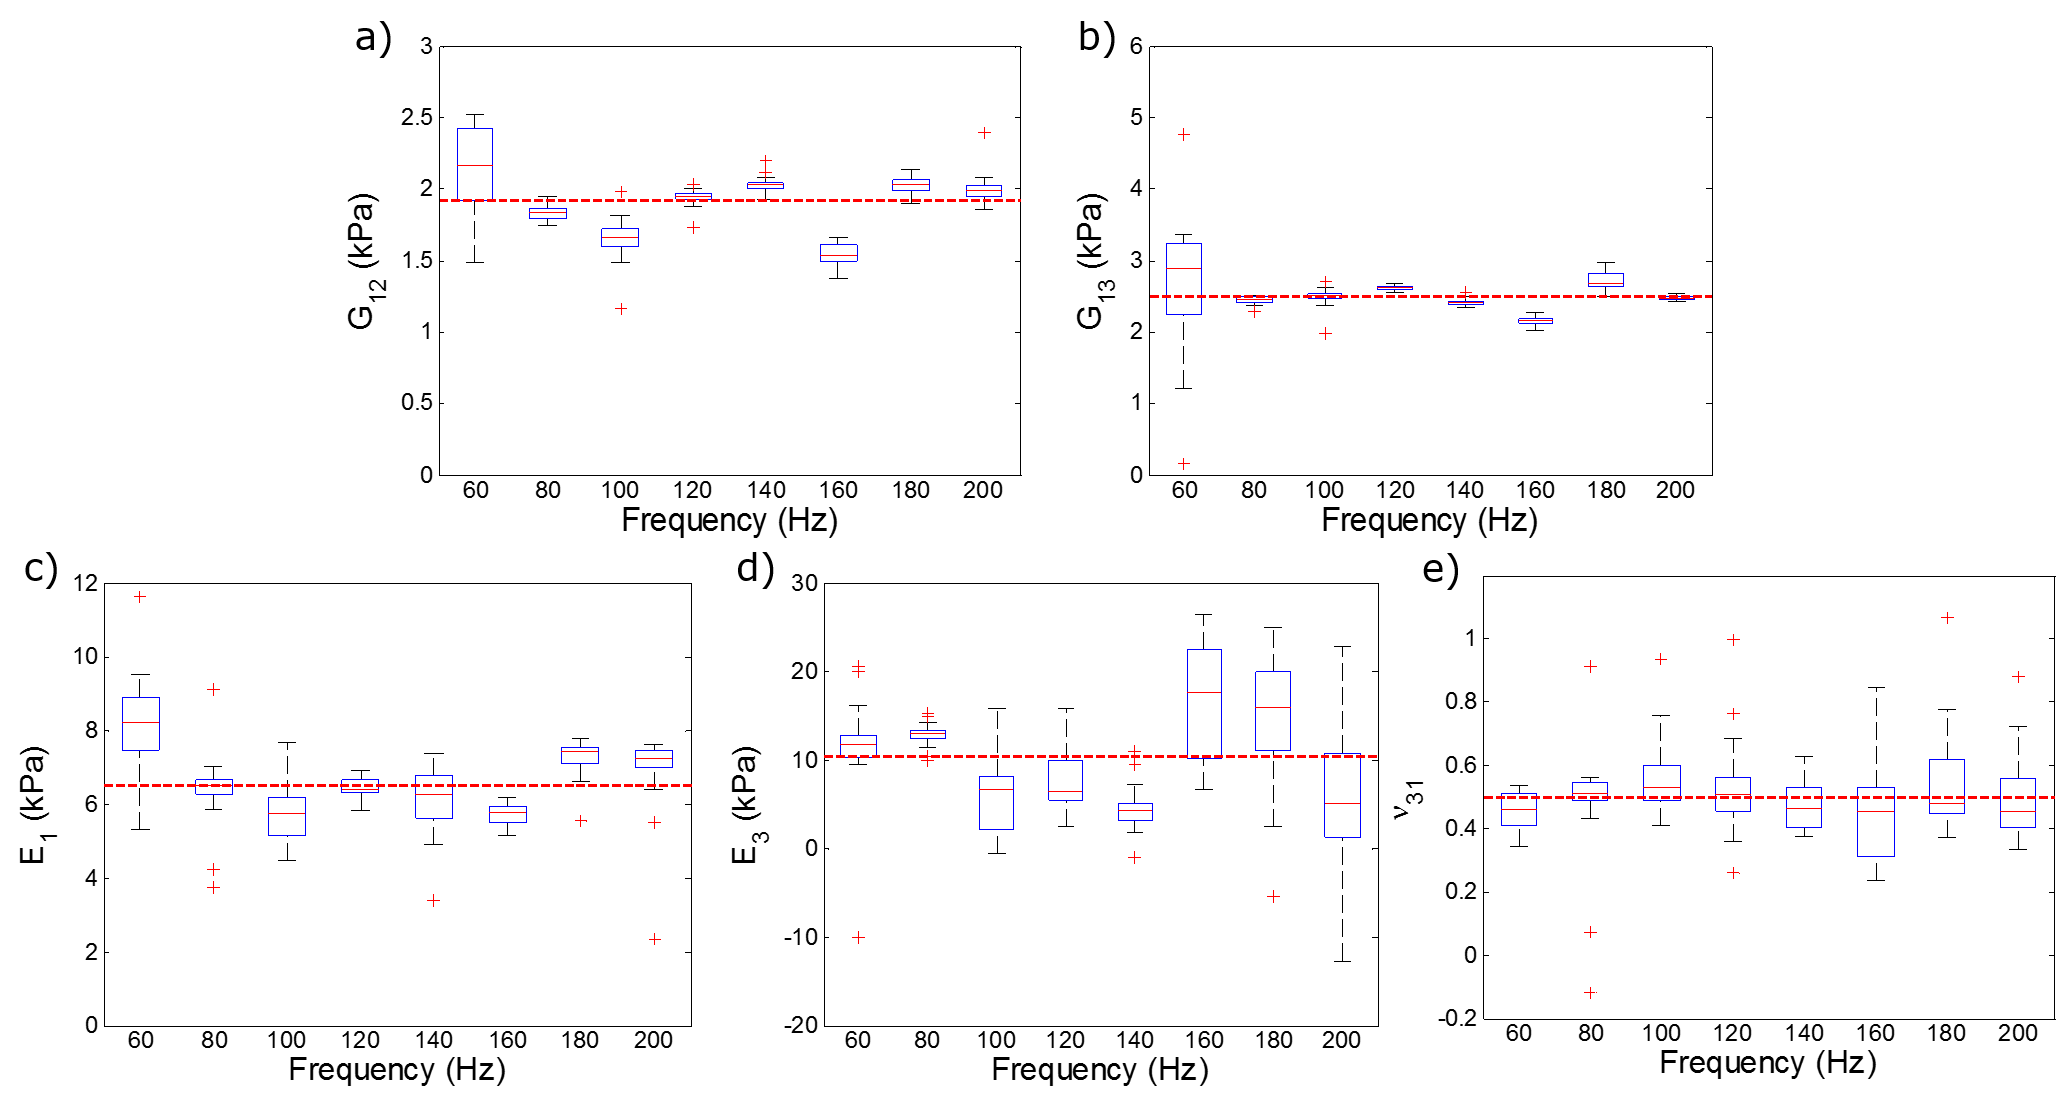
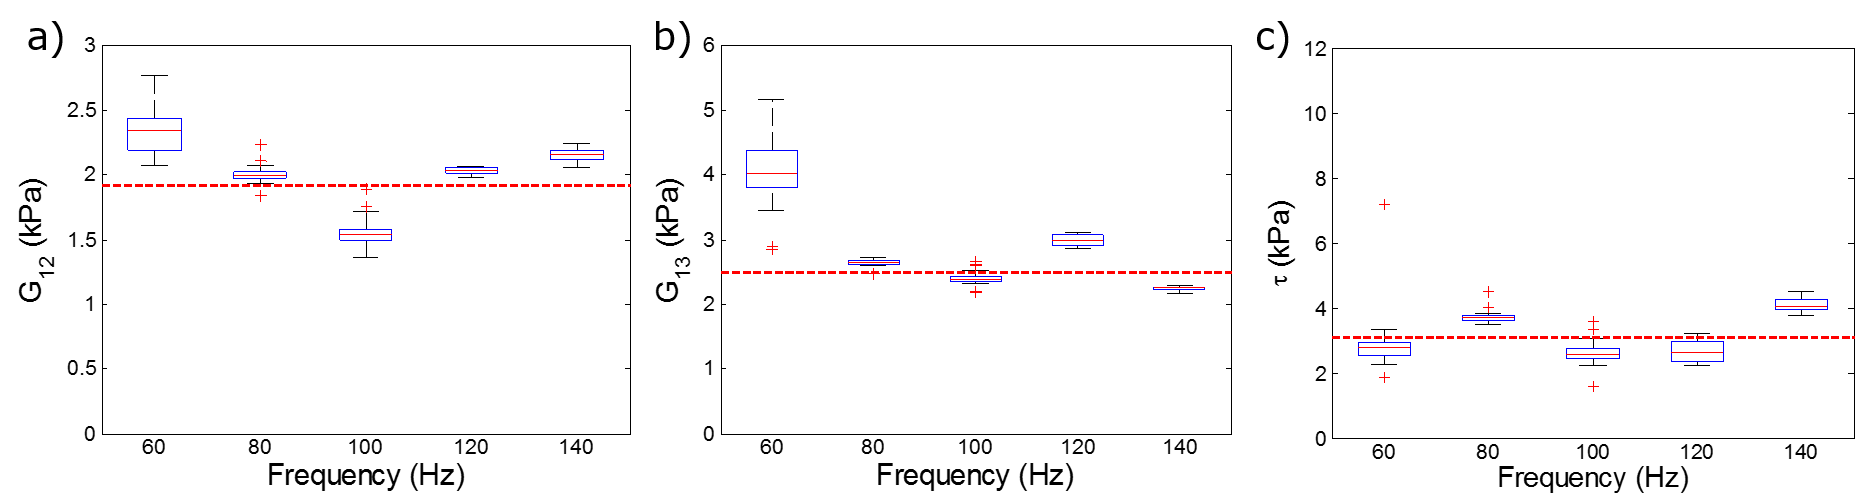
Without noise, the estimated values of the shear moduli and Young's moduli varied over the frequency range but there was no clear difference in parameter estimates with increasing frequency. In the Monte Carlo simulations with Gaussian noise, the number of converged simulations (out of 30) for the five-parameter formulation increased as the frequency increased (Table 1). Conversely, no simulations converged for the three-parameter formulation at 160 Hz, 180 Hz and 200 Hz. Figures 2 and 3 show box plots of the resulting estimated material parameters for the five- and three-parameter formulations, respectively. With the five-parameter material formulation, G13 was most accurately estimated and had the smallest variance at 200 Hz. However, estimated values of E3 showed the most variation at 200 Hz. At 100 Hz and 160 Hz, G12 and E1 were underestimated. Estimated Poisson's ratios were centred at the true values yet varied widely. With the three-parameter formulation, loading at 80 Hz resulted in the most accurate estimation of all three parameters: G12, G13 and τ. Results at 60 Hz showed the largest variance compared with resulting estimated parameters at other frequencies.Discussion
When estimating five parameters, improved convergence at higher frequencies did not correlate with a decrease in variance in all estimated parameters. Variance in estimated values of G13 generally decreased whereas the variance in E3 generally increased. Therefore, when choosing the frequency of excitation, better convergence (at a higher frequency) may not necessarily result in accurate parameter estimates. In the three-parameter formulation, convergence did not improve at higher frequencies. Therefore, the material model-formulation also had a large impact on the accuracy, variance and convergence of anisotropic parameter estimates.
Conclusions
Overall, frequency of excitation had a large impact on both the convergence of the optimised VFM as well as variance and accuracy of estimated transversely isotropic material properties. It was shown that estimates were poor for both formulations at 60 Hz, due to not enough wavelengths present in the myocardium. When identifying transversely isotropic material properties from cardiac MRE, these results showed that frequencies between 80 Hz – 140 Hz should be used in order to obtain adequate convergence using the optimised VFM as well as estimated parameters with minimal variance. Accurate measurements of anisotropic parameters from cardiac MRE could improve the understanding of diseases such as diastolic heart failure, which alters the material properties of myocardium.Acknowledgements
This research was supported by awards from the National Heart Foundation of New Zealand, American Heart Association 13SDG14690027, NHLBI R01HL124096 and The Royal Society of New Zealand Marsden Fund. The authors wish to acknowledge NeSI high performance computing facilities (https://www.nesi.org.nz) for their support of this research. The canine LV geometric model was provided by Dr. Vicky Wang at the Auckland Bioengineering Institute.References
1. Zile MR, Baicu CF, Gaasch WH. Diastolic heart failure--abnormalities in active relaxation and passive stiffness of the left ventricle. The New England Journal of Medicine. 2004;350(19):1953–1959.
2. Sinkus R. Elasticity of the Heart, Problems and Potentials. Current Cardiovascular Imaging Reports. 2014;7(9):9288.
3. Connesson N, Clayton EH, Bayly P V., Pierron F. Extension of the optimised virtual fields method to estimate viscoelastic material parameters from 3D dynamic displacement fields. Strain. 2015;51(2):110–134.
4. Avril S, Grédiac M, Pierron F. Sensitivity of the virtual fields method to noisy data. Computational Mechanics. 2004;34(6):439–452.
5. Feng Y, Okamoto RJ, Namani R, Genin GM, Bayly P V. Measurements of mechanical anisotropy in brain tissue and implications for transversely isotropic material models of white matter. Journal of the Mechanical Behavior of Biomedical Materials. 2013;23:117–132.
6. Miller R, Kolipaka A, Nash MP, Young AA. Identification of Transversely Isotropic Properties from Magnetic Resonance Elastography Using the Optimised Virtual Fields Method. In: Functional Imaging and Modeling of the Heart. 2017. p. 421–431.
Figures