Yue Gao1, Zhigang Yang1, Xi Liu1, Linjun Xie2, Li Jiang1, Biyue Hu1, and Yingkun Guo1
1west china hospital, sichuan university, chengdu, China, 2West China Second University Hospital, chengdu, China
Synopsis
In order to clarify the relationship among diffuse
myocardial fibrosis and abnormal metabolic and duration and diabetes, we compared
the T1 mapping parameters on cardiac magnetic resonance (CMR). type 2 diabetes (T2DM)
patients and normal controls were enrolled and performed CMR both. Our results showed ECV were higher in T2DM than controls, and positively
associated with high level glycosylated hemoglobin and longer duration
diabetes. Diabetes myocardial fibrosis could be effectively detected by CMR T1
mapping. The trend of myocardial fibrosis in patients with hyperglycemia and
long-term duration is more obvious
INTRODUCTION Type 2 diabetes
mellitus(T2DM) as one of the most common chronic diseases globally, which is
related with high risk of mortality and incident heart failure1-3. The
potential pathomechanism of diabetic myocardial damage might results in diffuse
myocardial fibrosis. Fibrosis might be potential associated with abnormal
metabolic, especially hyperglycemia4. The Extracellular
volume fraction (ECV), native T1 and postcontrast T1 obtained by cardiac
magnetic resonance (CMR) T1-mapping techniques could noninvasively detect
myocardial fibrosis, and ECV have been as an effect biomarker for evaluate
diffuse myocardial fibrosis5-7. The purposes of this study were: (i)
the relationship between the T1 mapping parameters and T2DM in cardiac indicators
and hyperglycemia; (ii) the relationship among ECV in diabetic individuals and the
level of glycosylated hemoglobin (HbAlc) and duration of diabetes.
METHODS Sixty-Two T2DM patients
(45males, age 58.5±13.19 years) and 20 health controls (13 males, age
57.65±9.87
years) who underwent CMR were prospectively enrolled. Patients with
history of myocardial
infarction and other organic heart disease or had contraindication of
CMR were
excluded. The T1 mapping were performed for all of patients
and controls to obtain native T1 value, postcontrast T1 value and
calculated
ECV value. According to HbAlc, all the 62 T2DM patients were
classified in high HbAlc level group (HbA1c (%) ≥7.0; n=32)
and low HbAlc level group (HbA1c (%) <7.0; n=30); according to
duration of diabetes,
all patients divided into A group (<5 years, n=28) and
B group (≥5 years, n=34) .The independent-samples T test and Spearman
rank correlation
test were used for comparison and evaluated the relation. The Pearson
rank
correlation test was used foe evaluated the relationship between T1
mapping
parameters and metabolic characteristics.
RESULTS T2DM patients
had a higher value of ECV(35.21±5.03% vs. 29.33±2.7% ;p <0.001) than
controls with statistical significance, the
value of native T1(1296±67.09 ms vs. 1276.4±130.98 ms)
and postcontrast T1 (523.6±78.3 ms vs. 504.6±26.2 ms) were slightly
higher
than controls, but there was no statistical significance. Besides, the
myocardial mass at the end-diastole
stage (54.86±19.27 g/m2
vs. 37.90±10.94 g/m2)was heavier than the controls, the cardiac function
and ventricle
diameter were similar(Table.1).
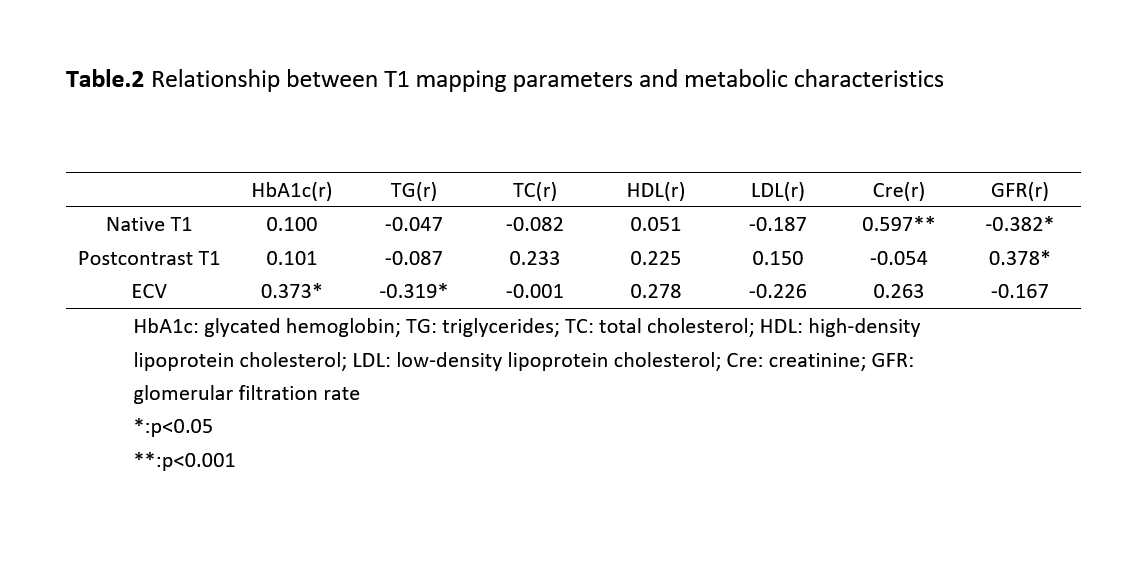
Pearson’s
correlation in Table.2 showed that ECV was positively associated with
the HbA1c
(R=0.373, p=0.021) and total cholesterol (TC) (R=-0.319, p=0.025).
what’s more,
the native T1 value was positively associated with Cre
(R=0.597, P<0.001) and negatively associated with eGFR (R=0.-382;
P=0.041), and
the postcontrast T1 value was positively associated with eGFR (R=0.378;
P=0.043).
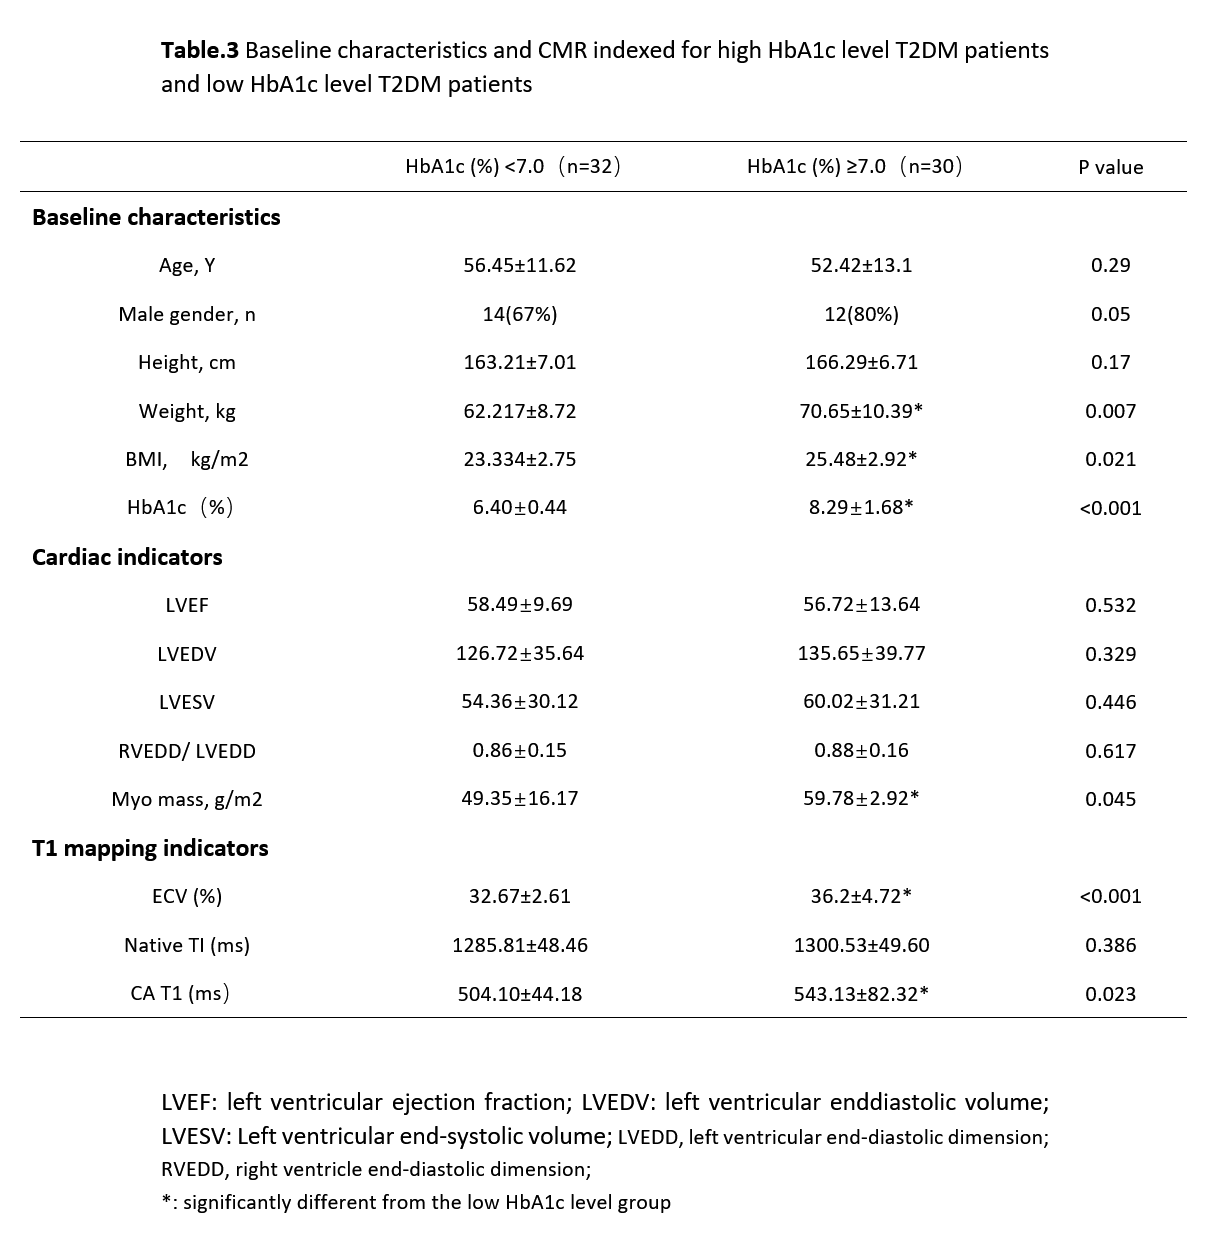
There was a
significant difference in ECV between different HbA1c level group (high
HbA1c vs.
low HbA1c, 36.2±4.72% vs. 32.67±2.61%, p<0.001), and the myocardial
mass
value was difference between these two group (high HbA1c vs. low HbA1c,
59.78±2.92 g/m2 vs. 49.35±16.17 g/m2, p=0.045). While the native T1
value, postcontrast T1 value and the
cardiac indicators had no differences between these two group(Table.3).
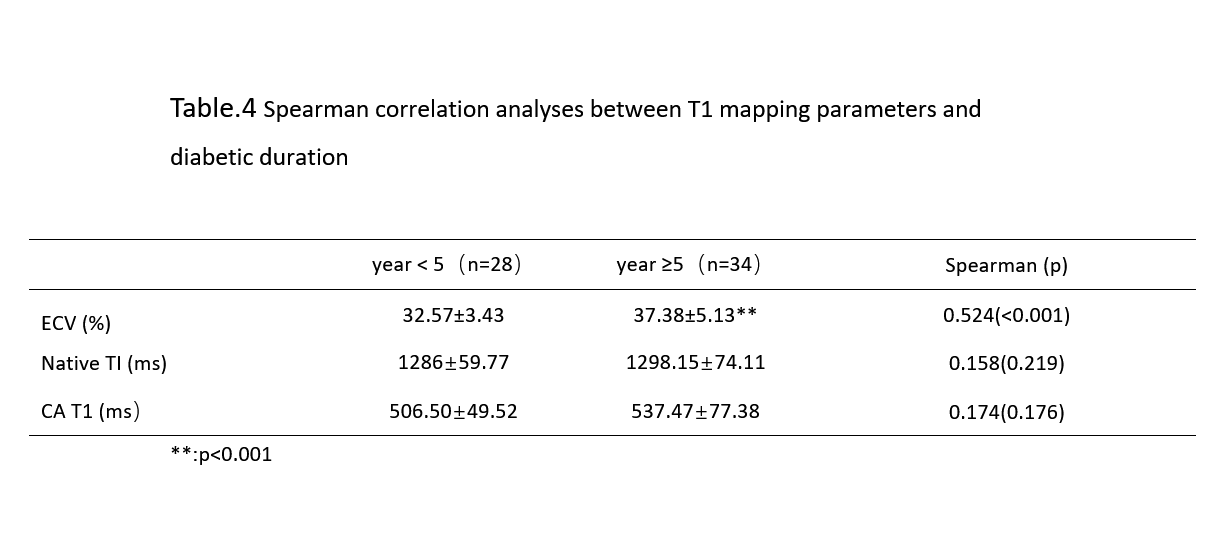
Between the group
A (<5 years) and group B (≥5 years), the ECV value had
a statistically significant difference (A vs. B, 32.57±3.43 vs.
37.38±5.13,
P<0.001) and the spearman correlation result showed that ECV was
positively
associated with the duration of diabetes (R=0.524,p<0.001) (Table.4).
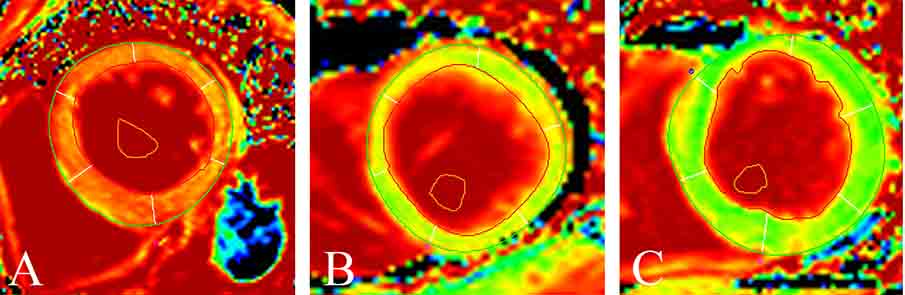
DISCUSSION The high T1
mapping parameters value especially ECV and the heavier myocardia mass
indicating
the presence of myocardial fibrosis in T2DM, even early stage. The
higher level
HbA1c and longer duration diabetes might aggravation
the diffuse myocardial fibrosis. Although HbA1c was a time-averaged
glucose
index, short and high glucose level might also cause myocardial damage.
HbA1c and ECV and other T1 mapping parameters
could detect the early fibrosis by quantity the myocardial extracellular
matrix
expansion.
CONCLUSION Diabetes is related to increased ECV, and ECV was correlated well with
HbA1c
level and duration diabetes. The trend of myocardial fibrosis in
patients with hyperglycemia
and long-term duration is more obvious. CMR T1 mapping might be a
powerful
technique for early diagnosis and intervention for cardiomyopathy.Acknowledgements
This work was supported by the National
Natural Science Foundation of China (81471721, 81471722, 81641169, 81771887 and
81771897), Program for New Century Excellent Talents in University (no:
NCET-13-0386), and Program for Young Scholars and Innovative Research Team in
Sichuan Province (2017TD0005) of China.References
1. Kannel WB, Hjortland M, Castelli WP. Role
of diabetes in congestive heart failure: the Framingham study. Am J Cardiol
1974; 34:29–34.
2. J. M. Pappachan, G. I. Varughese, R.
Sriraman, et al. Diabetic cardiomyopathy: pathophysiology,
diagnostic evaluation and management. World Journal of Diabetes. 2013;
4(5):177-189.
3. Shivu, G. N. Relationship
between coronary microvascular dysfunction and cardiac energetics impairment in
type 1 diabetes mellitus. Circulation. 2010; 121(10):1209.
4. Robins, S. P. Biochemistry
and functional significance of collagen cross-linking. Biochem Soc Trans.
2007; 35(5):849-52.
5. SibleyCT, Noureldin RA, Gai N, et al. T1
Mapping in cardiomyopathy at cardiac MR: comparison with endomyocardial biopsy.
Radiology 2012;265: 724–32.
6. Miller CA, Naish JH, Bishop P, et al. Comprehensive
validation of cardiovascular magnetic resonance techniques for the assessment
of myocardial extracellular volume. Circ Cardiovasc Imaging 2013; 6:373–83.
7. P. Kellman, J. R. Wilson, H. Xue et al. Extracellular
volume fraction mapping in the myocardium, part 2: initial clinical experience.
Journal of Cardiovascular Magnetic Resonance,.2012; 14(1):1-8.