3010
Impact of empagliflozin on cardiac energy status and function in diabetic db/db mice1Biomedical Engineering, Eindhoven University of Technology, Eindhoven, Netherlands, 2Cardiometabolic Diseases Research, Boehringer Ingelheim, Biberach, Germany, 3Radiology, University Medical Center Utrecht, Utrecht, Netherlands
Synopsis
Diabetes is associated with impaired cardiac energetics and diastolic dysfunction. A substrate shift toward ketones has been proposed to explain the benefits of empagliflozin on cardiovascular outcome in diabetes patients. We investigated the effects of empagliflozin on cardiac energetics and function in diabetic db/db mice using 31P-MRS and MRI. After a single dose of empagliflozin, cardiac PCr/ATP ratio was higher compared with placebo-treated controls, which was associated with increased plasma ketone levels and lower cardiac load. After 6 weeks of treatment, cardiac diastolic function tended to be improved, while plasma ketones and cardiac PCr/ATP ratio were not different from placebo.
Introduction
Diabetes is associated with impaired cardiac energetics and diastolic dysfunction.1,2 In the EMPA-REG OUTCOME trial, the sodium glucose cotransporter 2 inhibitor empagliflozin showed impressive benefits on cardiovascular mortality and hospitalization for heart failure in type 2 diabetes patients.3 A shift in myocardial fuel metabolism toward utilization of ketones, a more energy-efficient fuel, has been proposed to explain the benefits of empagliflozin on cardiovascular outcome.4 Our aim was to investigate the effects of empagliflozin on in vivo cardiac energy status and function in diabetic db/db mice using 31P MRS and MRI, respectively.Methods
Male diabetic db/db mice were randomized into a placebo group (N=10; placebo) or an empagliflozin group (N=11; EMPA) to study the effects of acute (single dose) and chronic (6 weeks) treatment. On day 1, animals were fasted for 4 hours after which they received a single dose of empagliflozin (30 mg/kg body weight) in 0.5% Natrosol (EMPA) or 0.5% Natrosol (placebo) at 10 ml/kg body weight by oral gavage. After another 2 hours of fasting, plasma glucose and ketone levels were measured. Thereafter, cine MRI and 31P MRS were performed. For the EMPA group, treatment was continued for another 6 weeks by mixing empagliflozin into the chow (resulting in an average dose of 45 ± 6 mg per kg body weight per day). After 6 weeks of treatment, 31P MRS (fasted) and cine MRI (fed) measurements were repeated.
Cardiac systolic function was assessed from cine movies of the beating heart (15-18 frames/cardiac cycle) acquired using prospectively cardiac-triggered gradient echo imaging of 5-6 contiguous left-ventricular short-axis and 2 long-axis slices (slice thickness: 1 mm). Imaging parameters: repetition time: 7ms, echo time: 1.8ms, flip angle: 15⁰, matrix: 192x192, field of view: 30x30mm2, NA: 6. For diastolic function (after 6 weeks of treatment), cardiac movies of only the mid-ventricular slice were acquired using retrospectively triggered gradient echo imaging with Gaussian weighted sampling for phase encoding.5,6 Imaging parameters: repetition time: 4.7ms, echo time: 2.3ms, flip angle 15⁰, matrix: 128x128, field of view: 30x30mm2, NA: 250. Data was reconstructed using compressed sensing, resulting in cine movies with an effective temporal resolution of 60 frames/cardiac cycle. Image segmentation was performed using Segment v2.0 R5585.7
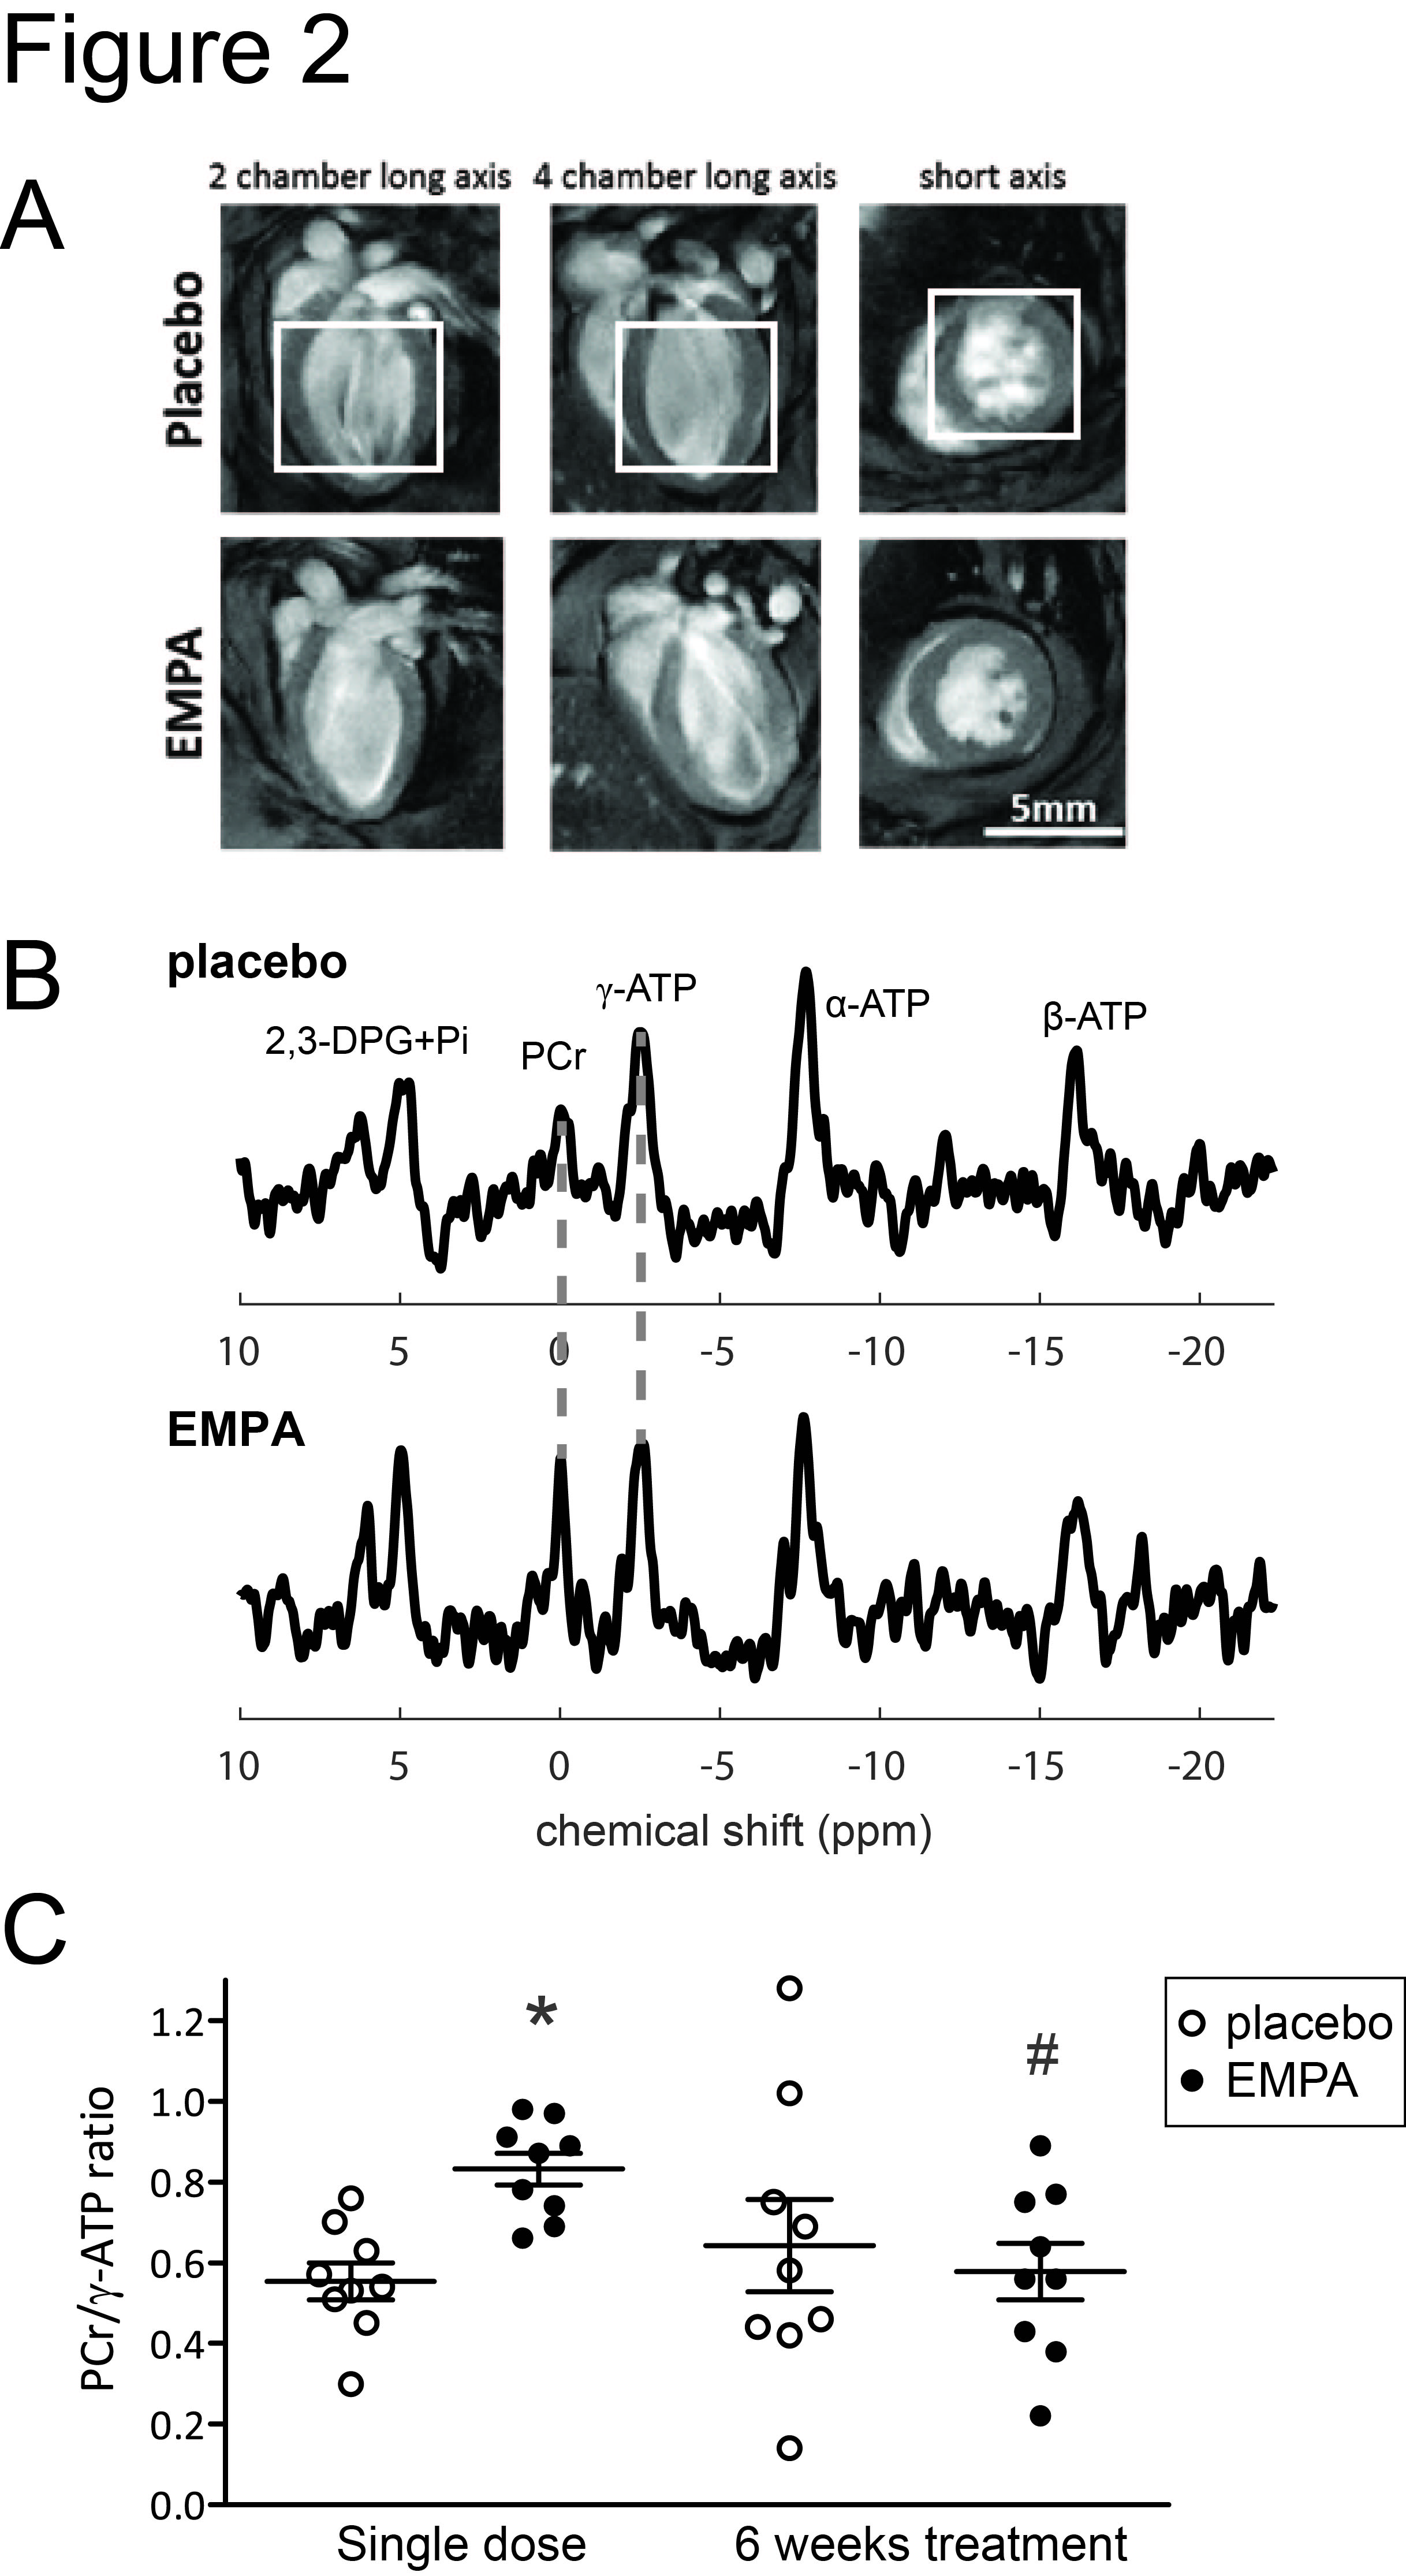
31P MRS was performed using image selected in vivo spectroscopy (ISIS) in a voxel of typically ~5x5x5mm3 covering the left ventricle at the end-diastolic phase.8 Parameters: repetition time: 2s, 1.2ms 90⁰ sinc-shaped excitation pulse (bandwidth: 32.0ppm), 6.26ms 180⁰ adiabatic hyperbolic secant inversion pulses (bandwidth: 37.5ppm), 96 ISIS cycles, y-ATP on resonance. Data fitting was performed using AMARES9 in jMRUI.10 The ratio of PCr to y-ATP was used as a measure of cardiac energy status.
Data are expressed as means±SEM. Statistical significance of treatment (placebo and EMPA) and time (single dose and 6 weeks treatment) effects were assessed by two-way repeated measures ANOVA in SPSS v21.0 (SPSS Inc., Chicago, IL, USA) with Bonferroni-corrected posthoc tests.
Results
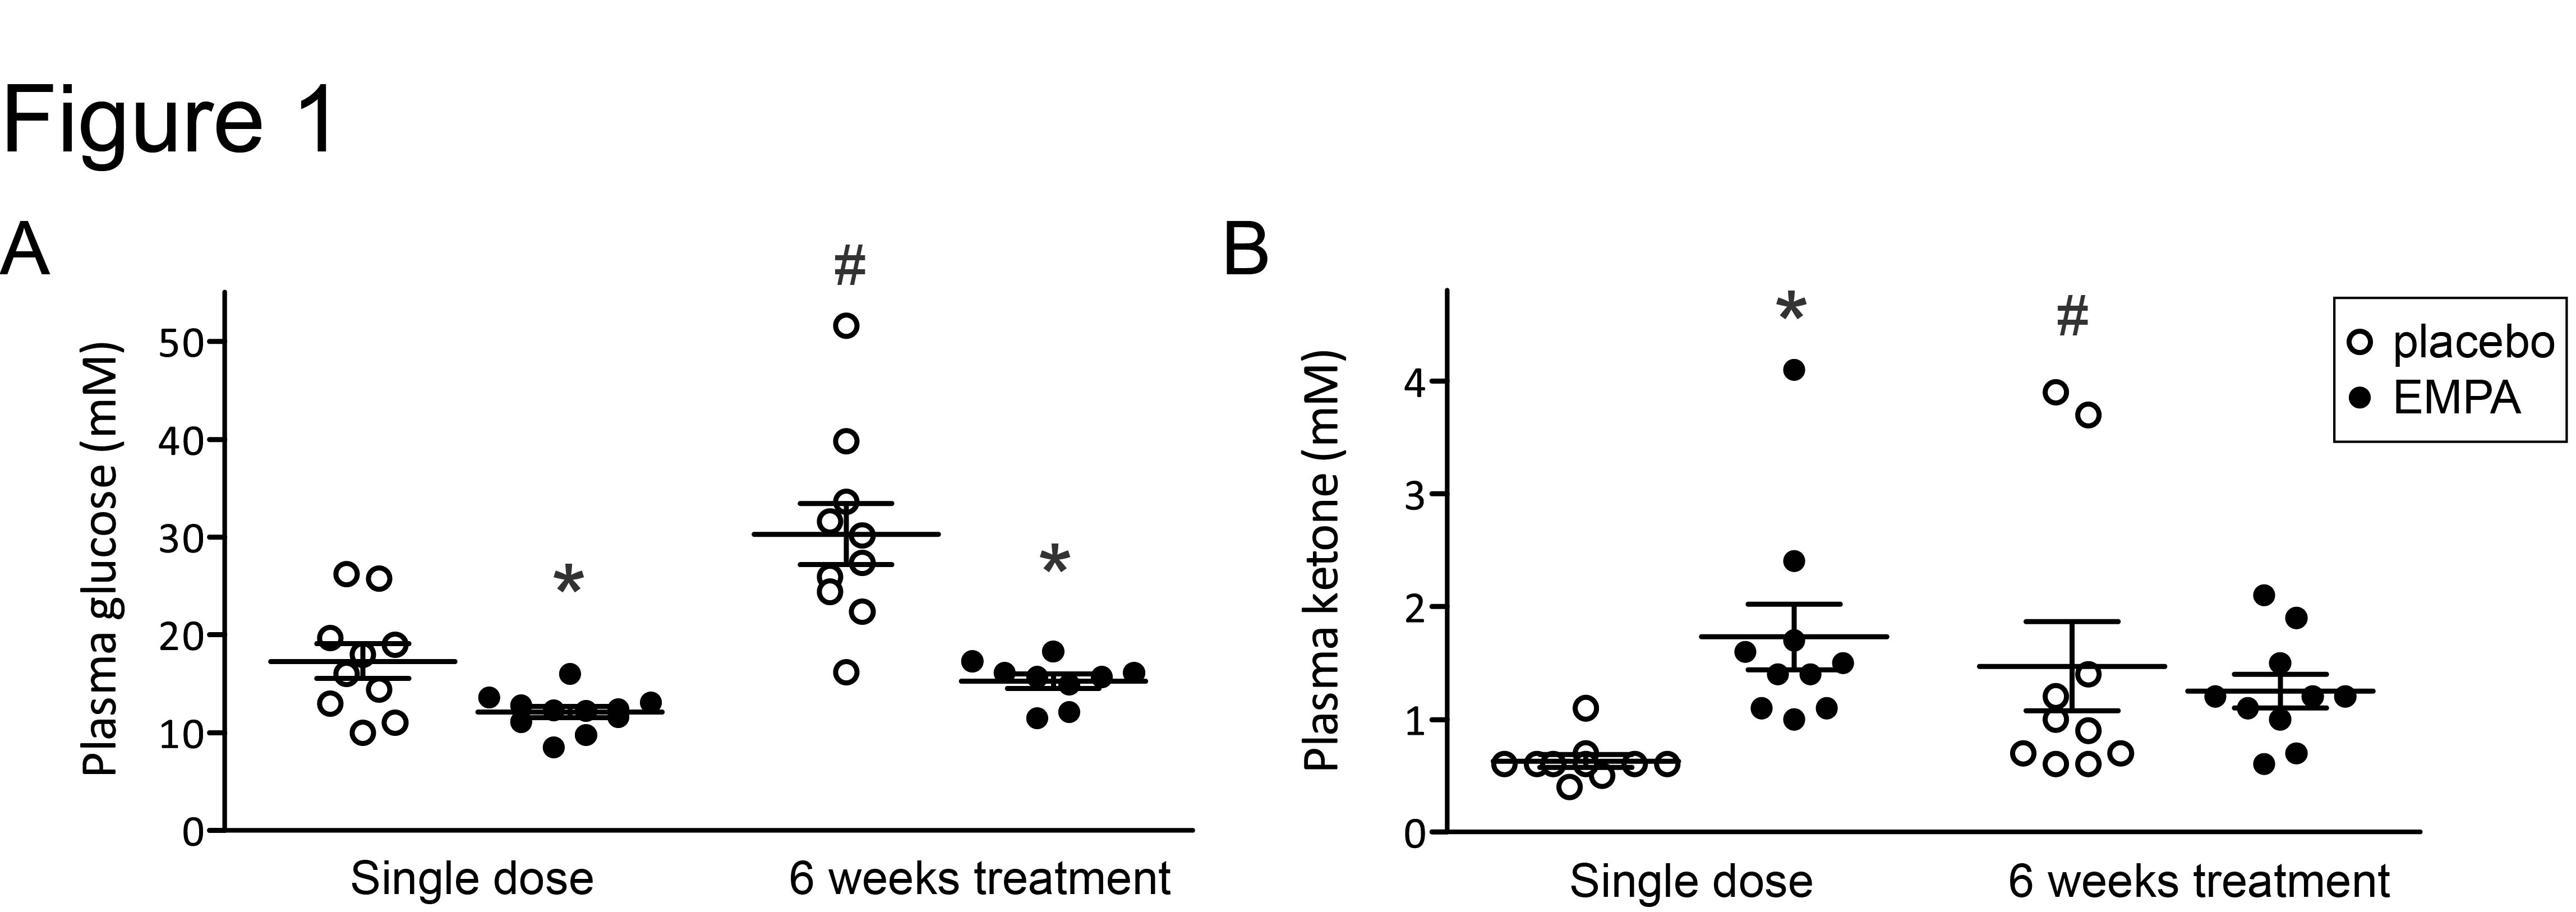
Plasma glucose levels were lower in EMPA compared with placebo, both after a single dose of empagliflozin and after 6 weeks of treatment (Figure 1A). After a single dose, plasma ketone levels were higher in EMPA compared with placebo, but after 6 weeks ketone levels were not different between groups (Figure 1B).
After a single dose of empagliflozin, the cardiac PCr/ATP ratio was 44% higher in EMPA than in placebo (Figure 2). However, after 6 weeks of treatment, the PCr/ATP ratio in EMPA was no longer different from placebo.
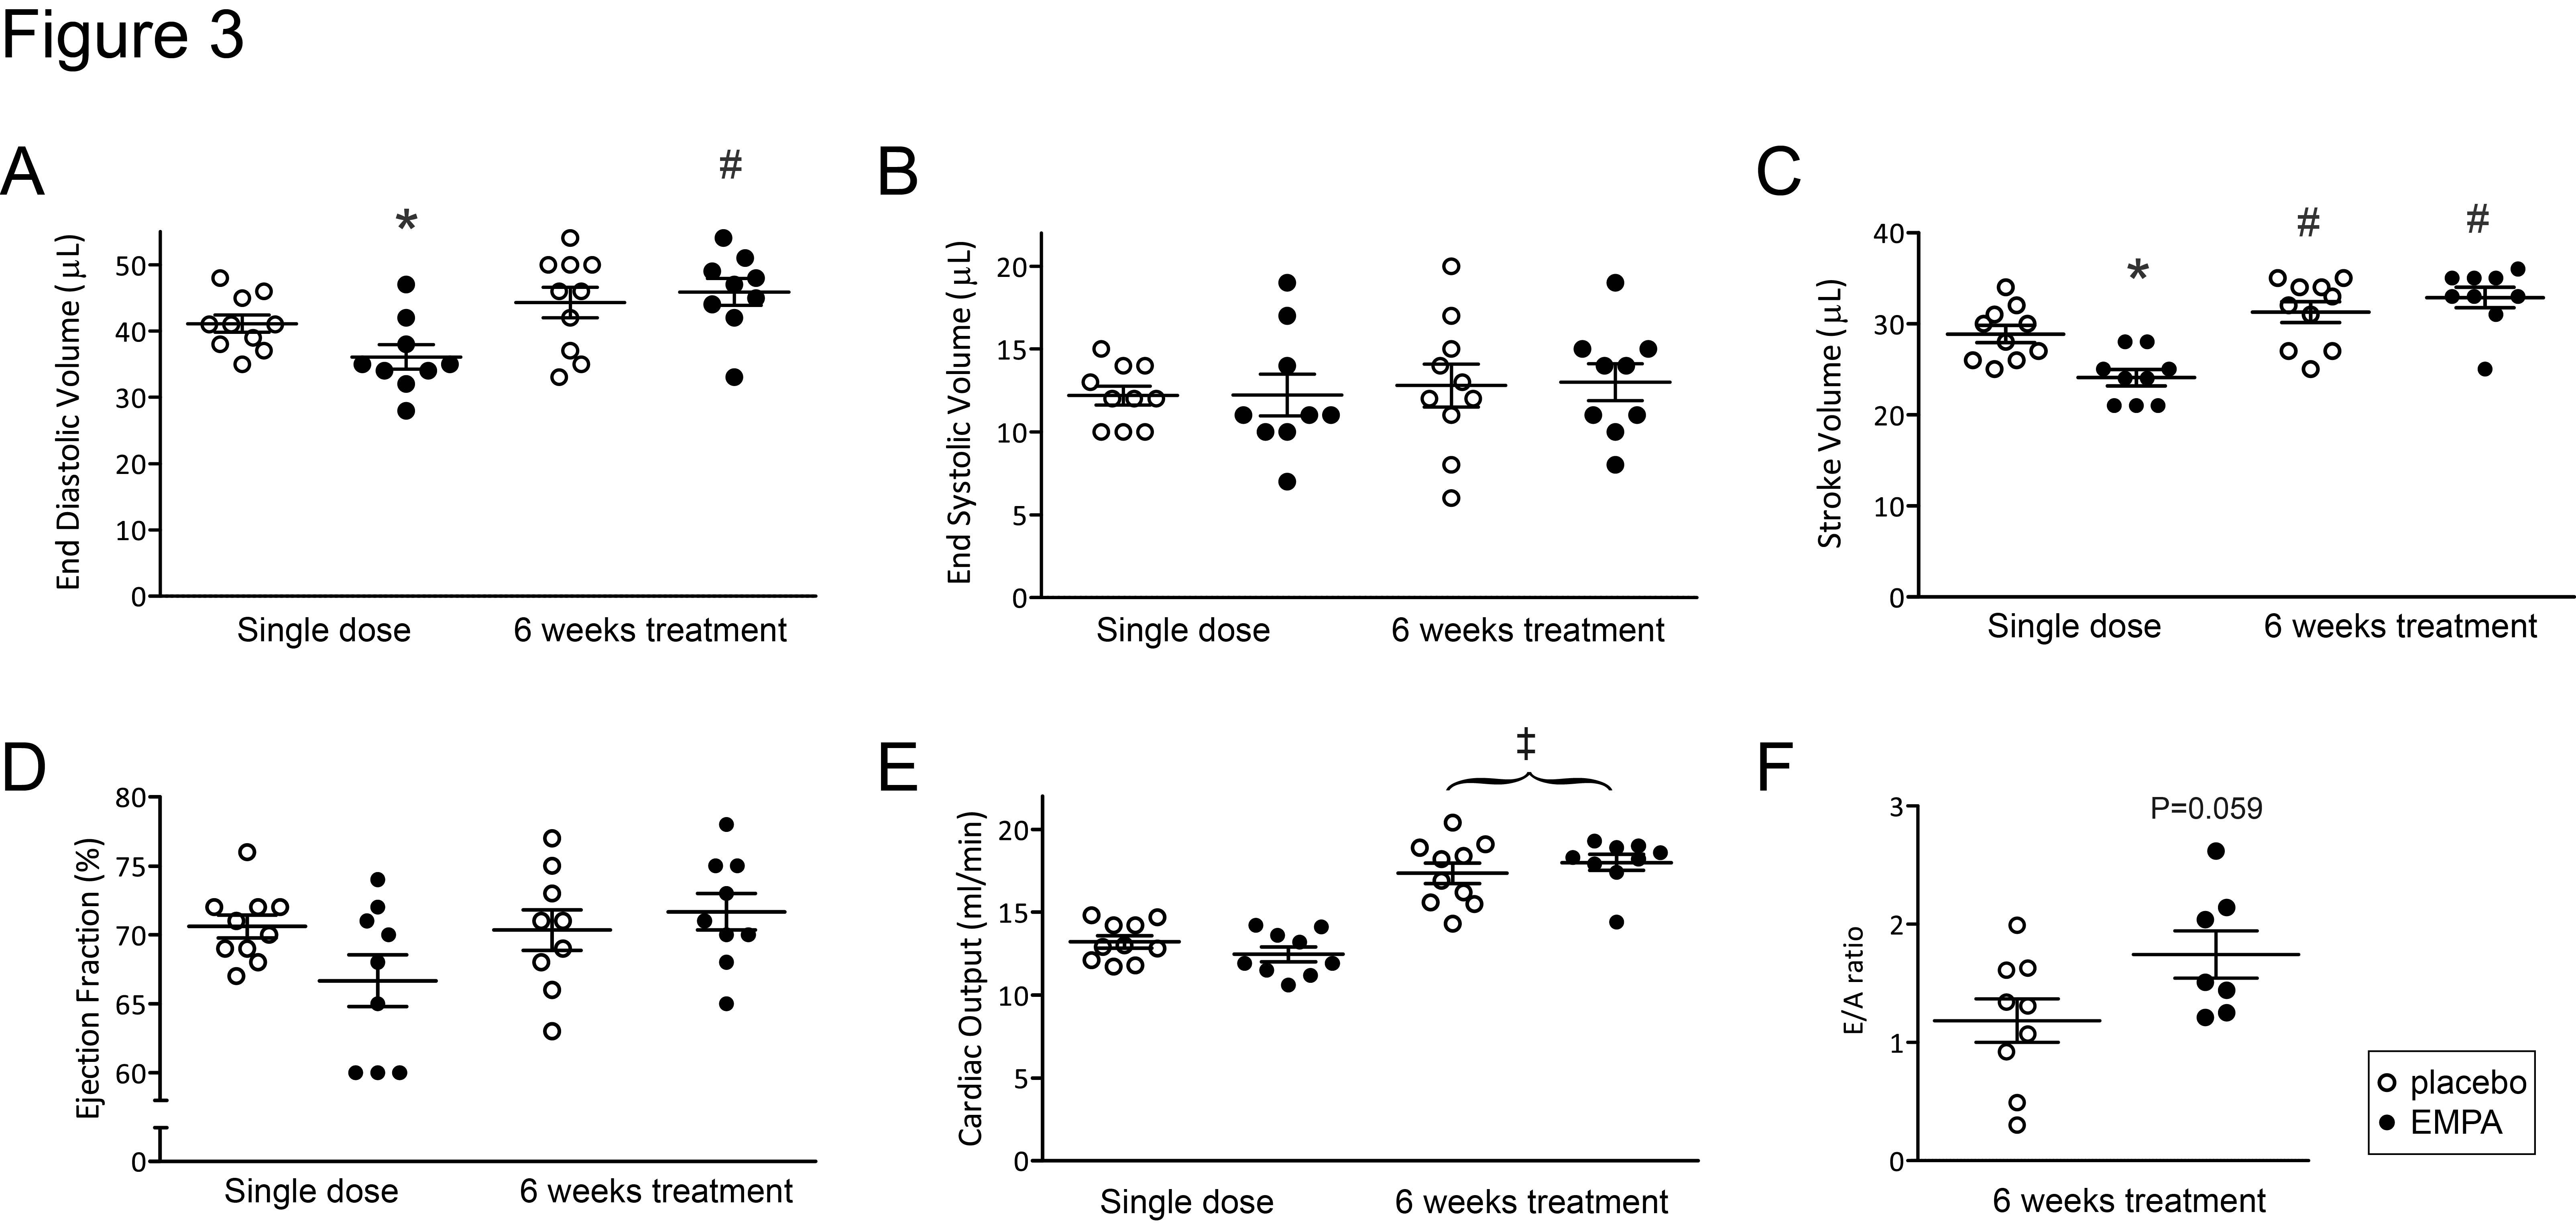
End-diastolic volume (EDV) and stroke volume (SV) were lower compared with placebo after a single dose of empagliflozin, but these differences disappeared after 6 weeks of treatment (Figure 3). Ejection fraction and cardiac output were not significantly different between groups. After 6 weeks of treatment, the ratio of early to late peak filling rates (E/A ratio) tended to be higher in EMPA compared with placebo (Figure 3).
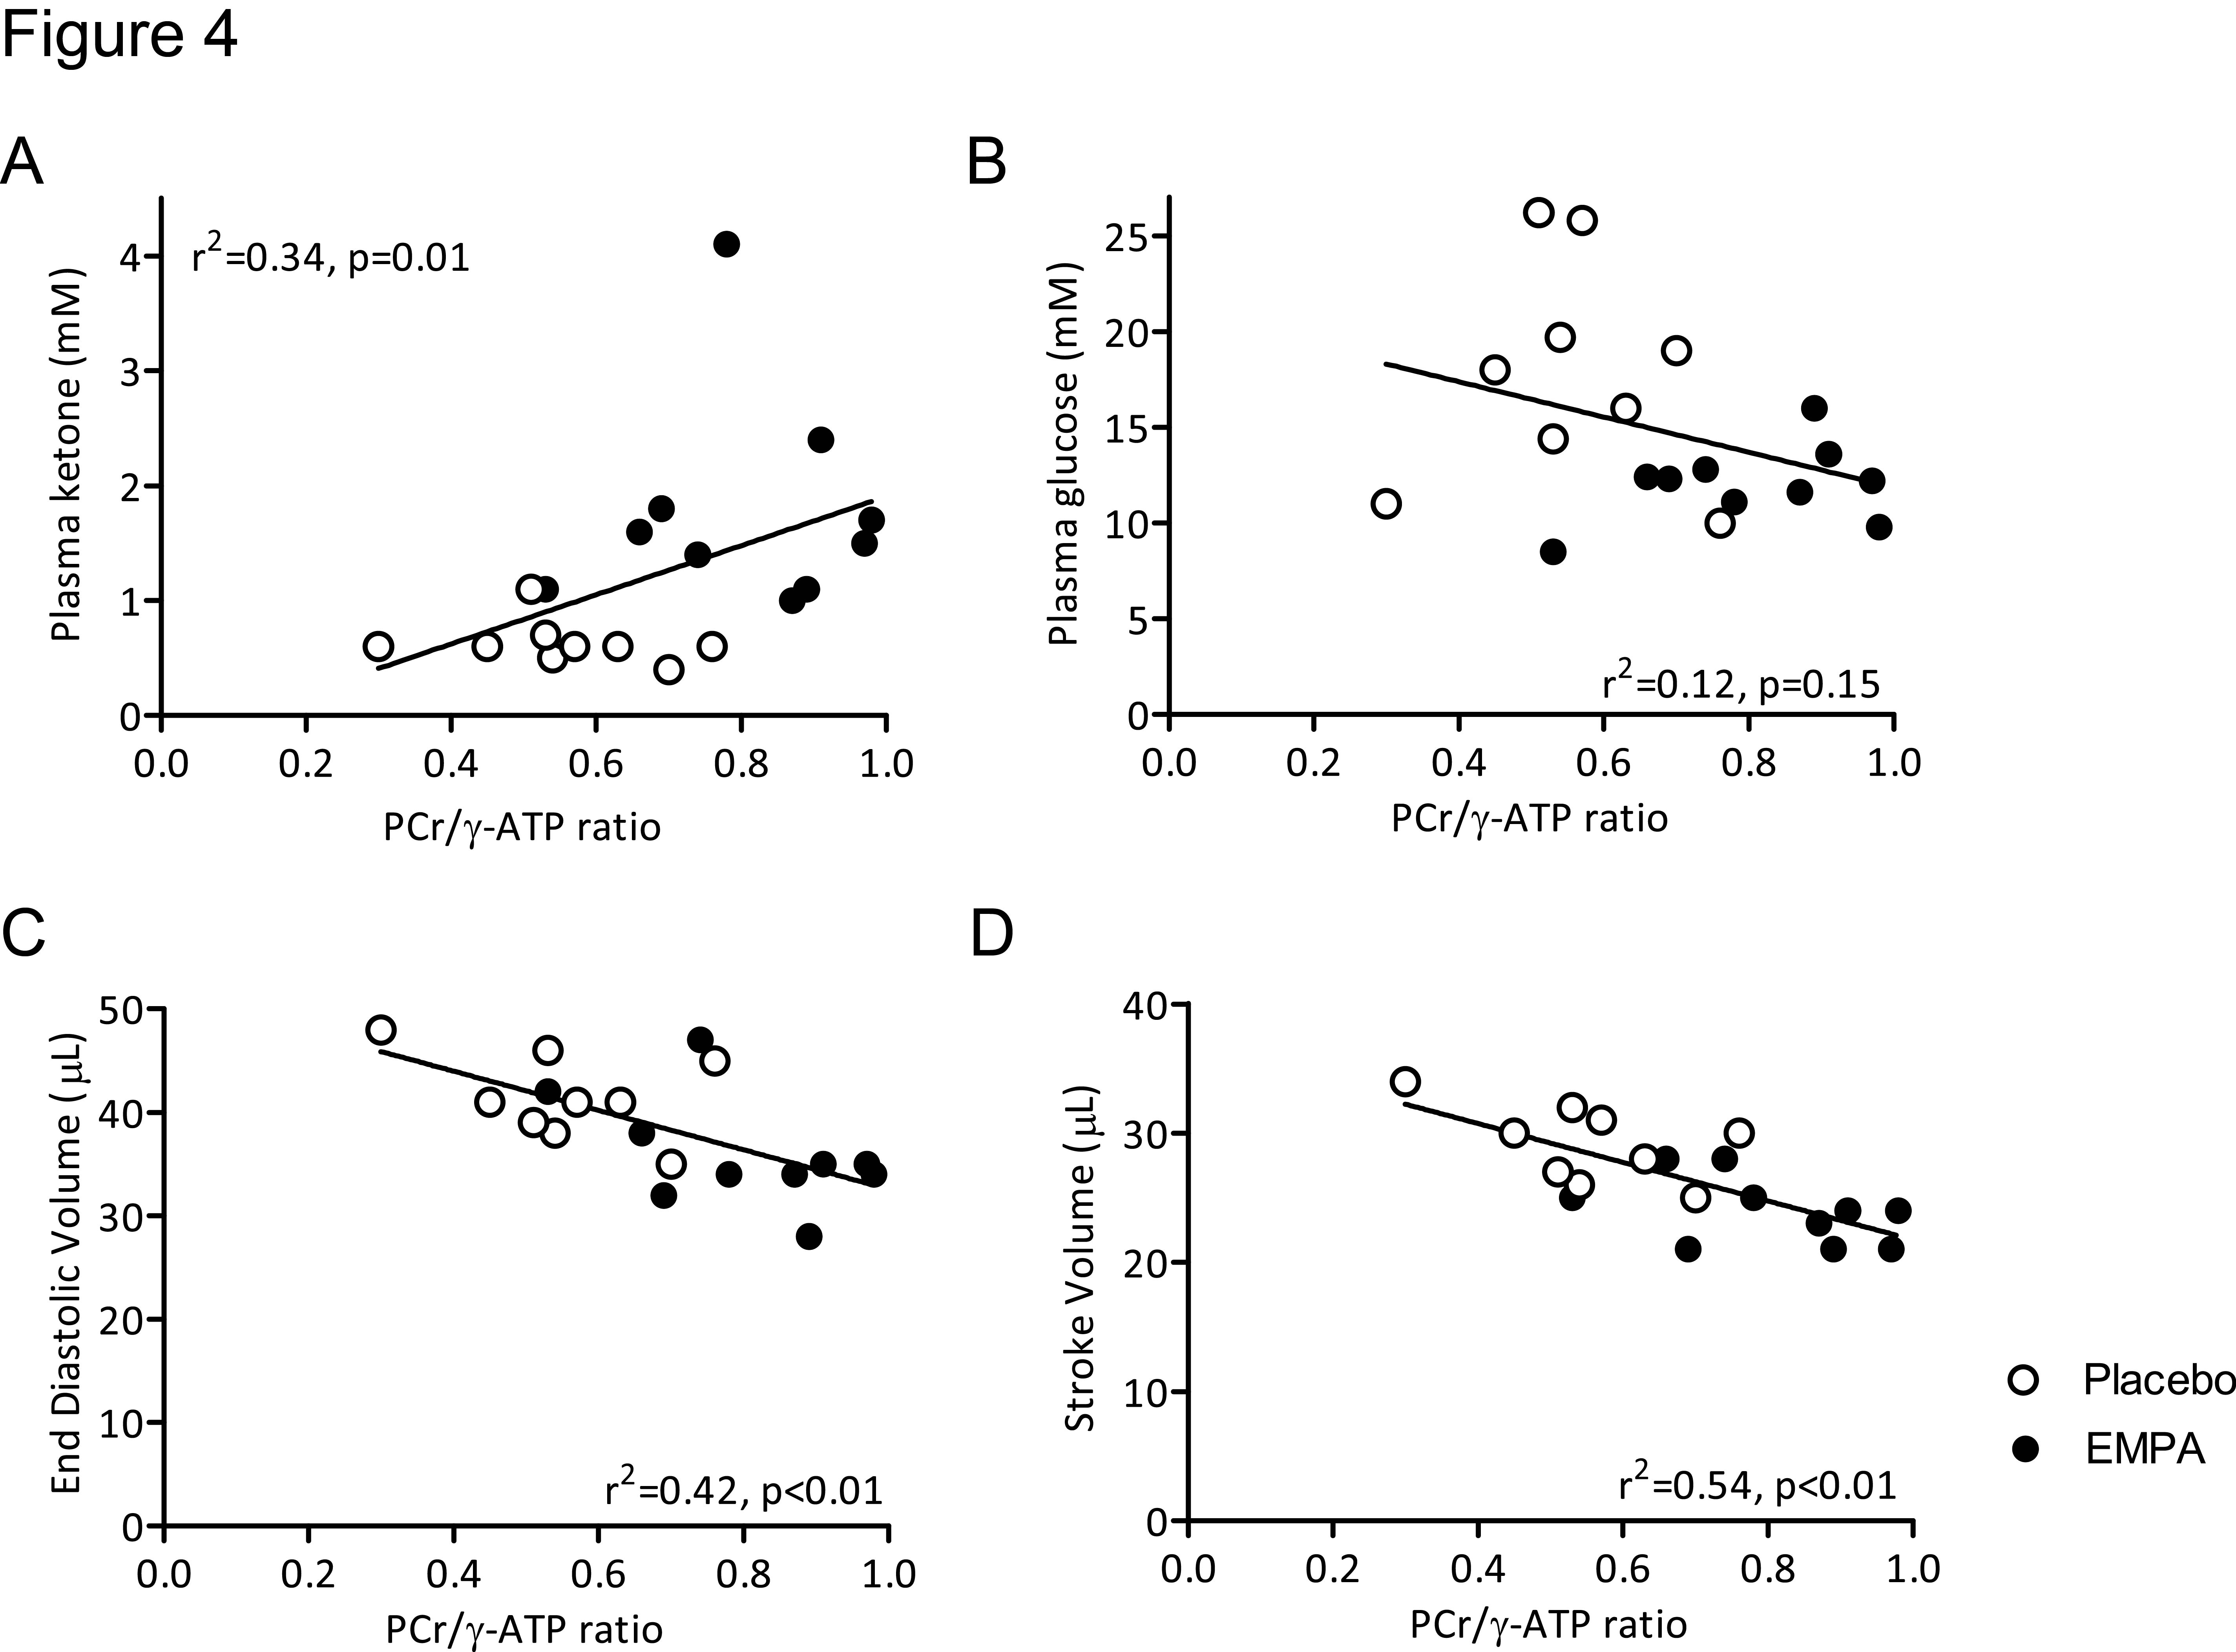
The cardiac PCr/ATP ratio after a single dose of empagliflozin or placebo was significantly correlated with plasma ketone levels, EDV and SV, but not with plasma glucose (Figure 4).
Disussion
Empagliflozin acutely improved cardiac energy status in a mouse model of diabetes, which was correlated with higher plasma ketone levels and reduced end-diastolic and stroke volumes, indicating possible roles for empagliflozin in modulating cardiac fuel use4 and/or cardiac pre- and after-load. However, while cardiac diastolic function tended to be improved after 6 weeks of treatment with empagliflozin, cardiac PCr/ATP ratio, end-diastolic and stroke volumes, and plasma ketone levels were similar to placebo. Further investigations seem necessary to understand the putative role of ketones in the beneficial effect of empagliflozin on cardiovascular outcome.Acknowledgements
No acknowledgement found.References
1. Diamant M, Lamb HJ, Groeneveld Y, Endert EL, Smit JW, Bax JJ, Romijn JA, de Roos A, Radder JK. Diastolic dysfunction is associated with altered myocardial metabolism in asymptomatic normotensive patients with well-controlled type 2 diabetes mellitus. J Am Coll Cardiol. 2003;42:328-335
2. Scheuermann-Freestone M, Madsen PL, Manners D, Blamire AM, Buckingham RE, Styles P, Radda GK, Neubauer S, Clarke K. Abnormal cardiac and skeletal muscle energy metabolism in patients with type 2 diabetes. Circulation. 2003;107:3040-3046
3. Zinman B, Wanner C, Lachin JM, Fitchett D, Bluhmki E, Hantel S, Mattheus M, Devins T, Johansen OE, Woerle HJ, Broedl UC, Inzucchi SE. Empagliflozin, cardiovascular outcomes, and mortality in type 2 diabetes. New England Journal of Medicine. 2015;373:2117-2128
4. Ferrannini E, Mark M, Mayoux E. CV protection in the EMPA-REG OUTCOME trial: A "thrifty substrate" hypothesis. Diabetes Care. 2016;39:1108-1114
5. Coolen BF, Abdurrachim D, Motaal AG, Nicolay K, Prompers JJ, Strijkers GJ. High frame rate retrospectively triggered Cine MRI for assessment of murine diastolic function. Magnetic Resonance in Medicine. 2013;69:648-656
6. Motaal AG, Coolen BF, Abdurrachim D, Castro RM, Prompers JJ, Florack LM, Nicolay K, Strijkers GJ. Accelerated high-frame-rate mouse heart cine-MRI using compressed sensing reconstruction. NMR Biomed. 2013;26:451-457
7. Tufvesson J, Hedstrom E, Steding-Ehrenborg K, Carlsson M, Arheden H, Heiberg E. Validation and development of a new automatic algorithm for time-resolved segmentation of the left ventricle in magnetic resonance imaging. Biomed Res Int. 2015;2015:970357
8. Bakermans AJ, Abdurrachim D, van Nierop BJ, Koeman A, van der Kroon I, Baartscheer A, Schumacher CA, Strijkers GJ, Houten SM, Zuurbier CJ, Nicolay K, Prompers JJ. In vivo mouse myocardial 31P MRS using three-dimensional image-selected in vivo spectroscopy (3D ISIS): technical considerations and biochemical validations. NMR Biomed. 2015;28:1218-1227
9. Vanhamme L, van den Boogaart A, Van Huffel S. Improved method for accurate and efficient quantification of MRS data with use of prior knowledge. J Magn Reson. 1997;129:35-43
10. Stefan D, Di Cesare F, Andrasescu A, Popa E, Lazariev A, Vescovo E, Strbak O, Williams S, Starcuk Z, Cabanas M, van Ormondt D, Graveron-Demilly D. Quantitation of magnetic resonance spectroscopy signals: the jMRUI software package. Measurement Science and Technology. 2009;20
Figures