3009
Differentiation of blood clot hematocrit and age in vitro using R2* and quantitative susceptibility mapping at 3T1Imaging Research Laboratories, Robarts Research Institute, Western University, London, ON, Canada, London, ON, Canada, 2Dept. of Medical Biophysics, Schulich School of Medicine & Dentistry, Western University, London, ON, Canada, London, ON, Canada, 3Dept. of Biochemistry, Schulich School of Medicine & Dentistry, Western University, London, ON, Canada, London, ON, Canada
Synopsis
Thrombus composition and age in ischemic occlusion can significantly influence treatment efficacy, yet current MR characterization methods are qualitative and cannot distinguish between the effects of red blood cell age and concentration (hematocrit). We examined the ability of R2* and quantitative susceptibility (QS) maps derived simultaneously from multi-echo GRE acquisition to discriminate between blood clots of varied hematocrit formed in vitro and monitored over a six-day ageing period. Fresh clots (age < 6 hours) of different hematocrit were distinguishable using either R2* or QS values, while aged clots were distinguishable only when both values were considered.
Introduction
Knowledge of thrombus composition and age may provide valuable information towards the treatment of common ischemic conditions including stroke, heart attack and pulmonary embolism, such as predicting the efficacy of thrombolytic agents1 and mechanical thrombectomy procedures,2 and possibly determining thrombus etiology.3 Current MR-based thrombus characterization methods rely on a “susceptibility vessel sign” obtained from late-echo GRE, a qualitative metric sensitive to deoxygenated red blood cells (RBCs), but unable to distinguish between the effects of RBC concentration (hematocrit) and deoxygenation (associated with thrombus ageing).4 Quantitative methods that can distinguish between these effects are required for more accurate thrombus characterization. This work evaluates the ability of R2* (=1/T2*) and quantitative susceptibility (QS) maps, derived simultaneously from multi-echo GRE, to distinguish between clots of varied hematocrit and age in vitro.
Methods
Phantom- Arterial porcine blood anticoagulated with sodium citrate was used to create duplicate 5 mL blood samples of 10, 20, 30, 40, 50 and 60% hematocrit. Samples were clotted using calcium chloride and thromboplastin inside 1-cm diameter polystyrene tubes. Tubes were inserted into an agar-filled container and kept at 37°C except while scanning. The phantom was scanned without repositioning every 15 minutes up to 6 hours post clotting, and then intermittently at time points of 22 and 26 hours and 2, 3 and 6 days.
Imaging- Scans were performed at 3T with a 32-channel receive head-coil using a custom dual echo-train 3D GRE sequence (TE1/∆TE/TE5 = 3.20/1.46/9.04 ms, TE6/∆TE′/TE10 = 16.75/7.15/45.35 ms, TR: 47.6 ms, resolution: 0.94x0.94x1 mm3, matrix: 192x192x40, BW: 142.86 kHz, flip angle: 10°, scan time = 6 min 10 sec). The dual echo-train design enables the acquisition of both in- and out-of-phase images for water-fat separation (not discussed here) and T2* decay sensitivity for QS and R2* mapping.5
Image post-processing- Channel-combined complex data were processed using the non-iterative B0-NICE algorithm6 to calculate R2* maps and the MEDI QS algorithm7 to calculate QS maps.
Data analysis- Segmentation of clot samples was performed in Matlab. A circular ROI was drawn across each tube at the central coronal slice and used to calculate mean clot R2* and QS values.
Results
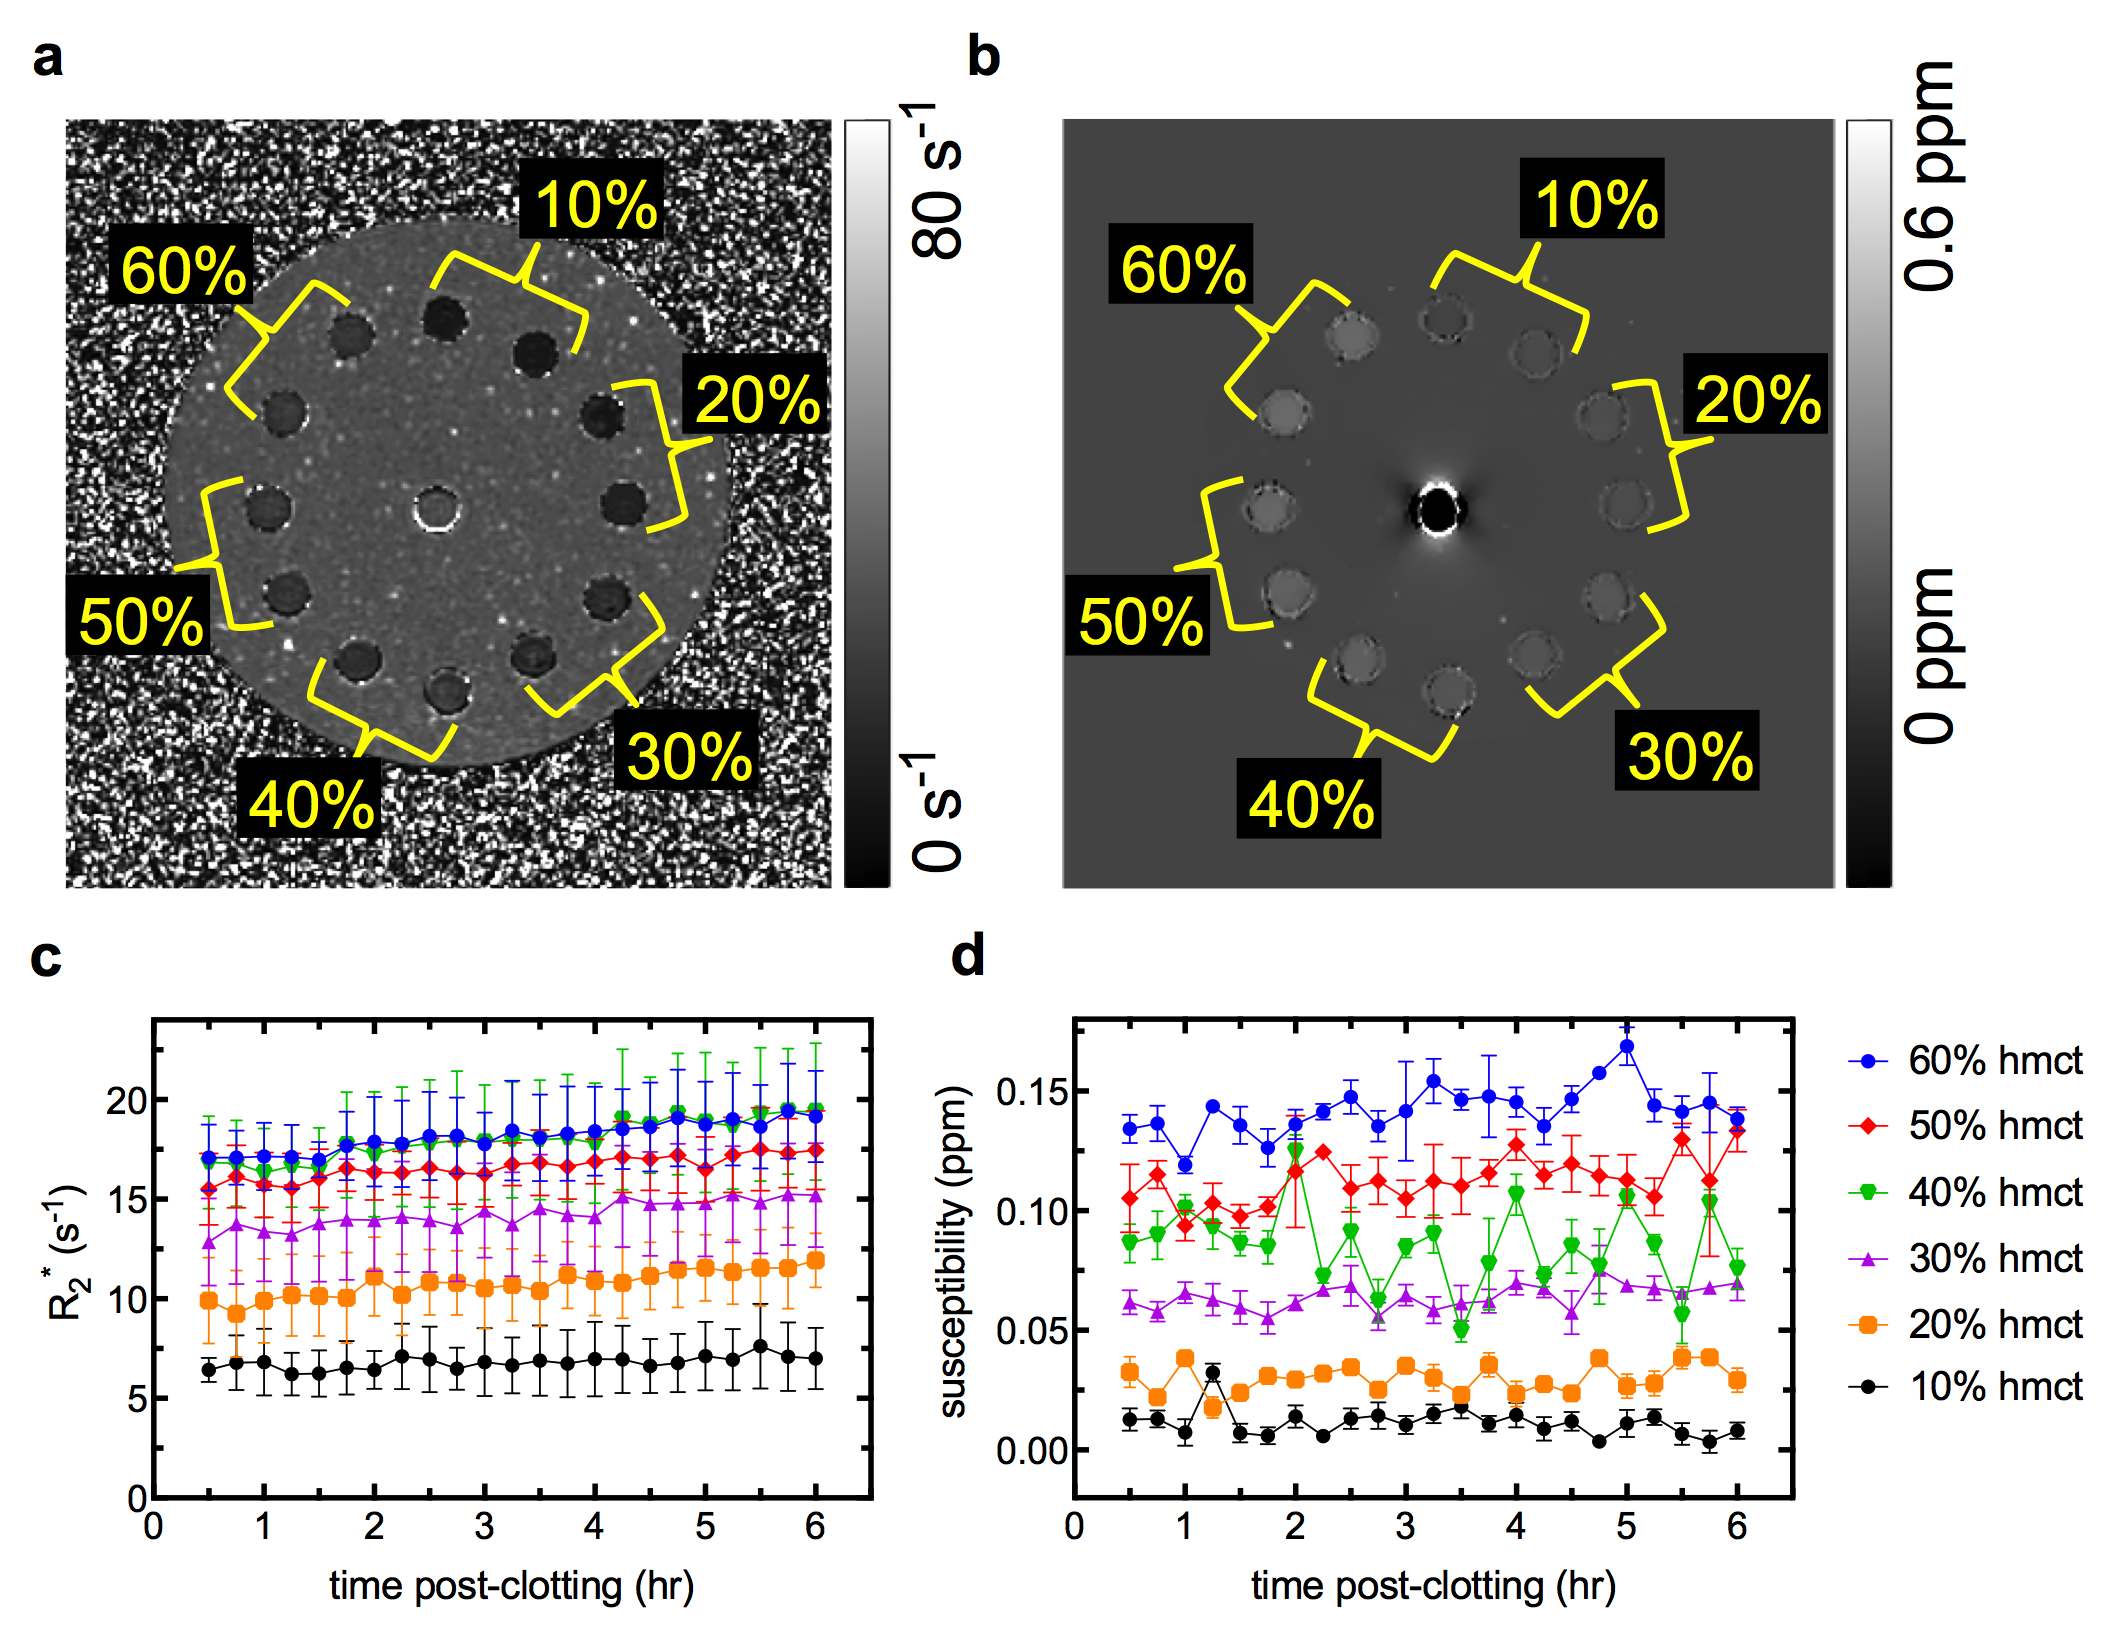
Representative slices from the R2* and QS maps of the phantom at the 6 hour time point are shown in Figures 1a, b. R2* values increased at a slow (< 0.5 s-1hr-1) but constant rate over the 6 hour period (Fig. 1c). Measured R2* values were proportional to hematocrit but plateaued at high hematocrit (≥ 40%). QS values for all clots remained constant throughout the 6-hr period, and were linearly proportional to clot hematocrit (Fig. 1d).
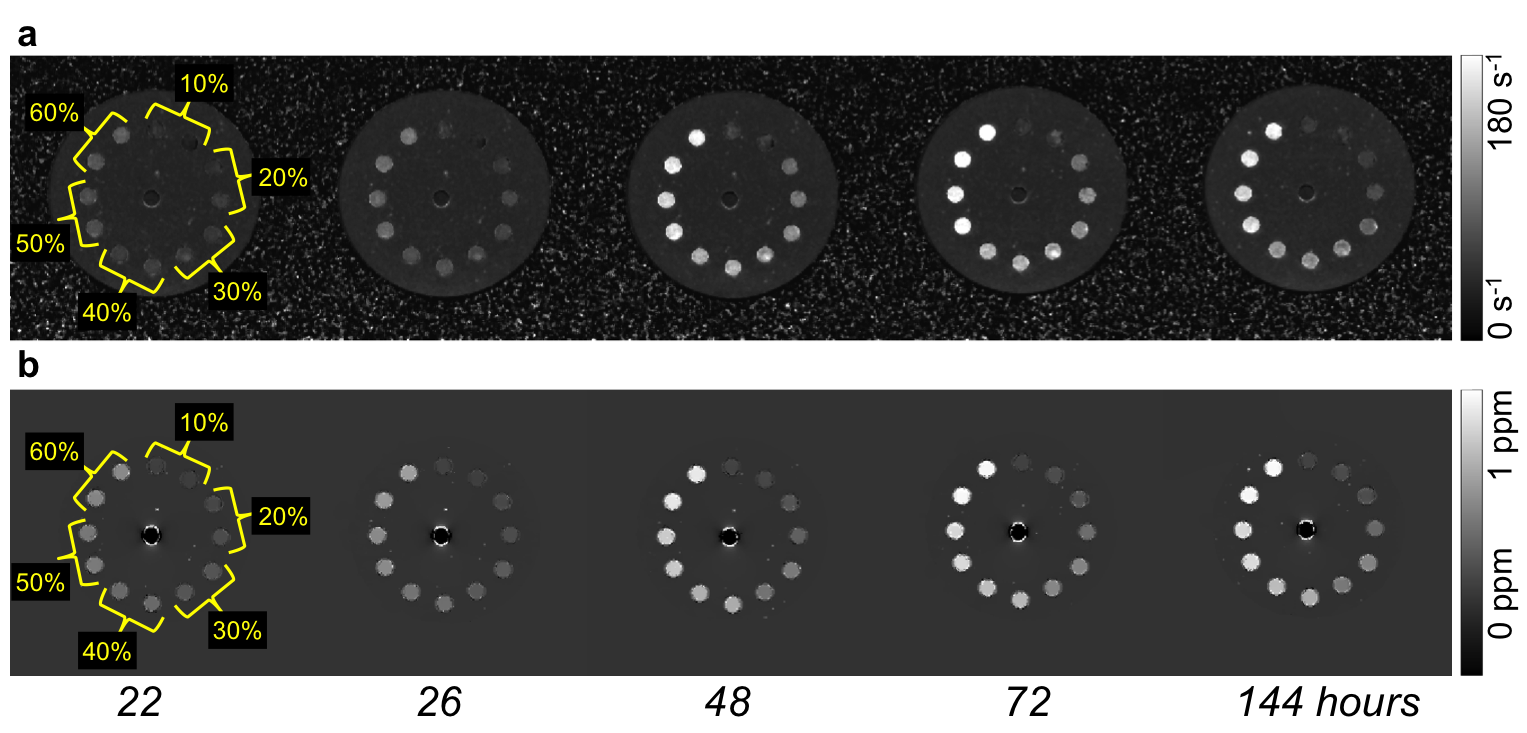
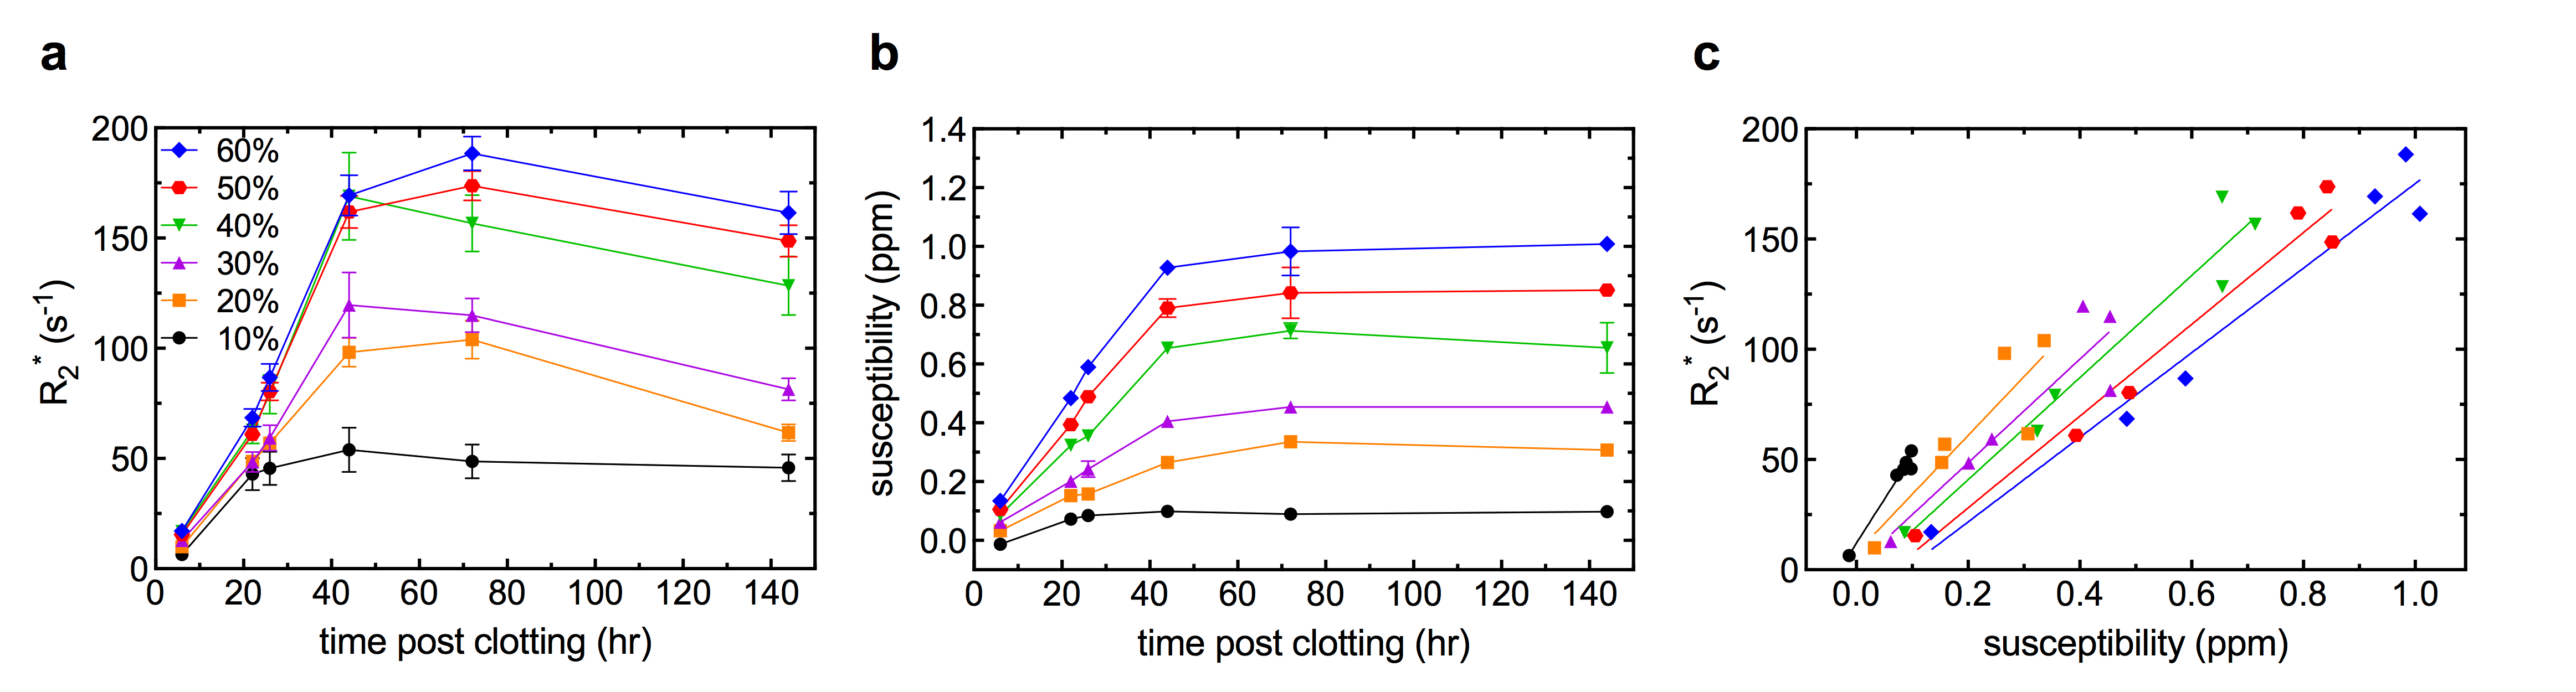
Representative slices from the R2* and QS maps, and mean clot R2* and QS values throughout ageing up to 144 hours are shown in Figures 2a, b and 3a, b, respectively. R2* increased rapidly (up to 4.0 s-1hr-1) over the first 40 hours of ageing, and the similarity between high hematocrit clots remained. QS values also increased over the first 40 hours before reaching a plateau. QS varied linearly with hematocrit at every time point. Figure 3c shows R2* plotted against QS values of all clots from 6 to 144 hours of ageing; a linear relationship with a unique slope was observed for all clots.
Discussion
Increasing clot QS, and subsequently R2* rates due to heightened magnetic susceptibility heterogeneity, in aged blood is a phenomenon well described both in vitro and in vivo.8,9 The 40 to 60% clots have similar R2* values because they have similar magnetic heterogeneity,10 and are difficult to separate based on R2* alone. Little change was observed in R2* and QS values over the first 6 hours post clot formation and values remained relatively low, indicating that thrombus hematocrit may be inferred from R2* or QS values alone if mean values are below a certain threshold (indicating fresh clot). Between 6 and 144 hours clot R2* and QS values both increased greatly, which would hinder the ability of either measure alone to estimate hematocrit in a thrombus of unknown age. However, Fig. 2C demonstrates that examining R2* and QS simultaneously may distinguish clots of different hematocrit at any time, facilitating an estimate of both thrombus hematocrit and age.Conclusion
Fresh blood clots (< 6 hours after formation) of up to 60% hematocrit can be differentiated on the basis of R2* or QS. Aged blood clots (up to 6 days after formation) of up to 60% hematocrit may be differentiated by measuring R2* and QS values simultaneously. This method shows promise for inferring the hematocrit and age of clinical thrombi in vivo.Acknowledgements
The authors would like to thank Trevor Wade for implementation of the pulse sequence and Ralph Bos Meats for providing the porcine blood. M.D. is a Career Scientist of the Heart and Stroke Foundation of Ontario.References
1. Niessen, F., et al., Differences in clot preparation determine outcome of recombinant tissue plasminogen activator treatment in experimental thromboembolic stroke. Stroke, 2003. 34(8): p. 2019-2024.
2. Yuki, I., et al., The impact of thromboemboli histology on the performance of a mechanical thrombectomy device. American Journal of Neuroradiology, 2012. 33(4): p. 643-648.
3. Boeckh-Behrens, T., et al., The impact of histological clot composition in embolic stroke. Clinical Neuroradiology, 2016. 26(2): p. 189-197.
4. Rovira, A., et al., Hyperacute ischemic stroke: middle cerebral artery susceptibility sign at echo-planar gradient-echo MR imaging. Radiology, 2004. 232(2): p. 466-473.
5. Liu, J., S. Christiansen, and M. Drangova, Single multi-echo GRE acquisition with short and long echo spacing for simultaneous quantitative mapping of fat fraction, B0 inhomogeneity, and susceptibility. Submitted to NeuroImage October 2017.
6. Liu, J. and M. Drangova, Method for B0 off-resonance mapping by non-iterative correction of phase-errors (B0-NICE). Magnetic Resonance in Medicine, 2015. 74(4): p. 1177-1188.
7. Liu, J., et al., Morphology enabled dipole inversion for quantitative susceptibility mapping using structural consistency between the magnitude image and the susceptibility map. NeuroImage, 2012. 59(3): p. 2560-2568.
8. Chang, S., et al., Quantitative susceptibility mapping of intracerebral hemorrhages at various stages: Mapping of intracerebral hemorrhages. Journal of Magnetic Resonance Imaging, 2016. 44: p. 420-425.
9. Clark, R.A., et al., Acute hematomas: Effects of deoxygenation, hematocrit, and fibrin-clot formation and retraction on T2 shortening. Radiology, 1990. 175(1): p. 201-206.
10. Janick, P.A., et al., MR imaging of various oxidation states of intracellular and extracellular hemoglobin. American Journal of Neuroradiology, 1991. 12(5): p. 891-897.
Figures