3008
Non-invasive quantitative estimation of blood oxygen saturation with MRI: feasibility of machine learning1Dorothy M. Davis Heart and Lung Research Institute, The Ohio State University, Columbus, OH, United States, 2Department of Biomedical Engineering, The Ohio State University, Columbus, OH, United States, 3Division of Cardiovascular Medicine, Department of Internal Medicine, The Ohio State University, Columbus, OH, United States, 4Department of Radiology, The Ohio State University, Columbus, OH, United States, 5Department of Electrical and Computer Engineering, The Ohio State University, Columbus, OH, United States
Synopsis
Non-invasive estimation of intra-cardiac blood oxygen (O2) saturation by magnetic resonance (MR) imaging would be useful in evaluating shunt severity in congenital heart disease, and oxygen delivery and consumption energetics in heart failure and pulmonary hypertension. Accurate estimation of blood O2 saturation from MR data may be limited, however, by the lack of an accurate model to characterize the dependence on T2 relaxation of blood on its O2 saturation level. The present study explores the feasibility of machine learning to accurately predict blood O2 saturation; the performance is evaluated in a preliminary cohort of patients against the Luz-Meiboom model.
Introduction
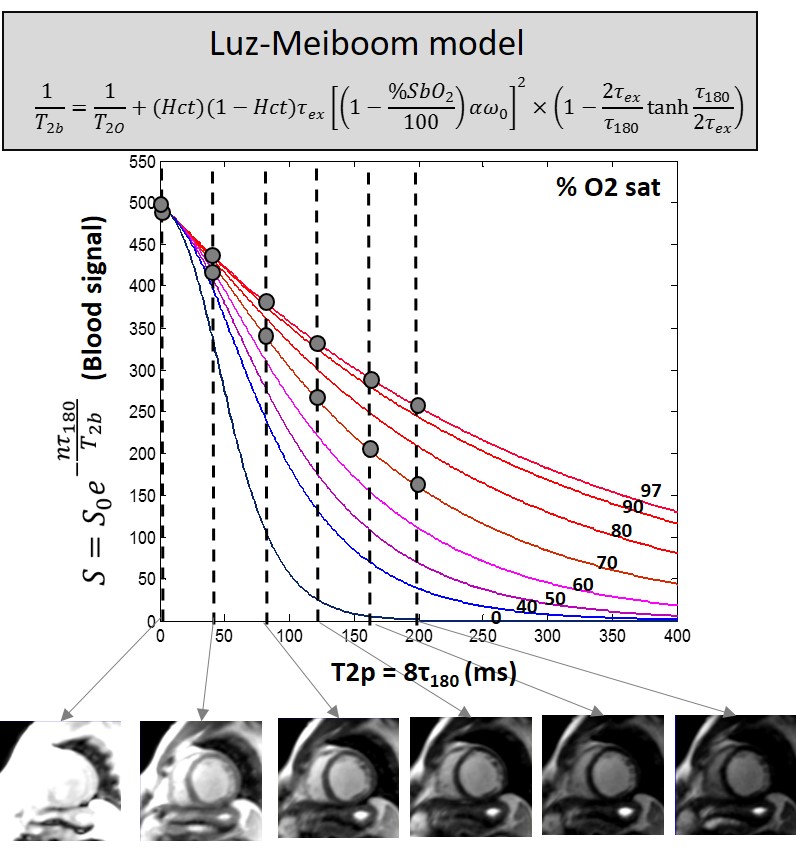
Blood oxygen (O2) saturation in cardiac chambers and vessels is clinically used to determine shunt severity in congenital heart disease, and oxygen delivery and consumption impairment in heart failure and pulmonary hypertension. The current measurement is via invasive catheterization. Cardiovascular magnetic resonance (CMR) can non-invasively estimate blood O2 saturation based on the Luz-Meiboom model (Figure 1)1,2. However, accurate determination of O2 saturation from the L-M model has proven to be difficult since (i) it contains several unknown parameters, and (ii) the L-M or other parametric models may not accurately capture the complex physical and physiological mechanisms involved. In this context, machine learning may provide a model-free platform to better define the blood T2-O2 saturation relationship, and in turn, accurately predict blood O2 saturation from the T2 weighted MR signal of blood.Purpose
To investigate the feasibility and potential of machine learning for quantitative blood oximetry, neural net (NN) was used to estimate O2 from MRI data simulated using L-M model. This study provided an estimate for the number of data samples that might be needed to adequately train NN. As proof of concept, the performance of NN oximetry was evaluated against the L-M model in a small pilot cohort of patients.Methods
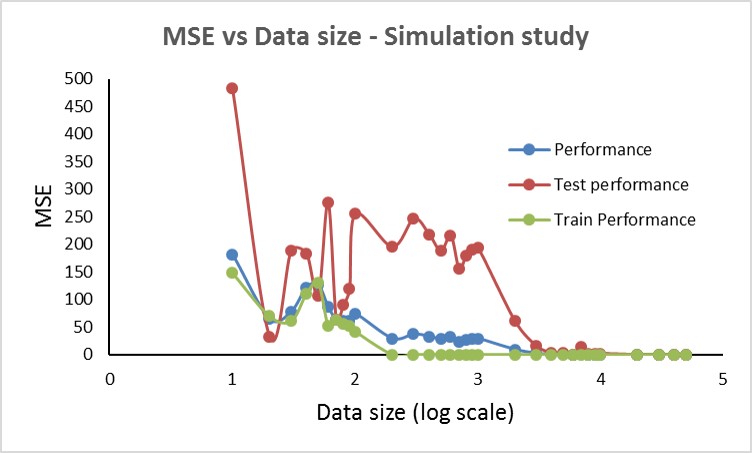
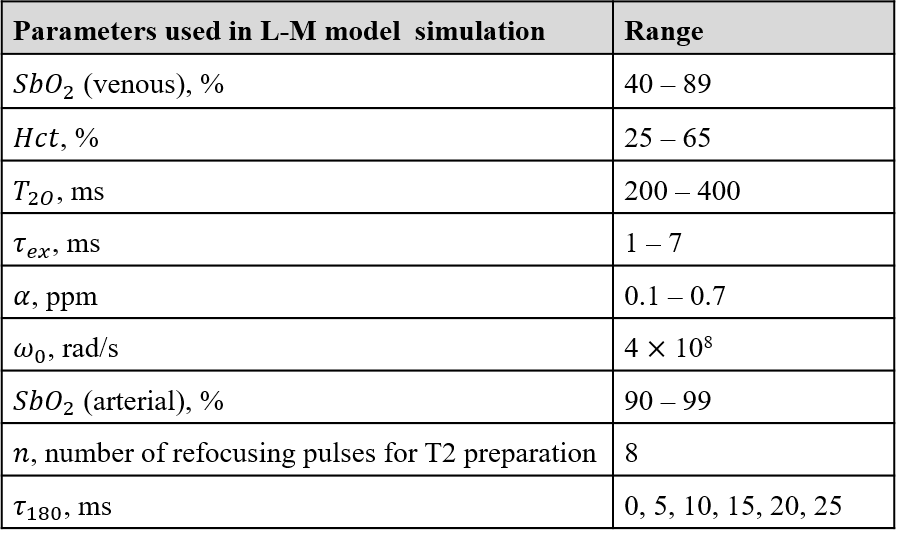
Simulation Study: Using the L-M model, 50,000 paired data sets of arterial and venous blood signal were simulated (Table 1) in Matlab R2017a (The Mathworks, Inc, Natick, MA, USA). For each value of blood O2 saturation, T2 weighted MR blood signal (S) was simulated for six τ180 times. The simulated arterial and venous blood signal, arterial O2 saturation, and hematocrit (Hct) were fed as the inputs to a function-fitting, feed-forward neural network with two hidden layers (size 25 each). NN training with Bayesian regularization was performed using 85% of the data and tested on the remaining 15% to predict venous O2 saturation. The mean squared error (MSE) was used to assess NN performance. NN training and testing process was repeated on data samples numbering from 10 to 50,000 in logarithmic increments.
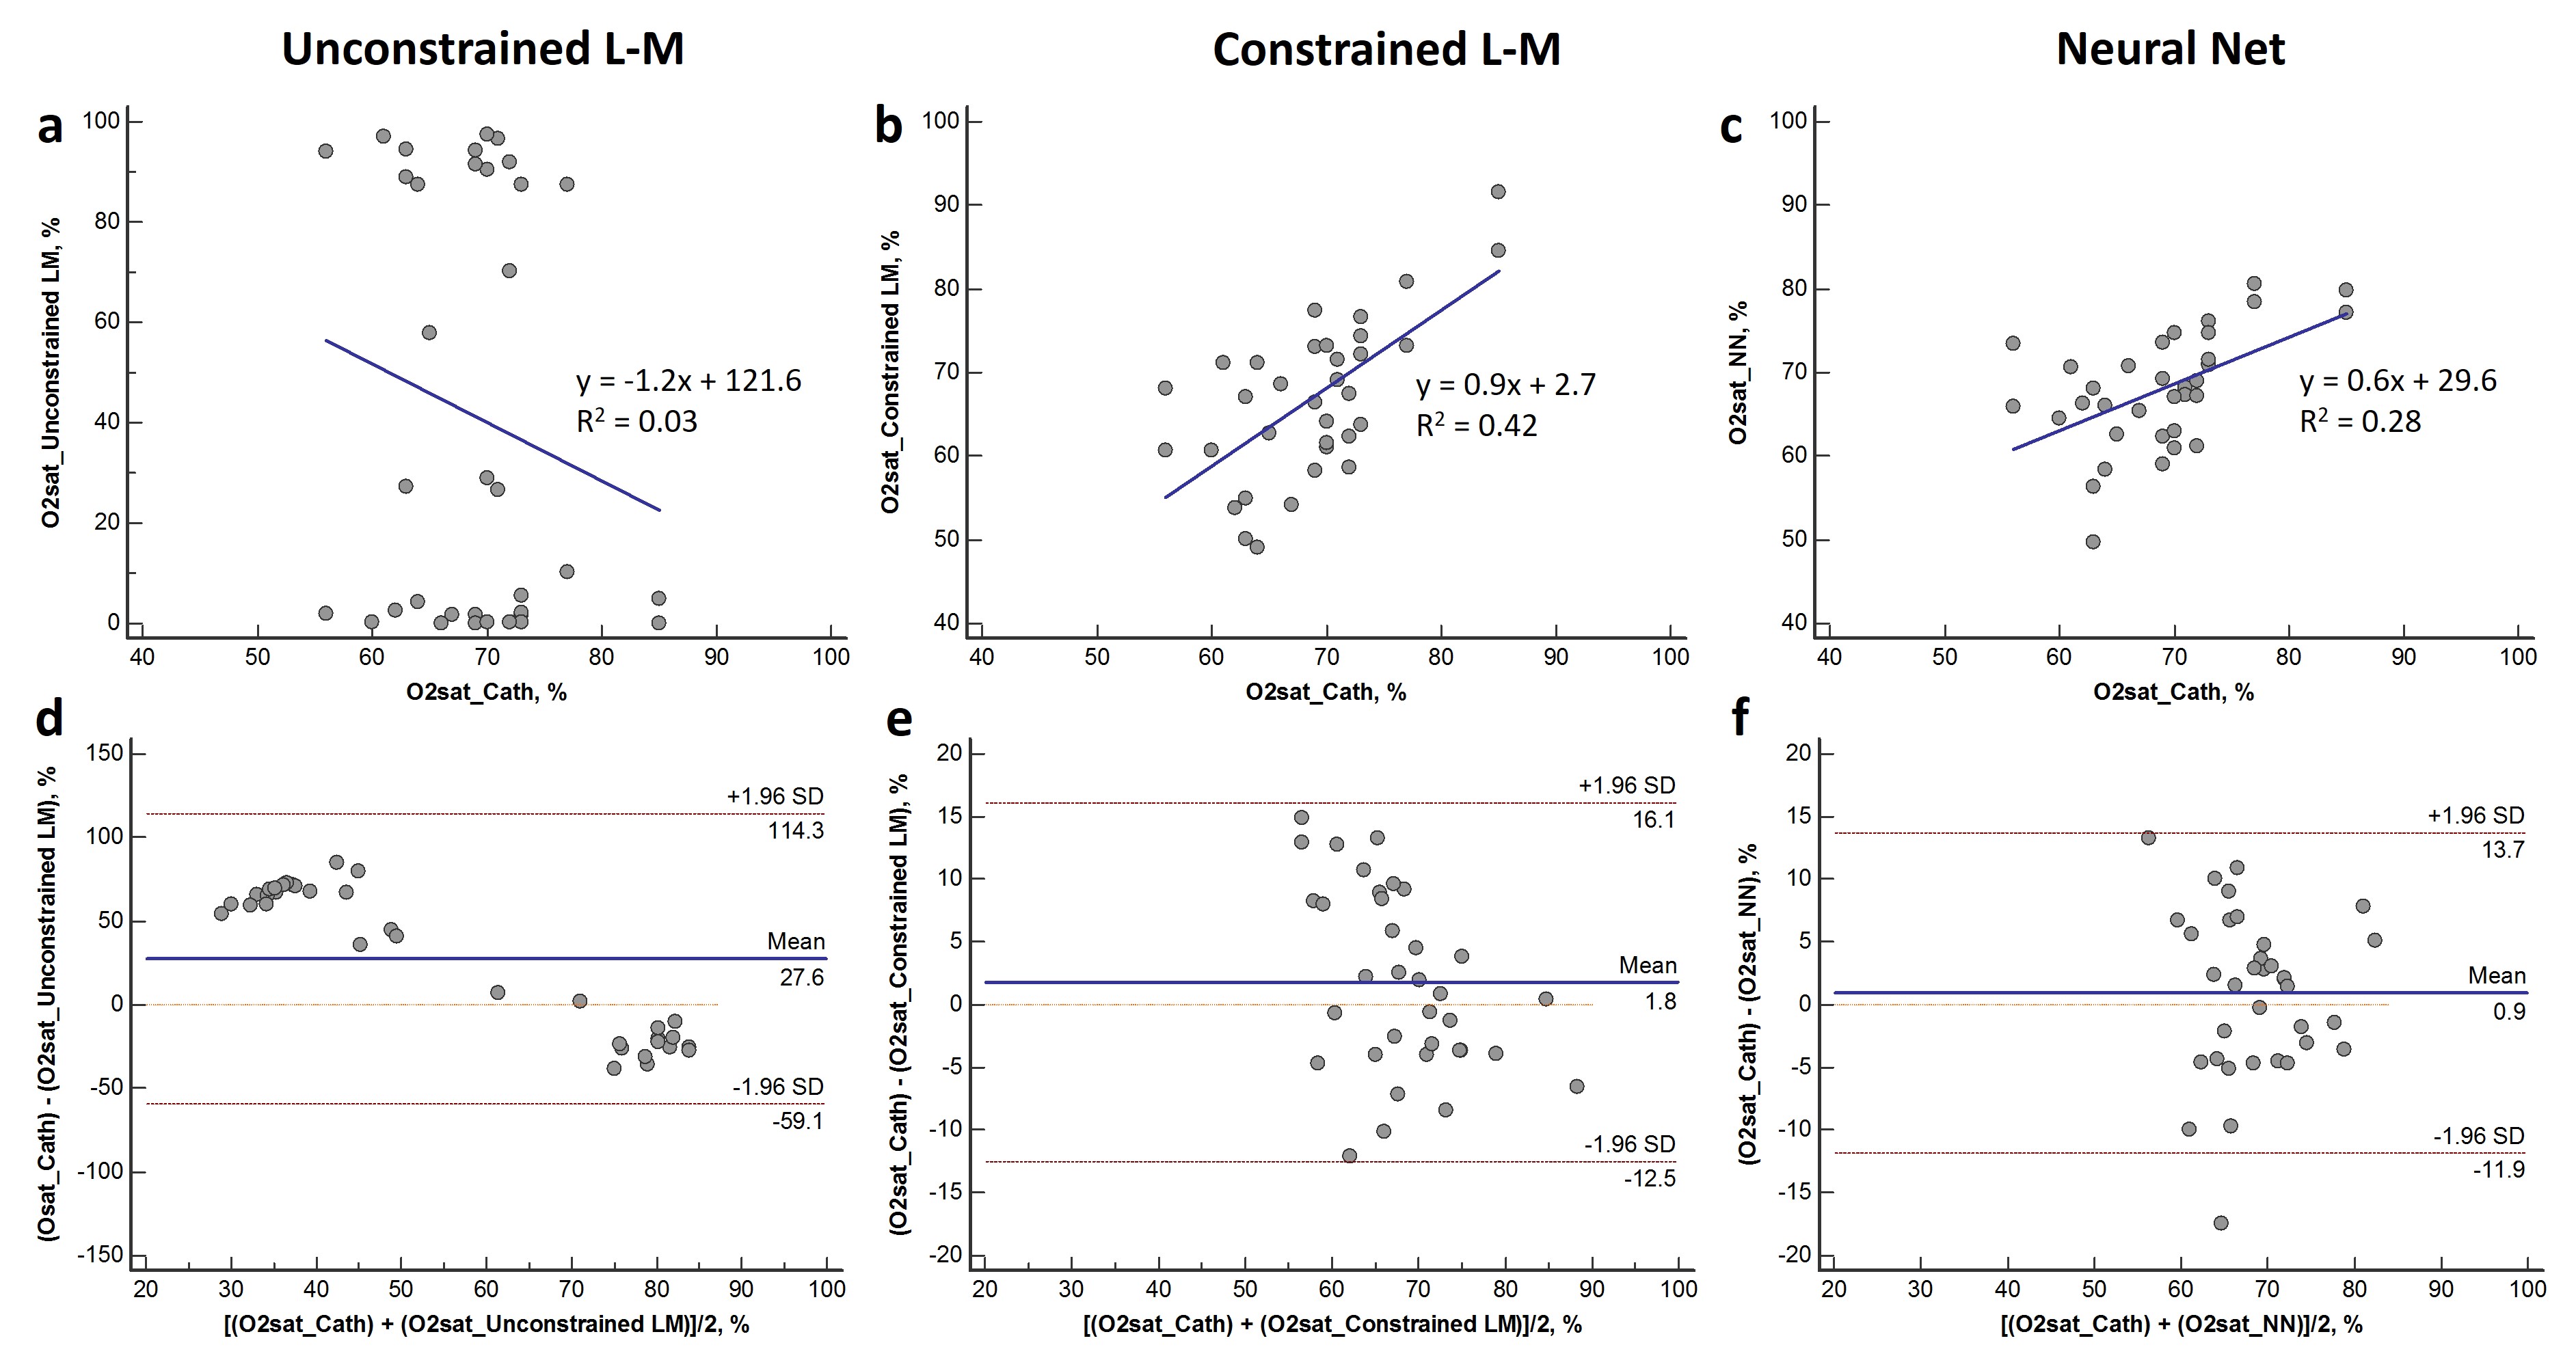
MRI study: MR blood signal measurements in the right ventricle (short axis view, arterial reference region - left ventricle) were measured in 22 patients (age, 60 ± 18 years, eight females) on a 1.5T MRI system (MAGNETOM, Avanto, Siemens Healthcare, Erlangen, Germany). Measurements were also obtained in the pulmonary artery (cross sectional view, arterial reference region - aorta) in a subset of 13 patients, leading to a total of 35 data sets. For each patient, cardiac triggered, T2 prepared single-shot balanced steady state free precession (bSSFP) images were acquired across T2 preparation times (T2p) ranging from 0 to 200 ms (T2p = 8*τ180) in diastole (TR, 5000 ms to ensure adequate blood T1 recovery, TR/TE of SSFP readout = 332/0.89 ms, FA = 700, 1 NEX, GRAPPA factor = 2, BW = 1500 Hz/px, 3.1x3.1x10mm3, and TA = 30 sec). Venous and arterial blood signal measurements (from regions of interest placed in the blood pool), Hct measured from a blood sample, and reference arterial O2 saturation measured non-invasively by a pulse oximeter during MR image acquisition, were jointly fitted to unconstrained and constrained L-M model3,4, to estimate venous O2 saturation. For the NN method, leave-one-out cross validation strategy was used where 34 (out of 35) data sets served as training data. The results were compared against blood O2 saturation determined from clinically indicated right heart catheterization.
Results
The results of the NN simulation shows that at least 200 samples (2000, if MSE of tested data alone is considered) are required to predict O2 saturation with an MSE below 25% (Figure 2). Linear regression and Bland Altman analysis of the three methods (Figure 3) reveal a significant linear relationship (p<0.0001) and non-significant bias for O2 saturation determined with constrained L-M model and NN oximetry techniques. The unconstrained L-M model showed the worst linear relationship as well as significant systematic bias with catheterization results.Discussion & Conclusion
In this study, we explored machine learning to non-invasively estimate blood O2 saturation from MRI. The unconstrained L-M model clearly fails to estimate blood O2 saturation, indicating a potential model mismatch or insufficient sensitivity to determine the multiple unknown L-M model parameters. While the constrained L-M model (the bounds on the parameters were previously determined from training data) exhibits a regression slope closer to unity, the NN technique demonstrates the smallest bias and limits of agreement in the Bland Altman plot. A large sample size may be required to effectively train the NN for non-invasive MR oximetry. The outcomes of this preliminary study, involving a small sample size, demonstrates the promise of machine learning as a tool to accurately and non-invasively estimate blood O2 saturation by MRI.Acknowledgements
Funded by NIBIB R21EB021638 and NHLBI 5T32HL098039-07References
1. Wright GA, Hu BS, Macovski A. 1991 I.I. Rabi award. Estimating oxygen saturation of blood in vivo with MR imaging at 1.5 T. JMagn Reson Imaging. 1991;1(3):275–83.
2. Luz Z, Meiboom S. Nuclear magnetic resonance study of the Protolysis of Trimethylammonium ion in aqueous solution - order of the reaction with respect to solvent. J Chem Phys. 1963;39(2):366–70.
3. Varghese J, Ahmad R, Jin N, Potter LC, Simonetti OP. Venous oxygen saturation estimation from multiple T2 maps with varying inter-echo spacing. J Cardiovasc Magn Reson. 2016;18(Suppl 1):W29.
4. Varghese J, Potter LC, LaFountain R, Pan X, Raman SV, Ahmad R, Simonetti OP. CMR-based blood oximetry via multi-parametric estimation using multiple T2 measurements. J Cardiovasc Magn Reson. 2017 (in press).
Figures