3003
Assessment of carotid atherosclerosis: a comparison between 2D and 3D multi-contrast vessel wall magnetic resonance imaging1Center for Biomedical Imaging Research, Department of Biomedical Engineering, Tsinghua University, Beijing, China, 2Department of Radiology, University of Washington, Seattle, WA, United States, 3Philips Research North America, Cambridge, MA, United States
Synopsis
In this study, we compared morphological measurements and identification of plaque components in carotid artery between 2D and 3D multi-contrast vessel wall MRI techniques. 3D multi-contrast vessel wall imaging, with 0.8mm isotropic resolution and 15min total scan time, showed good inter-reader reproducibility and provided comparable morphological information as 2D multi-contrast imaging, and more importantly, has its potential to improve visualization of plaque components.
Introduction
Atherosclerosis in a major cause of ischemic stroke1. 2D multi-contrast vessel wall magnetic resonance imaging (MRI) techniques enables detection and classification of carotid atherosclerotic plaques2, and its accuracy and reliability has been proved by histology3. Recently, 3D multi-contrast vessel wall MRI with an advantage of higher SNR and larger coverage has been developed and optimized4. In this study, we aim to compare morphological measurements and identification of plaque components in carotid artery between 2D and 3D multi-contrast vessel wall MRI techniques.Methods
Study population: 26 patients (15 males and 11 females, age: 42 ~ 85 years) with recent (within 2 weeks) ischemic stroke or Transient Ischemic Attack (TIA) were consecutively recruited in this study after informed consent.
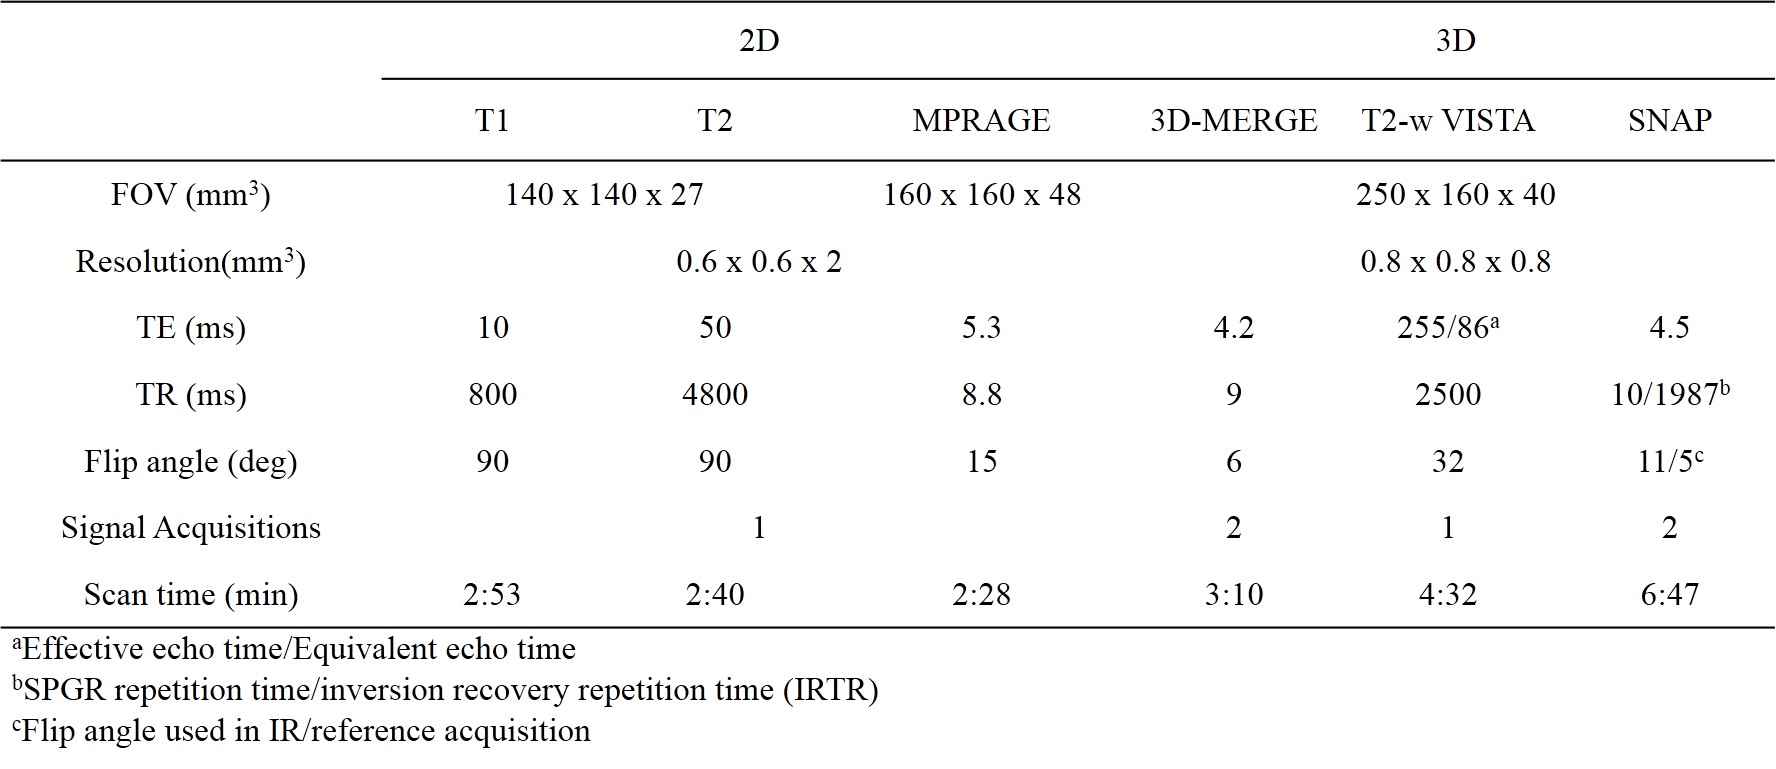
MRI Protocol: All images were obtained on a 3T MR scanner (Philips Achieva TX, Best, Netherland). For 3D scan, we utilized 3D-MERGE, T2-weighted VISTA and SNAP, as reported in previous study4. For 2D scan, T1-TSE, T2-TSE and MPRAGE were used to provide T1, T2 and hyper-T1 contrast of carotid vessel wall. All imaging parameters for both 2D and 3D protocol were summarized in Table.1.
Image analysis: 2D and 3D scan geometries were centered in the bifurcation of the index side. All subsequent analyses were done on the index side artery. Image registration and data reformation were conducted in a Philips workstation to match 3D with 2D datasets. Independent review was performed for 2D and 3D datasets with a three-month interval using CASCADE5. For 3D datasets, data was analyzed by two reviewers to test inter-observer variability. For all 2D and 3D scans, morphological parameters, including lumen area (LA), wall area (WA), mean wall thickness (MWT) and maximum wall thickness (MaxWT), were measured, and the existence of plaque components, including lipid-rich necrotic core (LRNC), intra-plaque hemorrhage (IPH) and calcification (CA), were identified.
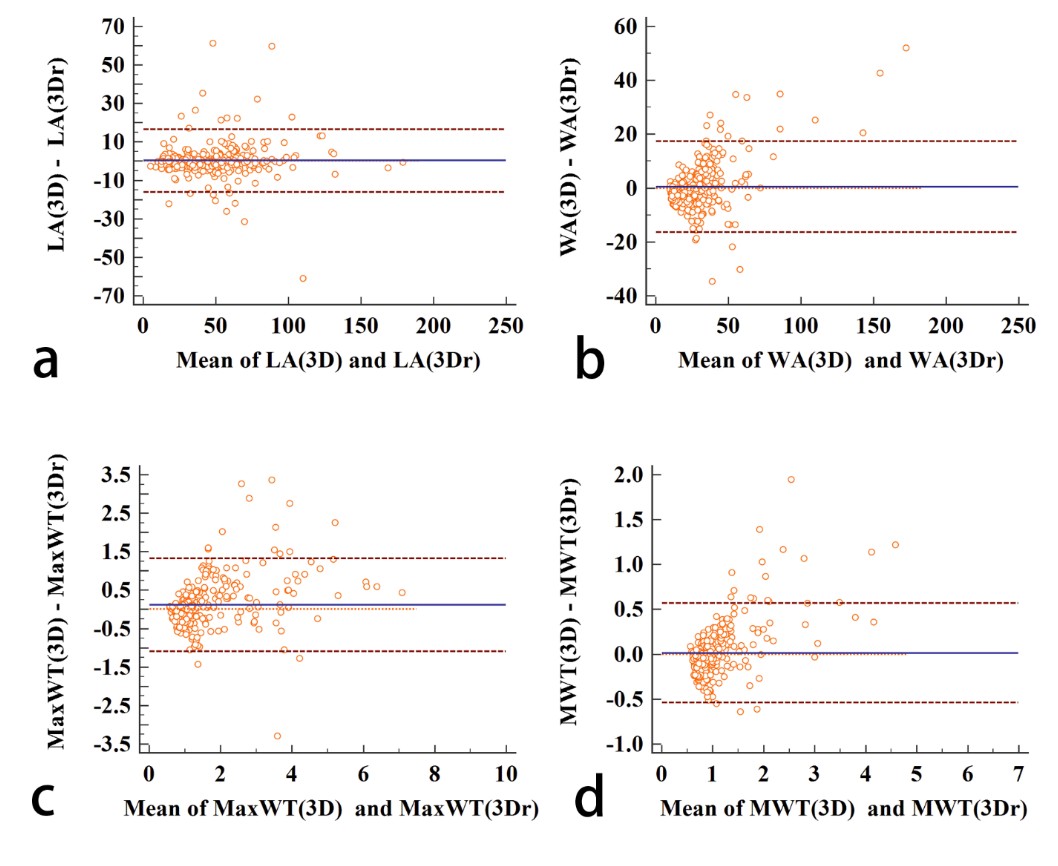
Statistical analysis: Bland-Altman plots were used to assess reproducibility of 3D morphological measurements. Two-way absolute agreement intra-class correlation coefficient (ICC) and R value were used to determine the agreement of 2D and 3D morphological parameter measurements at slice-based levels. For plaque components identification, sensitivity/specificity were calculated to quantify the agreement between 2D and 3D measurements.
Results
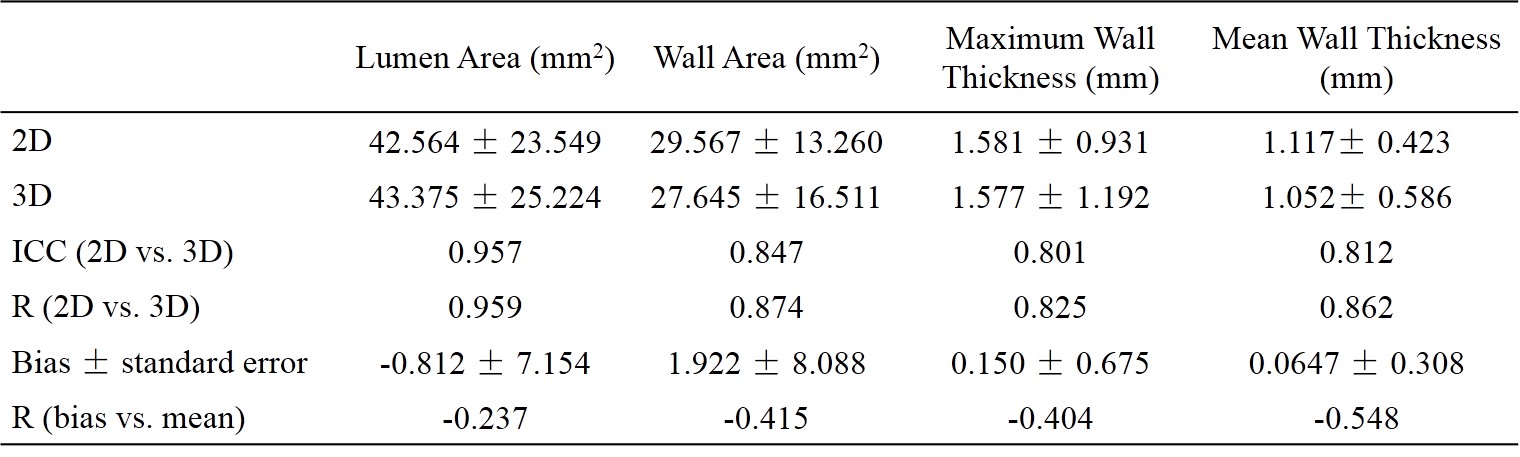
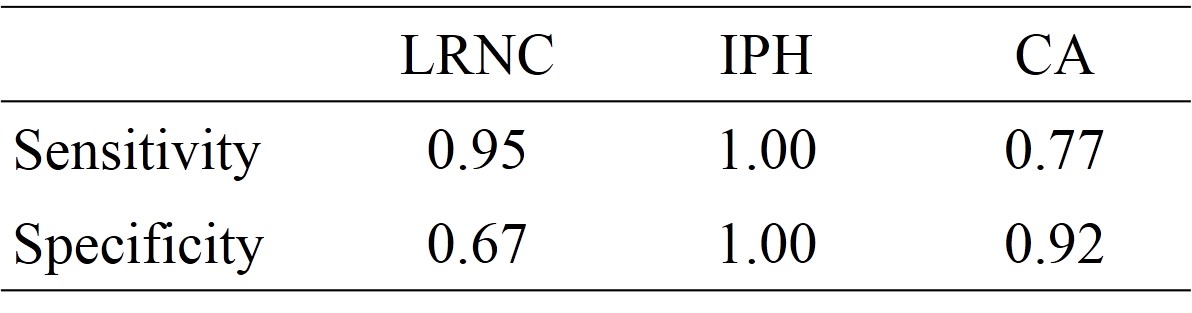
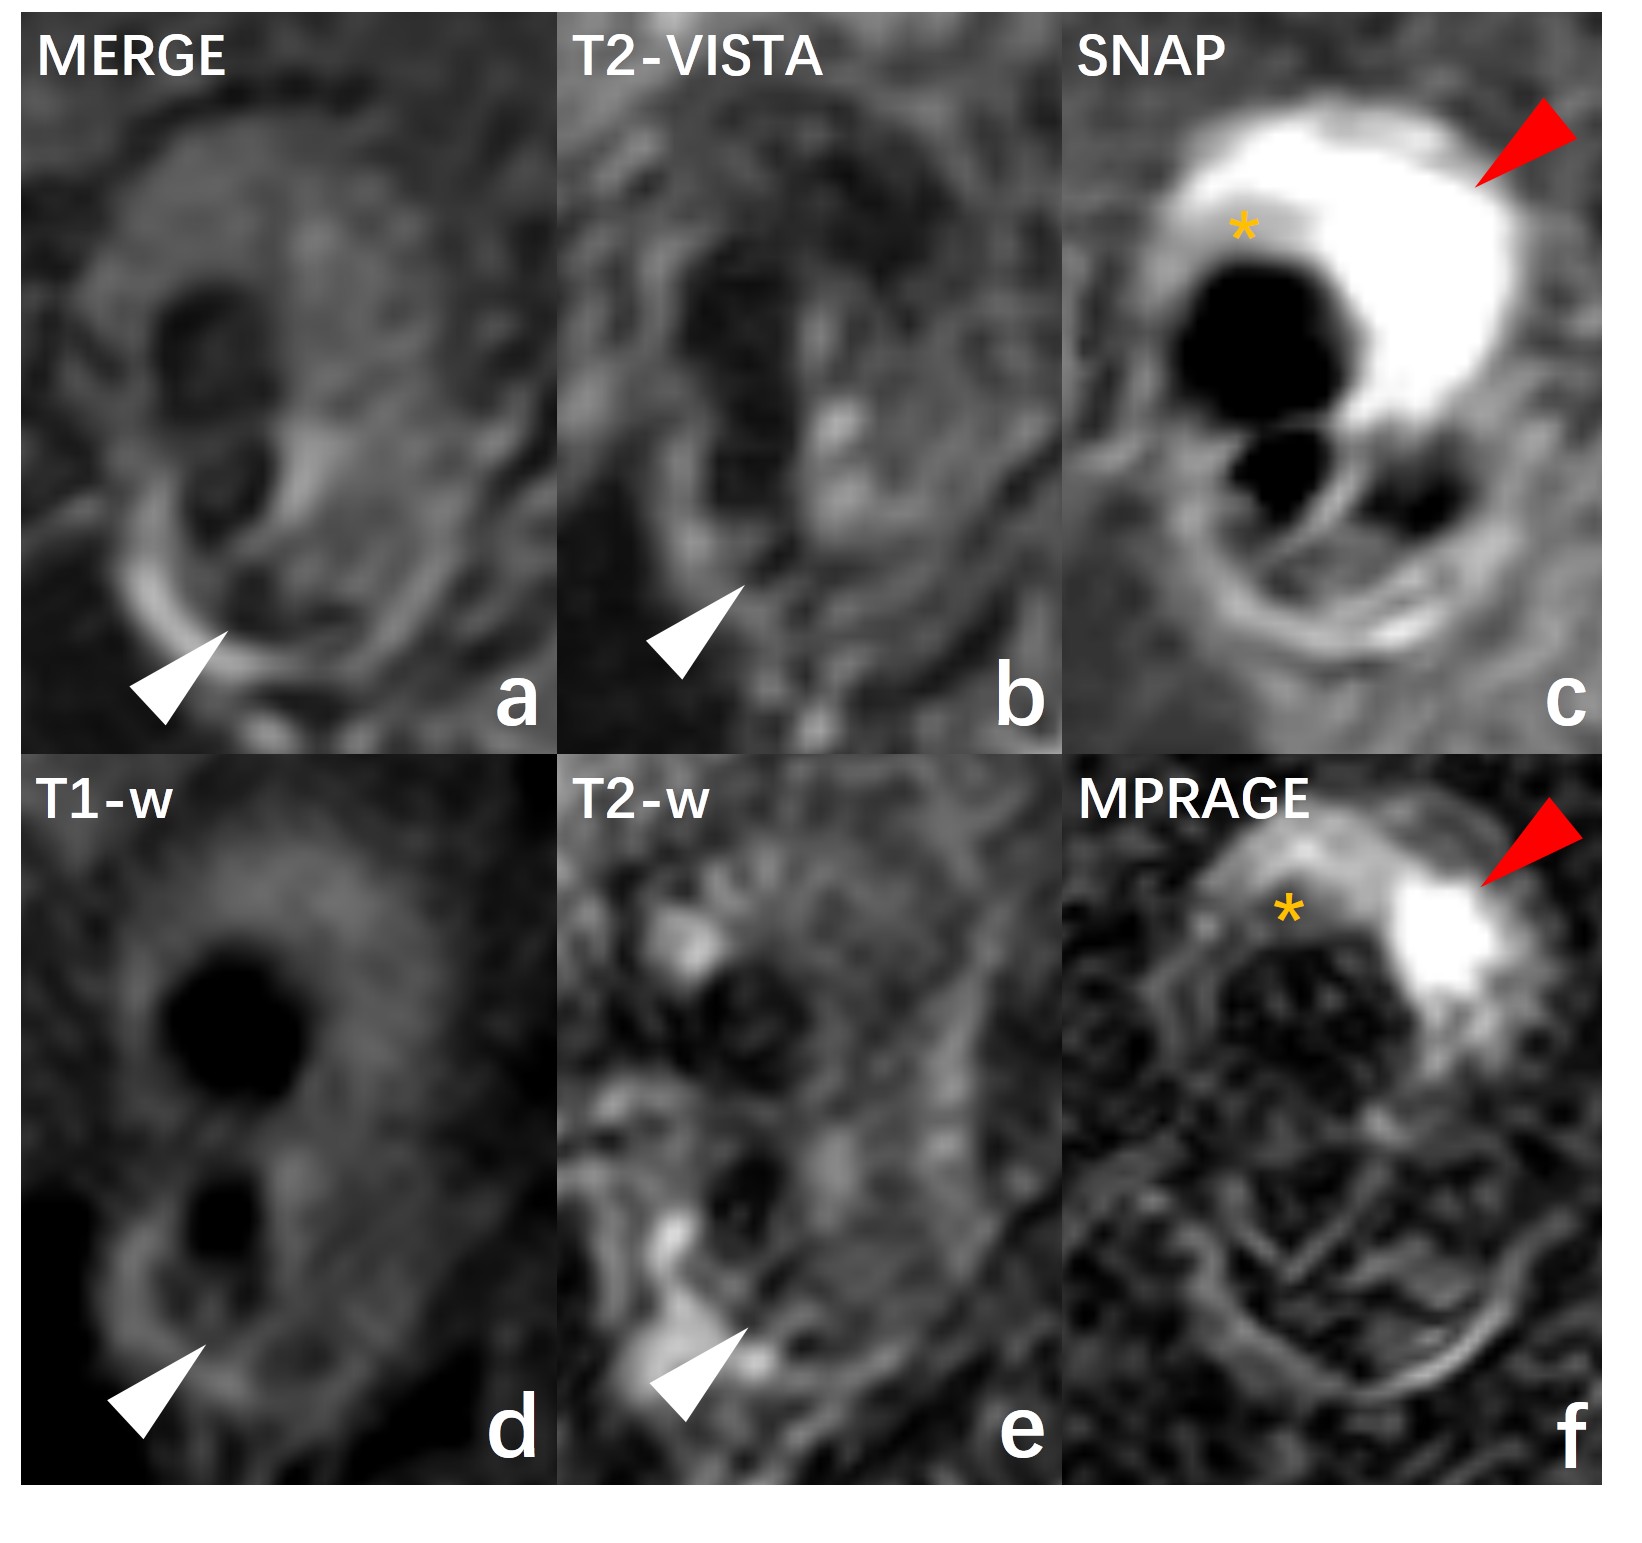
Reproducibility of 3D analysis is shown by Bland-Altman plots (Fig.1). LA, WA, MaxWT and MWT values are given in Table.2. There were no significant correlations between bias and mean for all morphological measurements. ICC and R values showed good agreement for all morphological measurements. Comparing with 2D imaging, 3D imaging slightly overestimated LA (2D - 3D = -0.812 ± 7.154 mm2) and underestimated WA (2D – 3D = 1.922 ± 8.088 mm2), MaxWT (2D – 3D = 0.150 ± 0.675 mm) and MWT (2D – 3D = 0.0647 ± 0.308 mm). For plaque components identification, Table.3 showed good sensitivity (0.95) and moderate specificity (0.67) for LRNC, excellent sensitivity (1.00) and specificity (1.00) for IPH, and moderate sensitivity (0.77) and good specificity (0.92) for CA, when setting 2D results as gold standard. Fig.2 showed an example of patients with LRNC (orange asterisk in Fig2a,c,d,f), IPH (red arrow in Fig.2c,f) and CA (white arrow in Fig2a,b,d,e).Discussion
In this study, we assessed and compared the performance of 2D and 3D multi-contrast vessel wall MR imaging. In morphological measurements, 3D multi-contrast vessel wall imaging showed good inter-reader reproducibility and obtained good agreement with 2D imaging in LA, WA, MaxWT and MWT. This study also indicated that LA measurements in 3D images are slightly larger than in 2D images, thus resulting in underestimation of WA, MWT and MaxWT. This is probably because 3D blood suppression techniques performed better than 2D techniques, especially in region of lumen-wall boundaries where slow blood flow appears. In plaque components identification, 3D imaging showed excellent agreement with 2D imaging in IPH detection, and good agreement in CA and LRNC detection. Furthermore, 3D imaging, with 0.8 mm isotropic spatial resolution, provided better visualization of small plaque components, especially for IPH detection, while 2D imaging suffers from partial volume effects. These three 3D imaging sequences can be used simultaneously in clinical practice. MERGE can provide clear lumen wall boundaries that is beneficial for depiction of LA and WA. T2-VISTA and SNAP has the ability to detect LRNC, CA and IPH.Conclusion
In conclusion, 3D multi-contrast vessel wall imaging, with 0.8mm isotropic resolution and 15min total scan time, provides comparable information as 2D multi-contrast imaging, and more importantly, has its potential to improve visualization of plaque components.Acknowledgements
No acknowledgement found.References
1. Arenillas JF. Stroke 2011;42:S20-3.
2. Yuan C, et al. Radiology 2001;221(2):285-299.
3. Cai JM, et al. Circulation 2002;105(2):181-5.
4. Zhou ZC, et al. JCMR 2015;17:41.
5. Liu F, et al. MRM 2006;55:659-688
Figures