2983
Triple Accelerated NCE-MRA with optimised sampling patterns1Department of Radiology, University of Cambridge, Cambridge, United Kingdom
Synopsis
In this study, we developed an acceleration technique combining compressed sensing (CS), parallel imaging (PI) and partial Fourier (PF) for the fresh blood imaging (FBI) sequence. Then, we evaluated the influence of the pattern design parameters and explored the optimal values for these parameters. By using the optimised sampling patterns, the FBI acquisition can be accelerated up to 10 times while the image quality is maintained.
Introduction
NCE-MRA techniques suffer from a long acquisition time, especially the subtraction-based techniques requiring more than one acquisition. Partial fourier (PF) sampling and parallel imaging (PI) are commonly used to accelerate the acquisition in clinical MR examinations. Compressed sensing (CS)1 can also be combined with PI or partial k-space sampling to further reduce the acquisition time. However, the design of the optimal sampling pattern, and how to determine the optimal parameters for combining PF, PI and CS still needs to be evaluated. This study aims to develop an acceleration technique for the fresh blood imaging (FBI) sequence2 and explore the optimal values for the parameters in sampling pattern design.Method
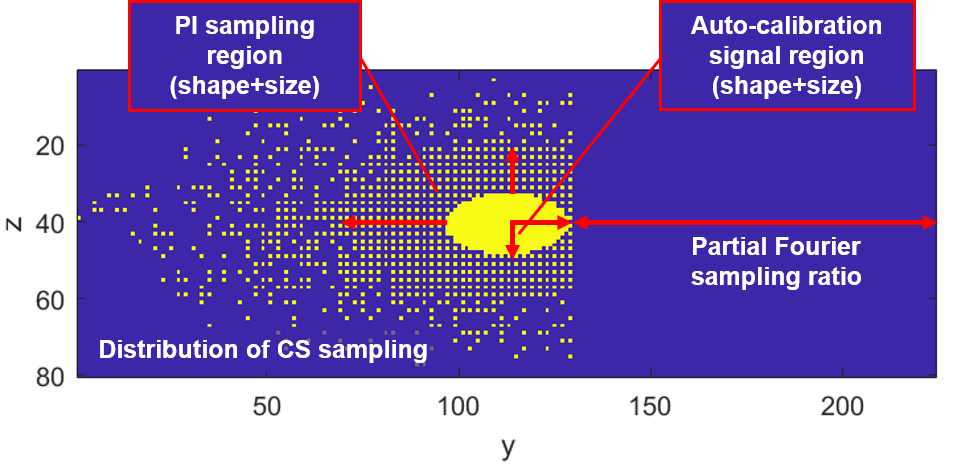
Fig. 1 shows a typical acceleration sampling pattern in the phase-encoding dimension for 3D acquisition. The pattern design parameters that were optimised in this study included auto-calibration signal (ACS) region shape/size, PI sampling region shape/size, PI acceleration factor in y and z directions, sigma variance value in the Gaussian probability distribution for CS sampling and the CS acceleration factor.
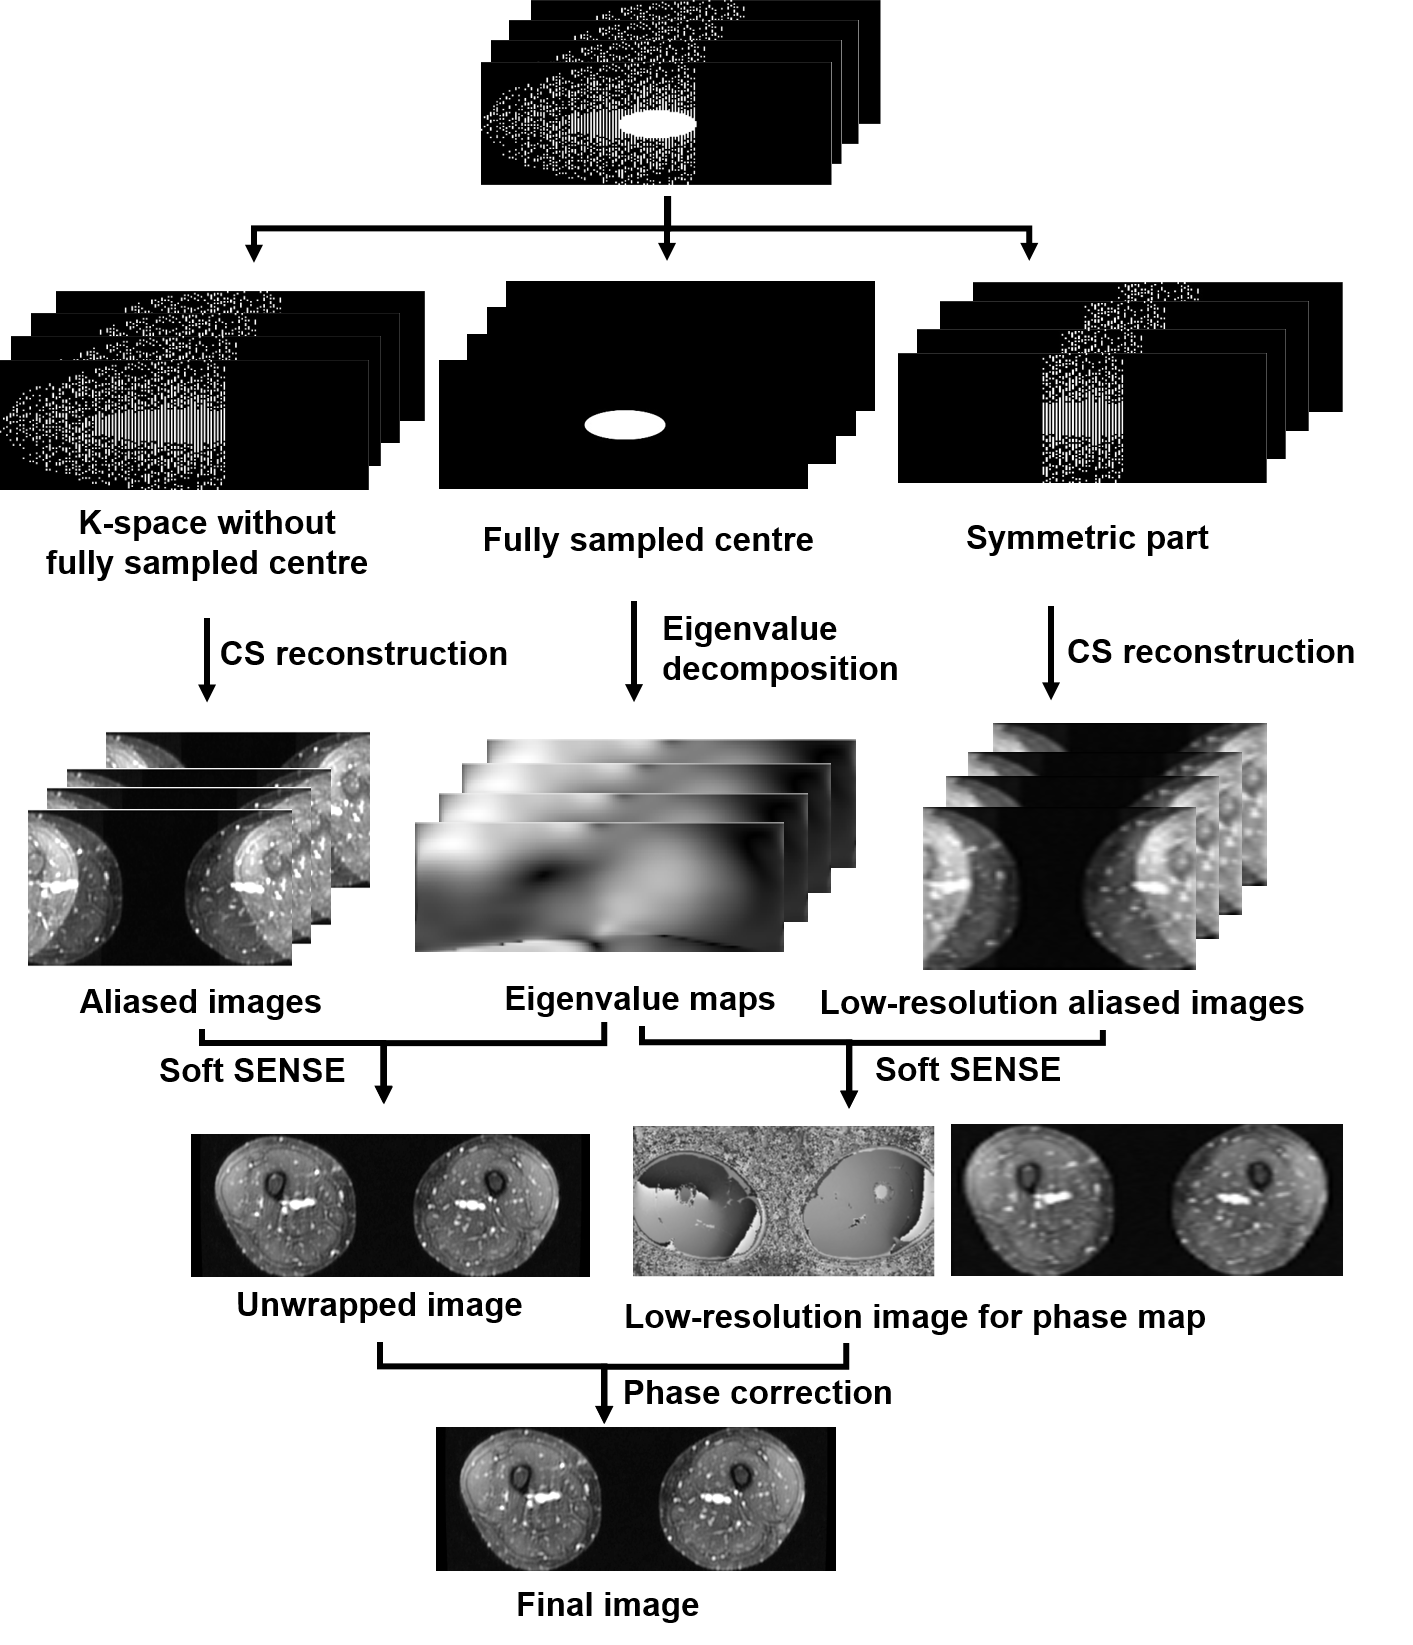
Fig. 2 shows the image reconstruction process. The Berkeley Advanced Reconstruction Toolbox (BART)3 with ESPIRiT4 for PI calibration and l1-wavelet for CS reconstruction was used to reconstruct the undersampled data. Because angiography images require more image details to visualise small branch vessels, we chose a small value of 0.005 for the l1 penalty parameter λ in this study.
Images of the lower limb arteries were acquired at 1.5 T (GE Healthcare, Waukesha, WI) using 25 channels of a peripheral vascular coil. The FBI sequence parameters were: TE 60ms, TR 3 RR interval, ETL 90, acquired matrix 224×224×80, FOV 40 cm, slice thickness 2 mm. The optimisation experiments were performed by simulation using the fully sampled data set acquired from a healthy volunteer. The total number of sampling points every pattern was kept constant for each experiment, except in optimisation of the CS acceleration factor. Only one or two parameters were varied in each study to test their influence on the reconstruction quality. Then, the optimised sampling patterns were tested on the FBI lower limb datasets from three healthy volunteers.
The fully sampled image was used as the reference image. Image quality was assessed using correlation coefficients (CC) and the normalized mean square error (NMSE)5 calculated between the reference image and the reconstructed image. A semi-automatic method6 was also implemented to assess the sharpness of the vessel edges.
Results and discussion
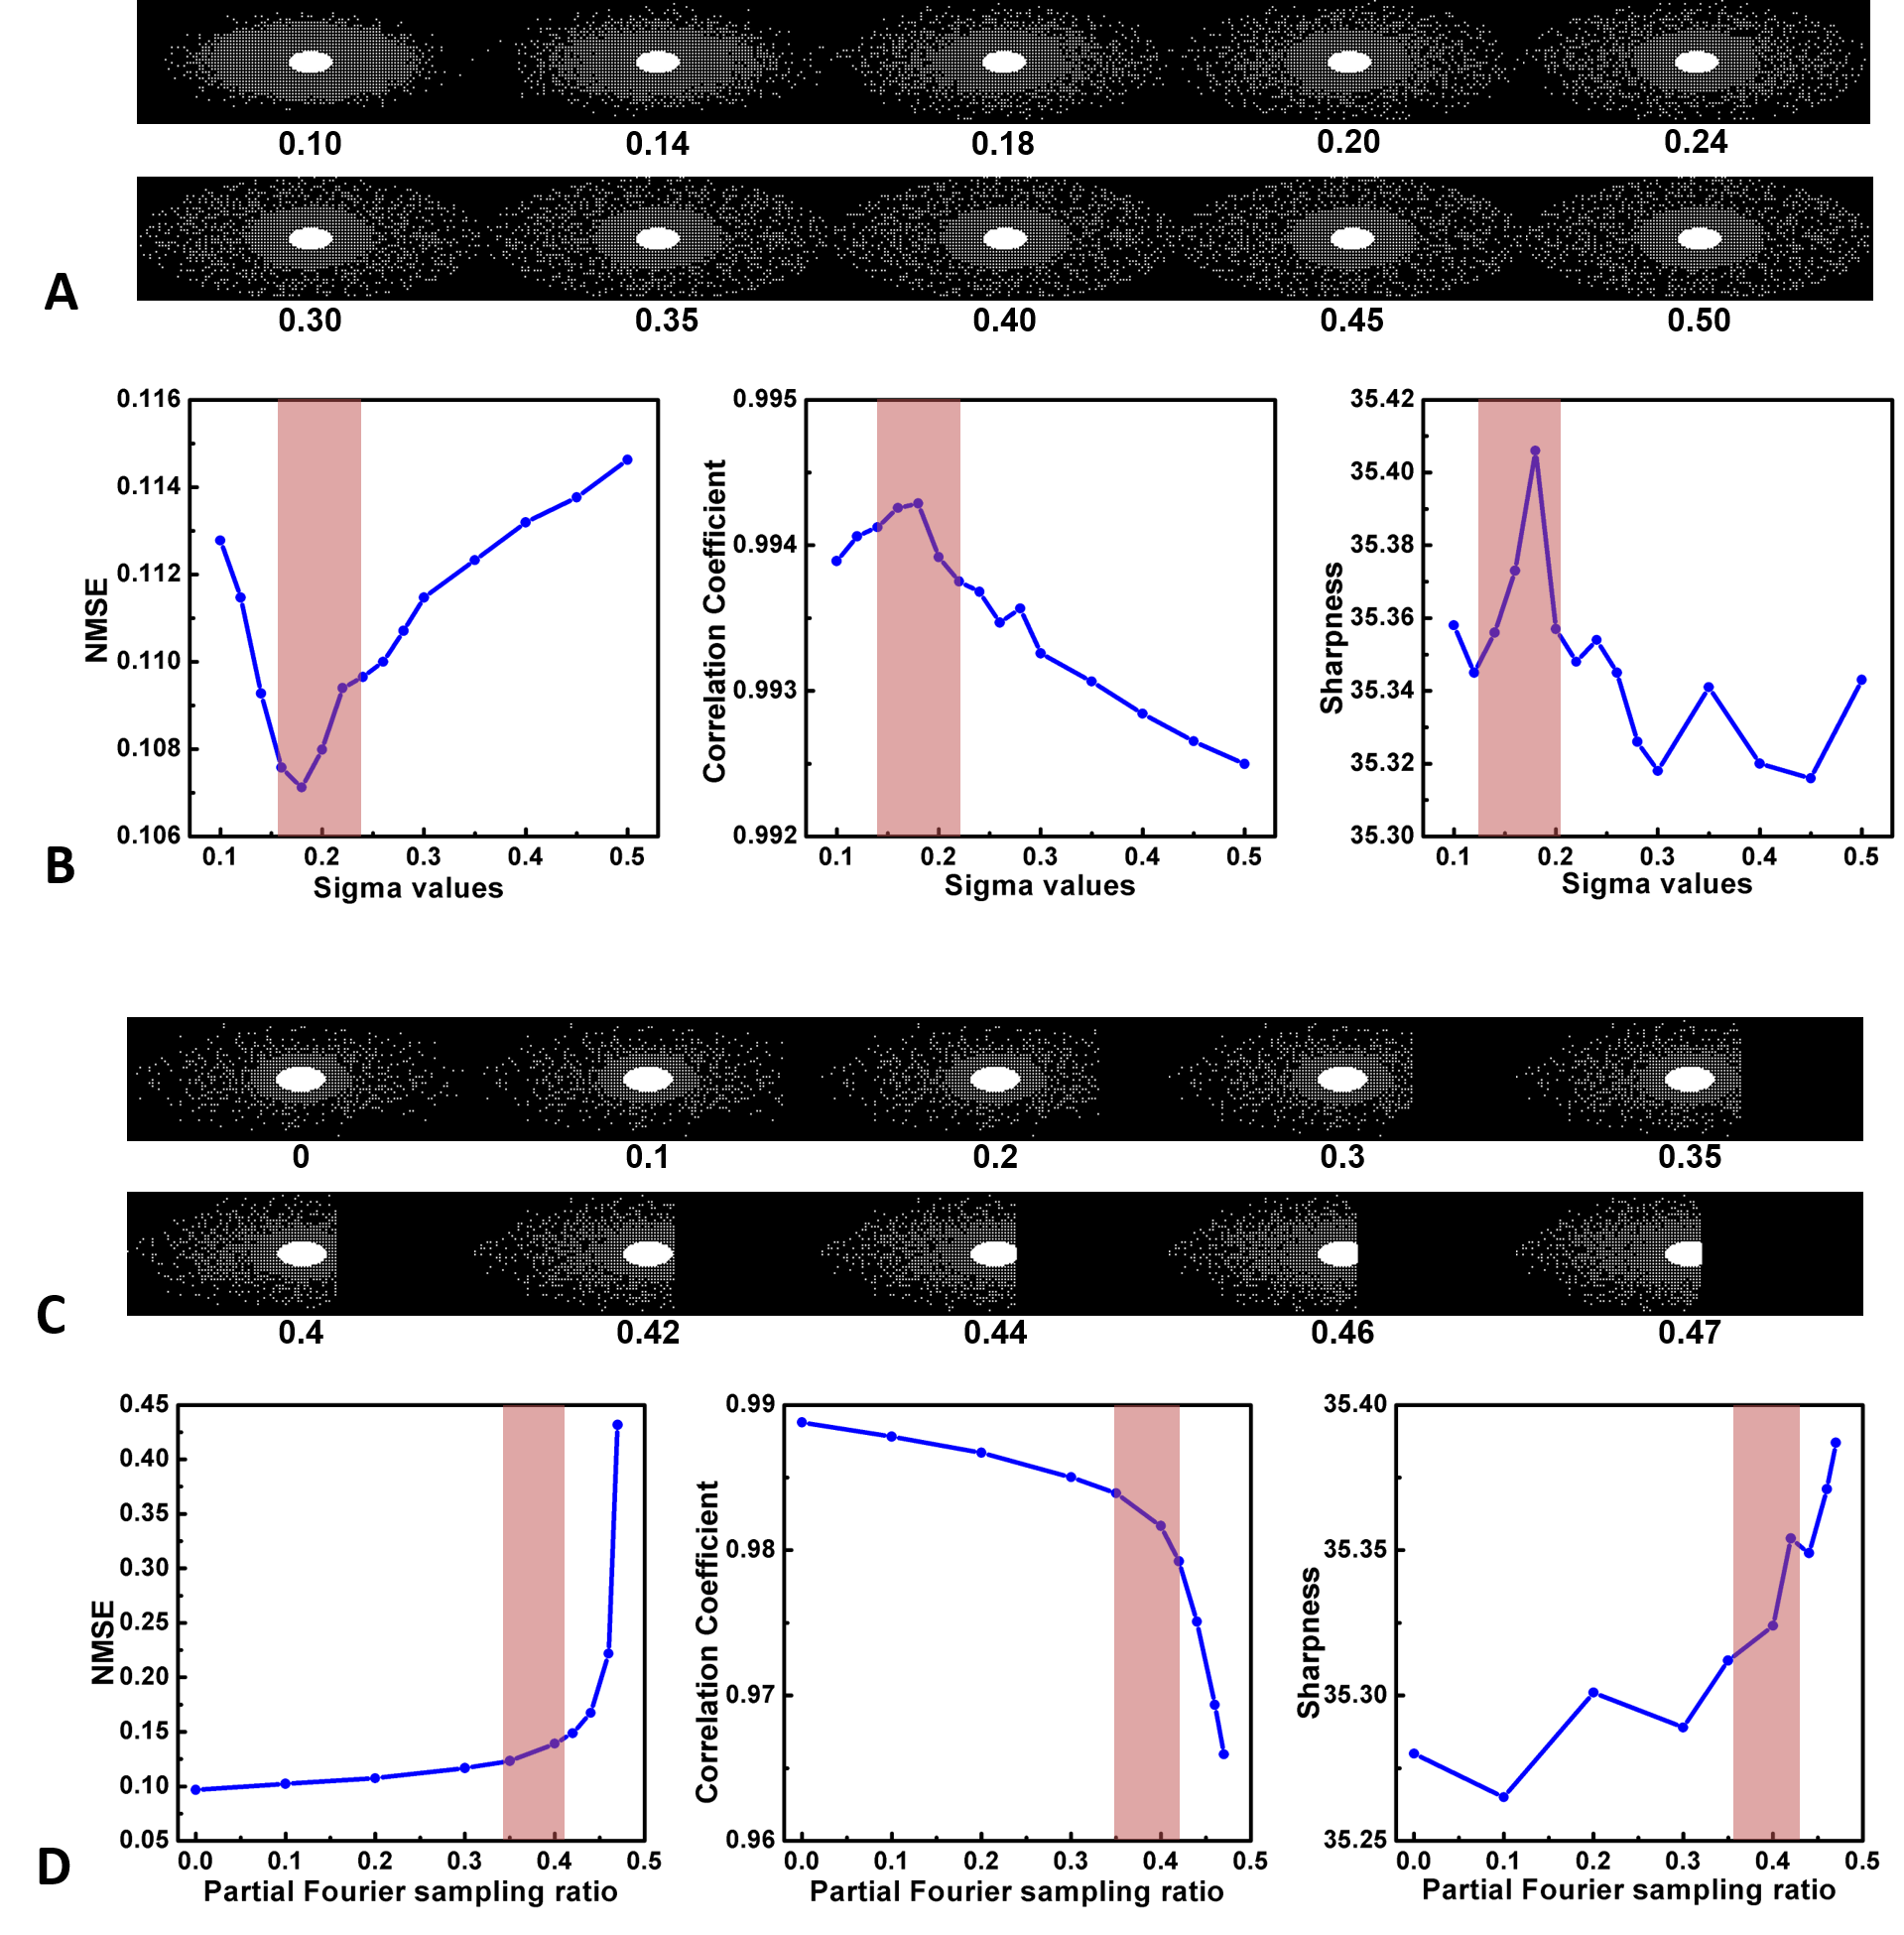
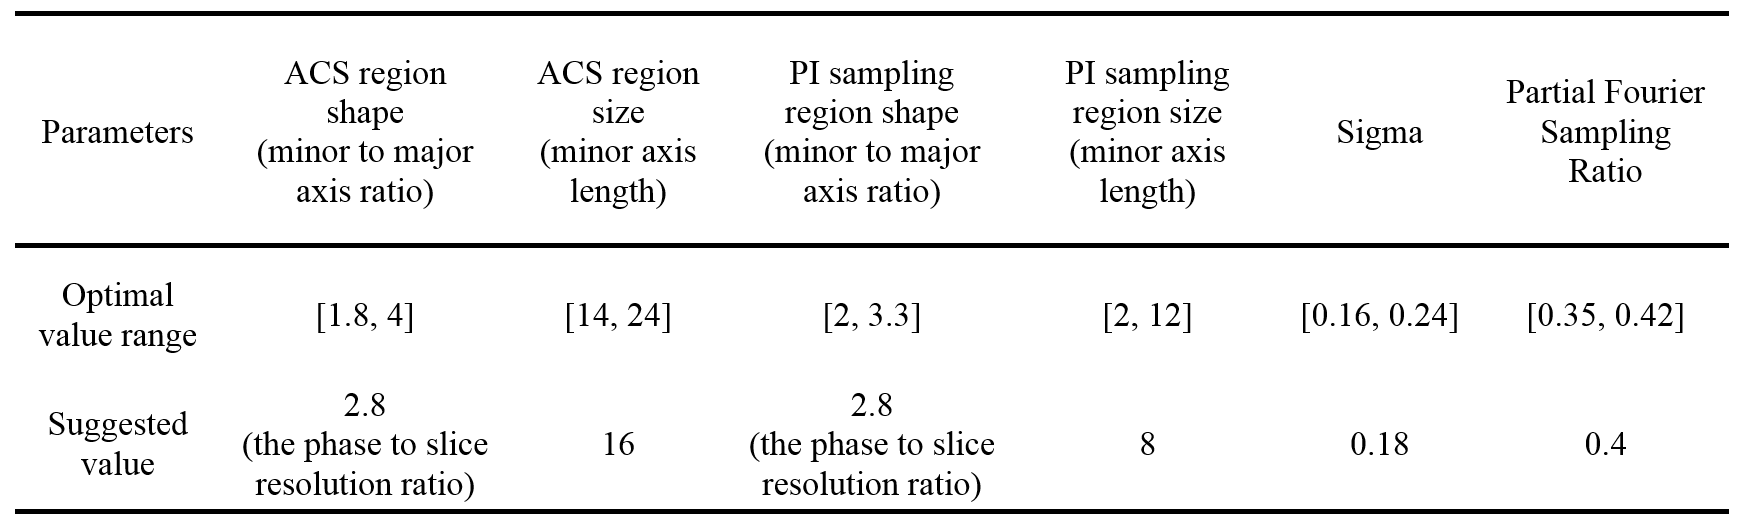
Fig. 3 shows two examples of the parameter optimisation process. The sigma optimisation (Fig.3(A, B)) demonstrates that NMSE, CC and sharpness all achieved the optimal values when sigma equals 0.18, indicating this is the optimal value for the CS sampling density in this study. The PF sampling ratio optimisation (Fig.3(C, D)) demonstrates that sharpness can generally be improved by using a larger PF sampling ratio. However, NMSE increases and CC decreases dramatically with increasing PF sampling ratio, especially for ratios larger than 0.4. One reason for this conflict may be that (for constant sample number) a larger PF sampling ratio allows more high-frequency components, increasing the sharpness but the corresponding reduction of central k-space sampling reduces the reconstruction accuracy. Taking both factors into account, the range from 0.35-0.42 was considered the optimal PF sampling ratio. Table 1 summarises all the optimal value ranges and suggested values for the parameters in sampling pattern design in this study.
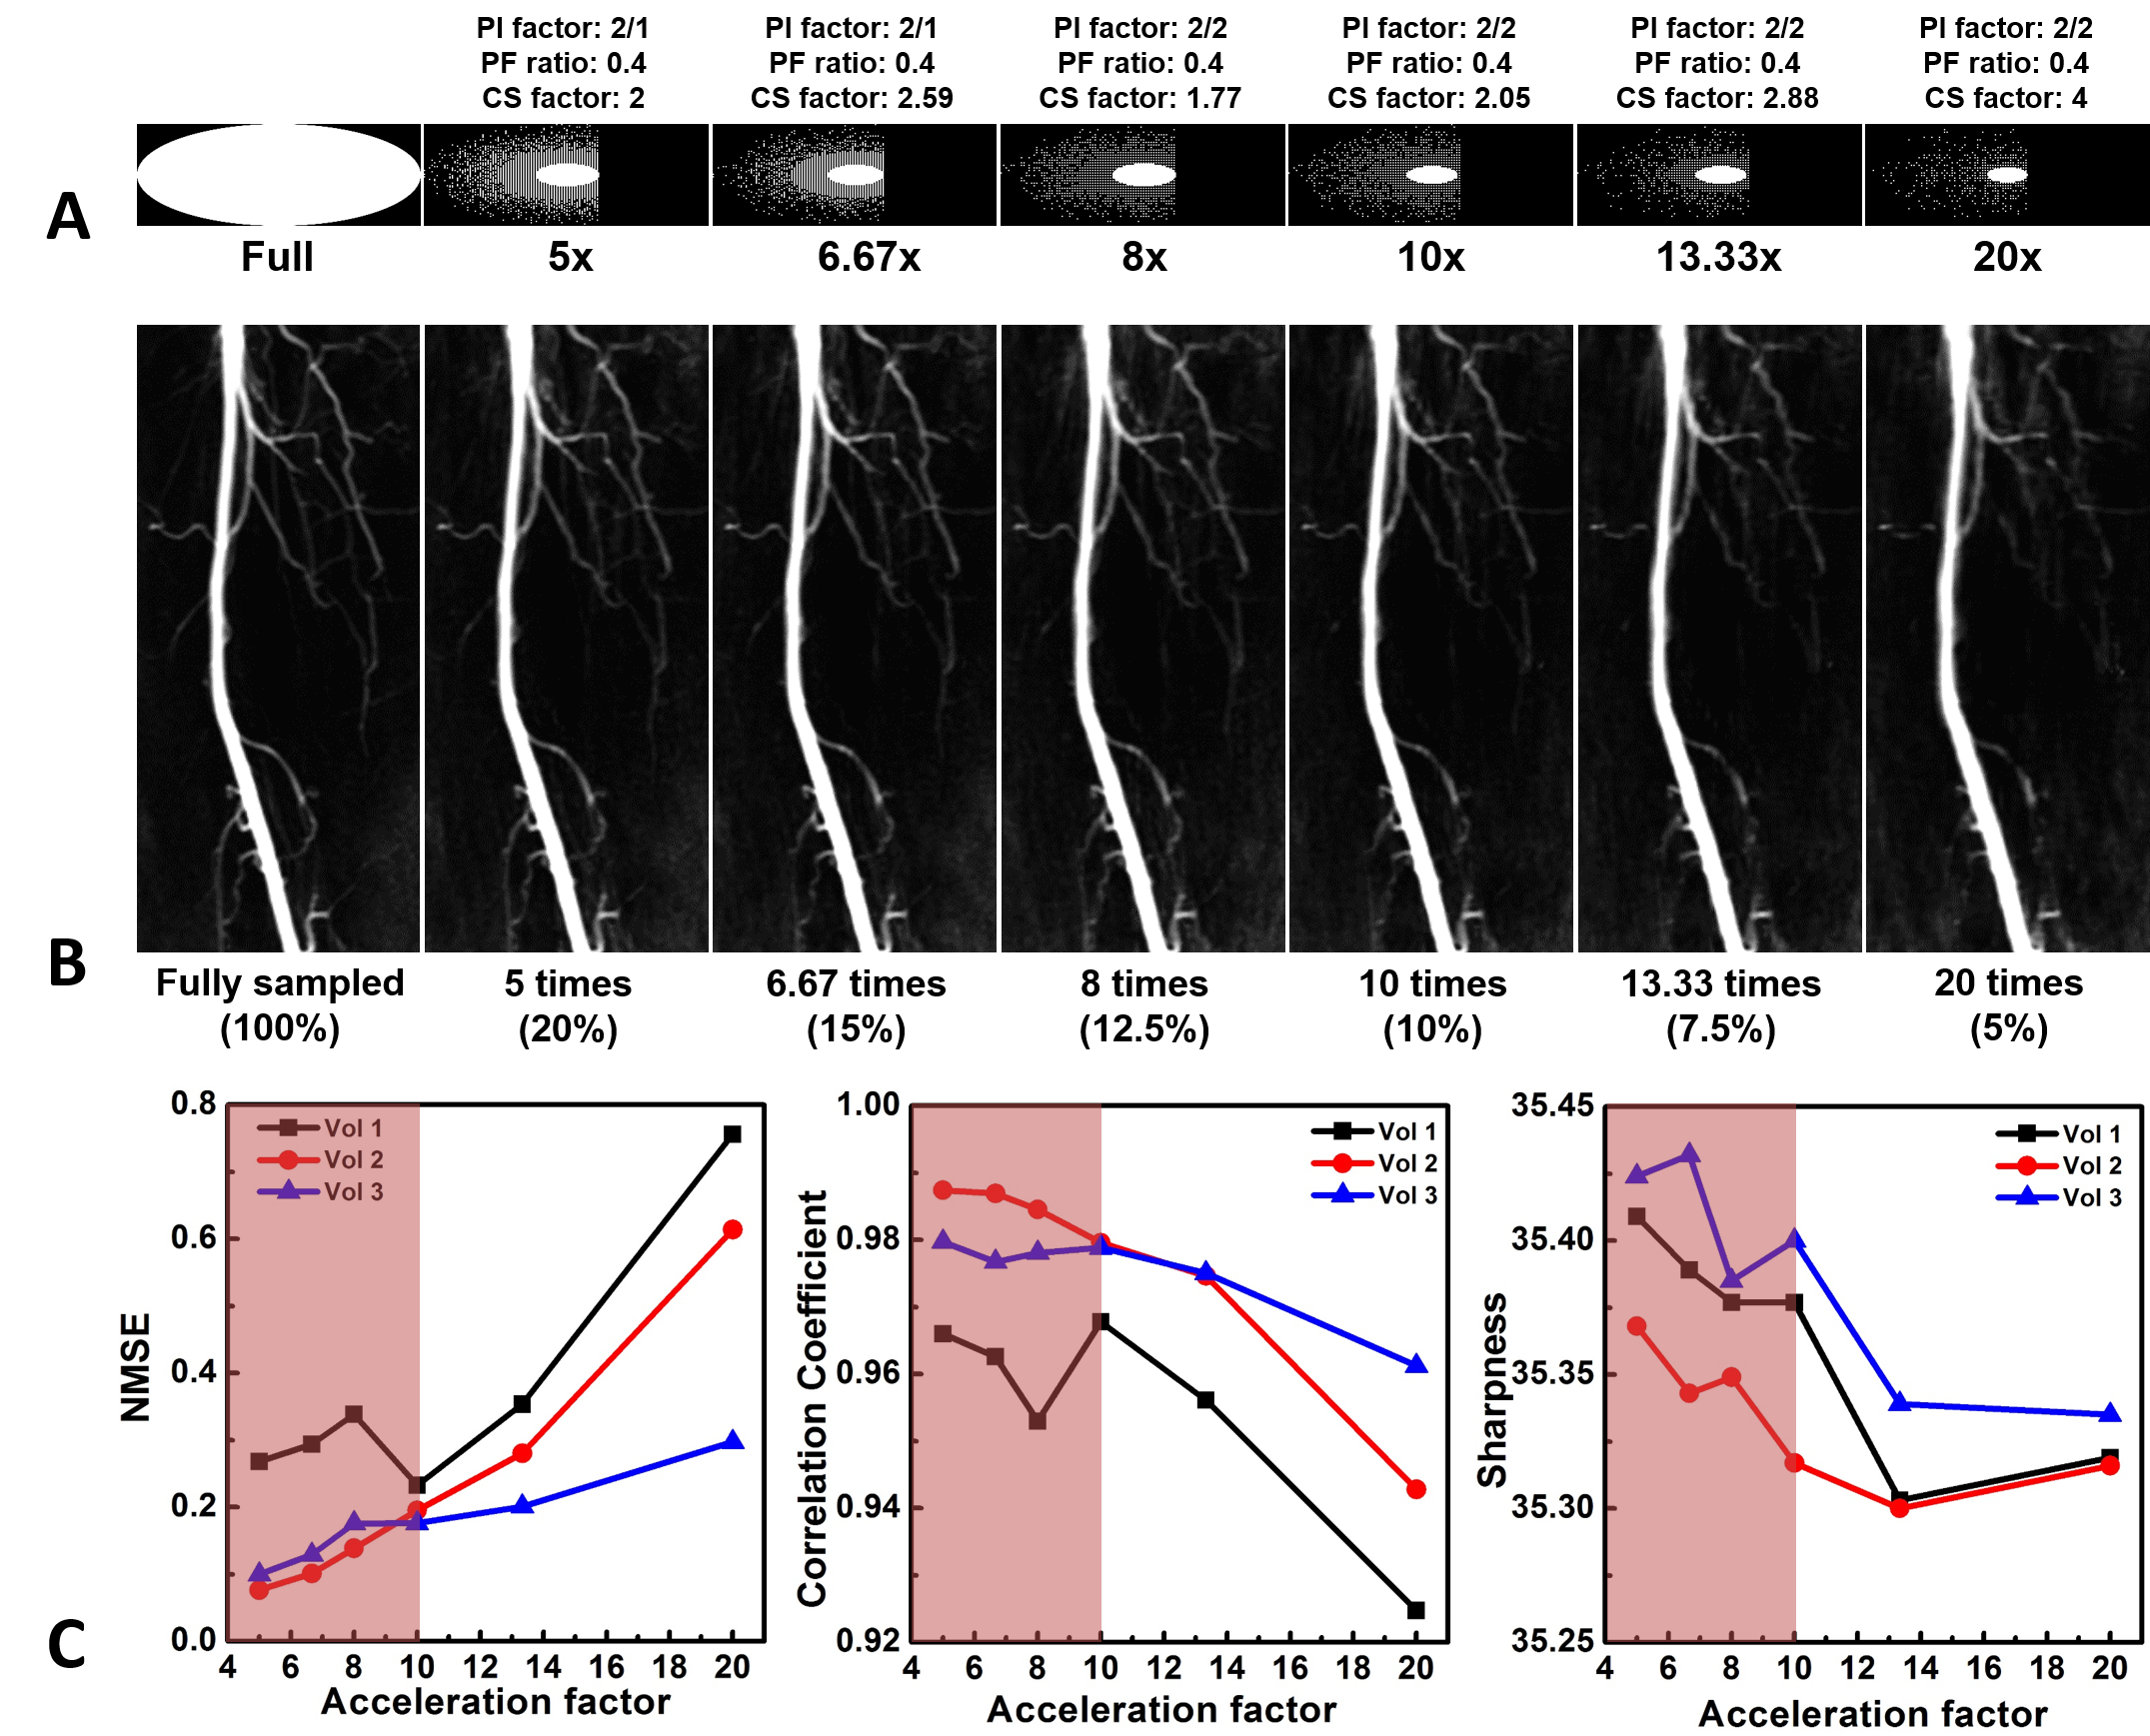
Sampling patterns with different overall acceleration factors can be designed using the optimal value ranges. We evaluated the performance of different sampling patterns with overall acceleration factors from 5 to 20 (Fig. 4(A)) on the data from three healthy volunteers. Fig. 4(B) shows a local region of right femoral arteries selected from the MIPs of one reconstructed image set with different overall acceleration factors. It can be observed that the image quality is similar to that of the fully sampled image when the acceleration factor is less than 10. When the factor is larger than 10, the MIP image demonstrates some edge blurring and loss of detail. This conclusion is consistent with the quantitative results shown in Fig. 4(C). The NMSE begins to increase and CC and sharpness begin to decrease rapidly when the overall acceleration factor is larger than 10. Therefore, it is suggested to choose an overall acceleration factor of less than 10.
Conclusion
An acceleration method combining CS, PI and PF was developed for the FBI lower limb NCE-MRA sequence used in this study. The parameters in sampling pattern design were optimised and the sampling patterns for different acceleration factors were determined. Further studies in volunteers and patients will be required to formally assess the diagnostic performance.Acknowledgements
No acknowledgement found.References
1. Lustig M, Donoho D, Pauly JM: Sparse MRI: The application of compressed sensing for rapid MR imaging. Magn Reson Med 2007; 58:1182–1195.
2. Miyazaki M, Sugiura S, Tateishi F, Wada H, Kassai Y, Abe H: Non-contrast-enhanced MR angiography using 3D ECG-synchronized half-Fourier fast spin echo. J Magn Reson Imaging 2000; 12:776–783.
3. Uecker, Martin, Frank Ong, Jonathan I. Tamir, Dara Bahri, Patrick Virtue, Joseph Y. Cheng, Tao Zhang and ML: Berkeley Advanced Reconstruction Toolbox. In Proc Intl Soc Mag Reson Med 2015. Volume 23; 2015:2486.
4. Uecker M, Lai P, Murphy MJ, et al.: ESPIRiT - An eigenvalue approach to autocalibrating parallel MRI: Where SENSE meets GRAPPA. Magn Reson Med 2014; 71:990–1001.
5. Ying L, Sheng J: Joint image reconstruction and sensitivity estimation in SENSE (JSENSE). Magn Reson Med 2007; 57:1196–1202.
6. Ahmad R, Ding Y, Simonetti OP: Edge sharpness assessment by parametric modeling: Application to magnetic resonance imaging. Concepts Magn Reson Part A 2015; 44:138–149.
Figures