2981
Automatic bullseye analysis of myocardial T1 values: a segmentation approach based on deep learning1Department of Electrical Engineering, National Taiwan University of Science and Technology, Taipei, Taiwan, 2Department of Radiology, Kao-Hsiung Veterans General Hospital, Kao-Hsiung, Taiwan
Synopsis
The study presents an automatic segmentation method for short-axis MOLLI data sets. We used a deep learning method based on convolutional neural network to accurately extract walls and blood pool regions of left and right ventricle. We compared the results with a layer-growing method presented in ISMRM 2017 and found that the accuracy of segmentation was significantly improved when using the deep learning method.
Purpose
Native T1 values of the myocardium are recently considered potential biomarkers of myocardial fibrosis. A reliable software package to extract heart regions and American Heart Association (AHA) segments from MOLLI T1 maps is highly desirable. We presented a fully automatic bullseye analysis on short-axis T1 maps in ISMRM 20171,2. In the present study, we improved the segmentation accuracy using a deep learning algorithm, to segment the heart regions of myocardial T1 maps automatically. We aim to enhance the reliability of the analysis and release it as an open software.
Materials and Methods
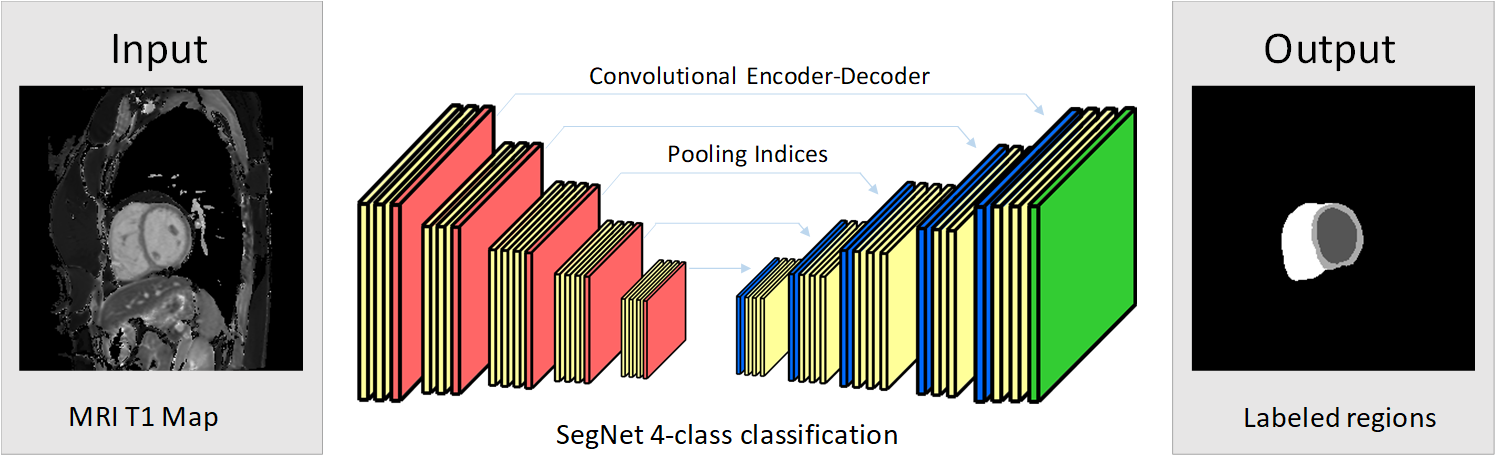
A total of 44 subjects (29 males and 15 females; age: 23.5 ±3.4 yr; TOF: 25, control: 19) participated in the study approved by the institution’s review board after providing informed consents. The study was performed on a 3.0T MRI system (Skyra, Siemens) in Kaohsiung Veterans General Hospital. We acquired modified Look-Locker inversion recovery (MOLLI) T1 images using the parameters (slices: mid-cavity and/or apical and/or basal, MOLLI acquisition scheme: 5(3)3, TR/TE: 295.26/1.12ms, matrix: 256×152). Totally 123 MOLLI data sets were analyzed in this study. We implemented SegNet3 (Figure 1) using the TensorFlow framework and the Python environment. The SegNet is a convolutional neural network consisted of 26 convolutional layers. The output layer is a 4-class soft-max classifier. The four classes were left ventricle walls (LVw), blood pool region (LVb), and right ventricle (RV) and background. The input images were the T1 maps reconstructed from MOLLI data sets and the output images consisted of manually labeled LVw, LVb, and RV regions. The data sets of subjects were split into two subsets, subset 1 (control: 15 and TOF: 8 subjects, 60 images) and subset 2 (control: 14 and TOF: 8 subjects, 63 images). The two subsets were used to train the SegNet and cross-validate the performance. The optimization of SegNet were 50,000 back-propagation iterations with 6 training images evaluated per iteration. For comparison, the dataset underwent the segmentation method, layer-growing, presented in ISMRM 2017 1,2. In short, the method consisted of a procedure to obtain a synthesized image with minimum blood signal and a layer-growing algorithm to generate an LVw mask. We evaluated the performance of SegNet and layer-growing by a dice coefficient [dice= (2(X∩Y))/(X+Y), X: a reference mask and Y: a mask generated by SegNet or layer-growing]. We used the obtained RV and LVw masks to identify the anterior and inferior boundaries of the septal walls and distributed LVw masks into the AHA segments.Results
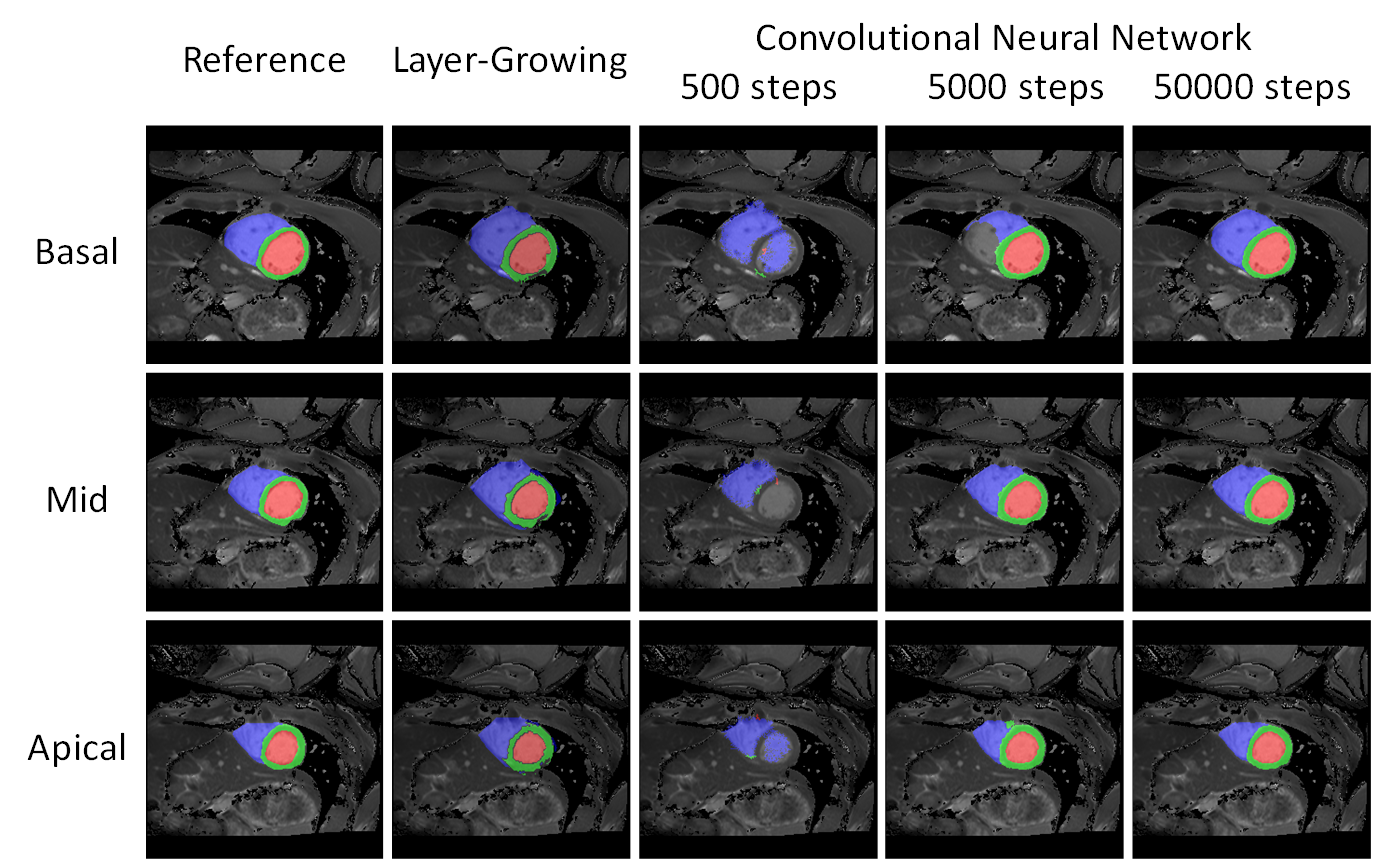
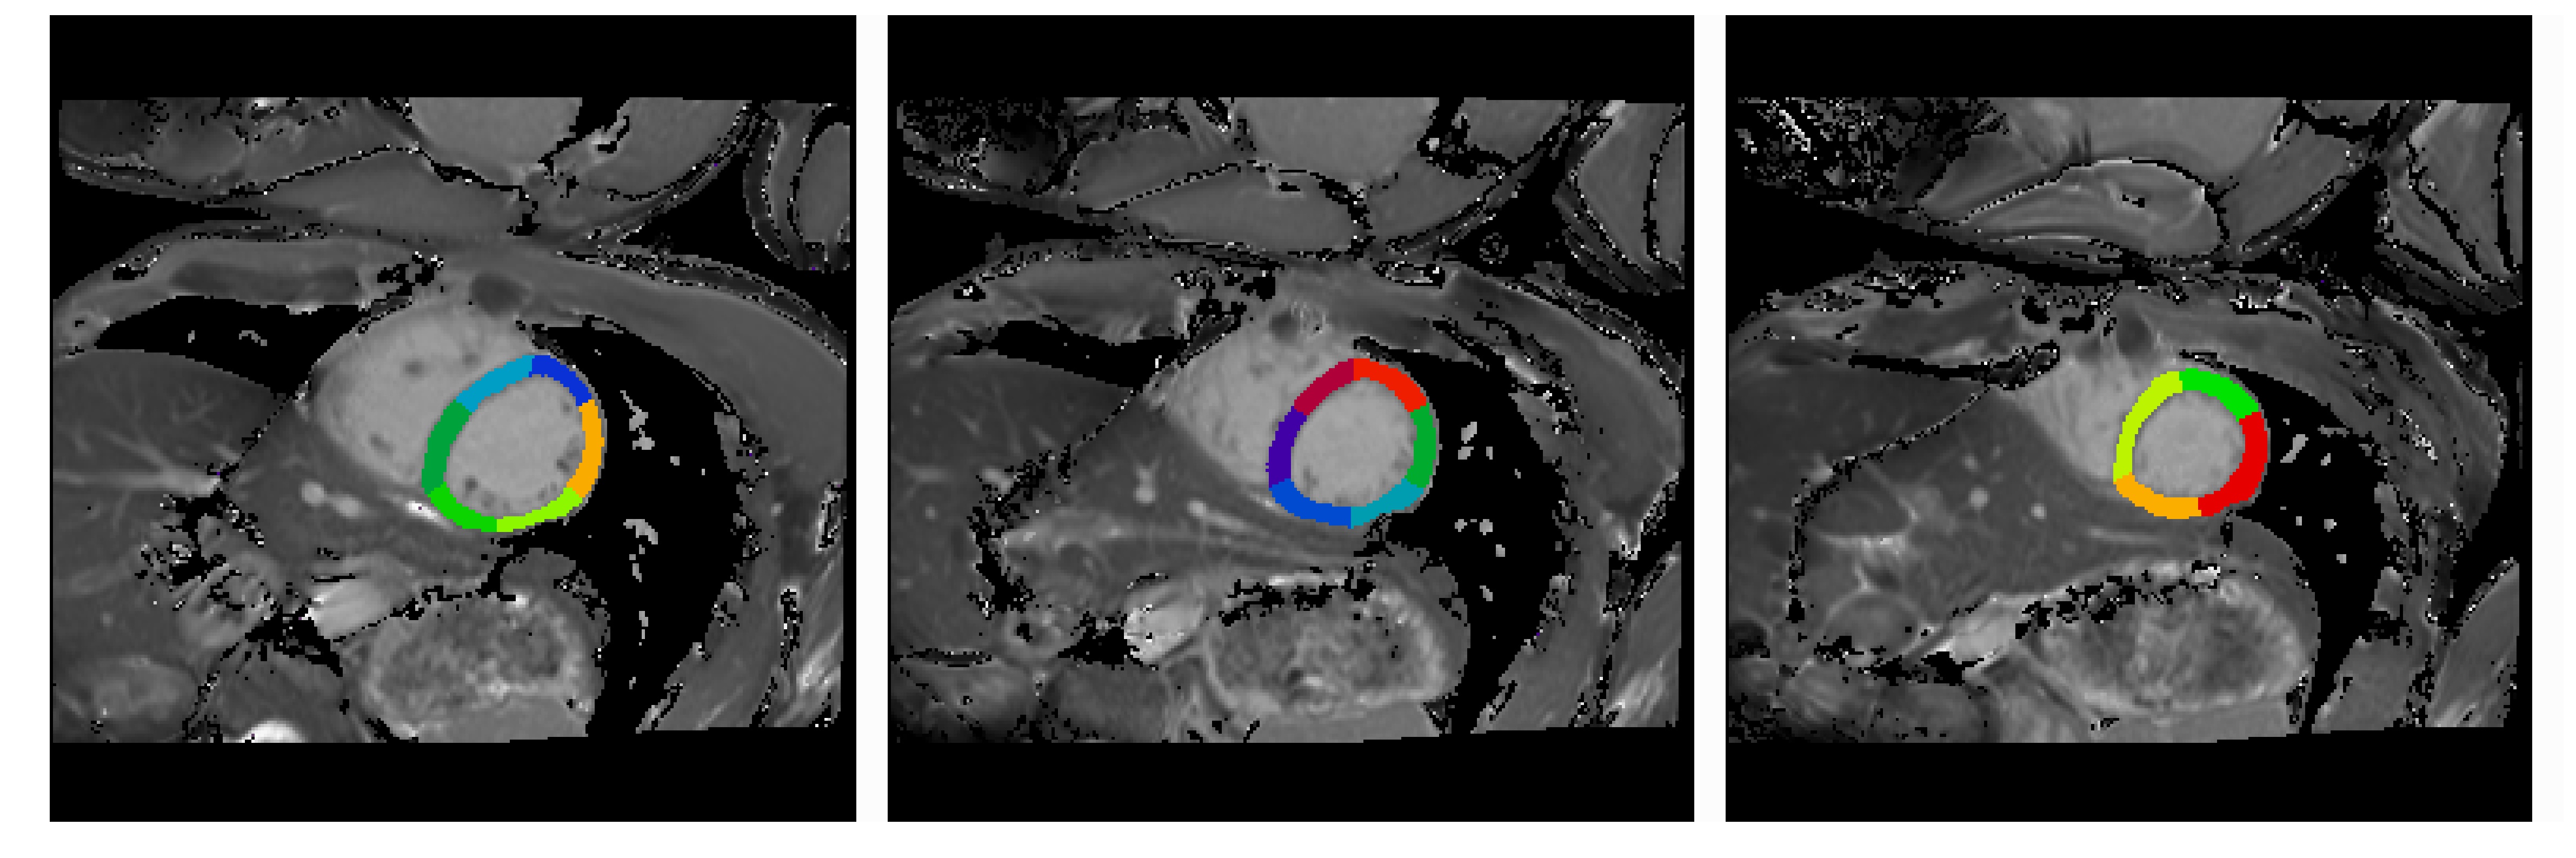
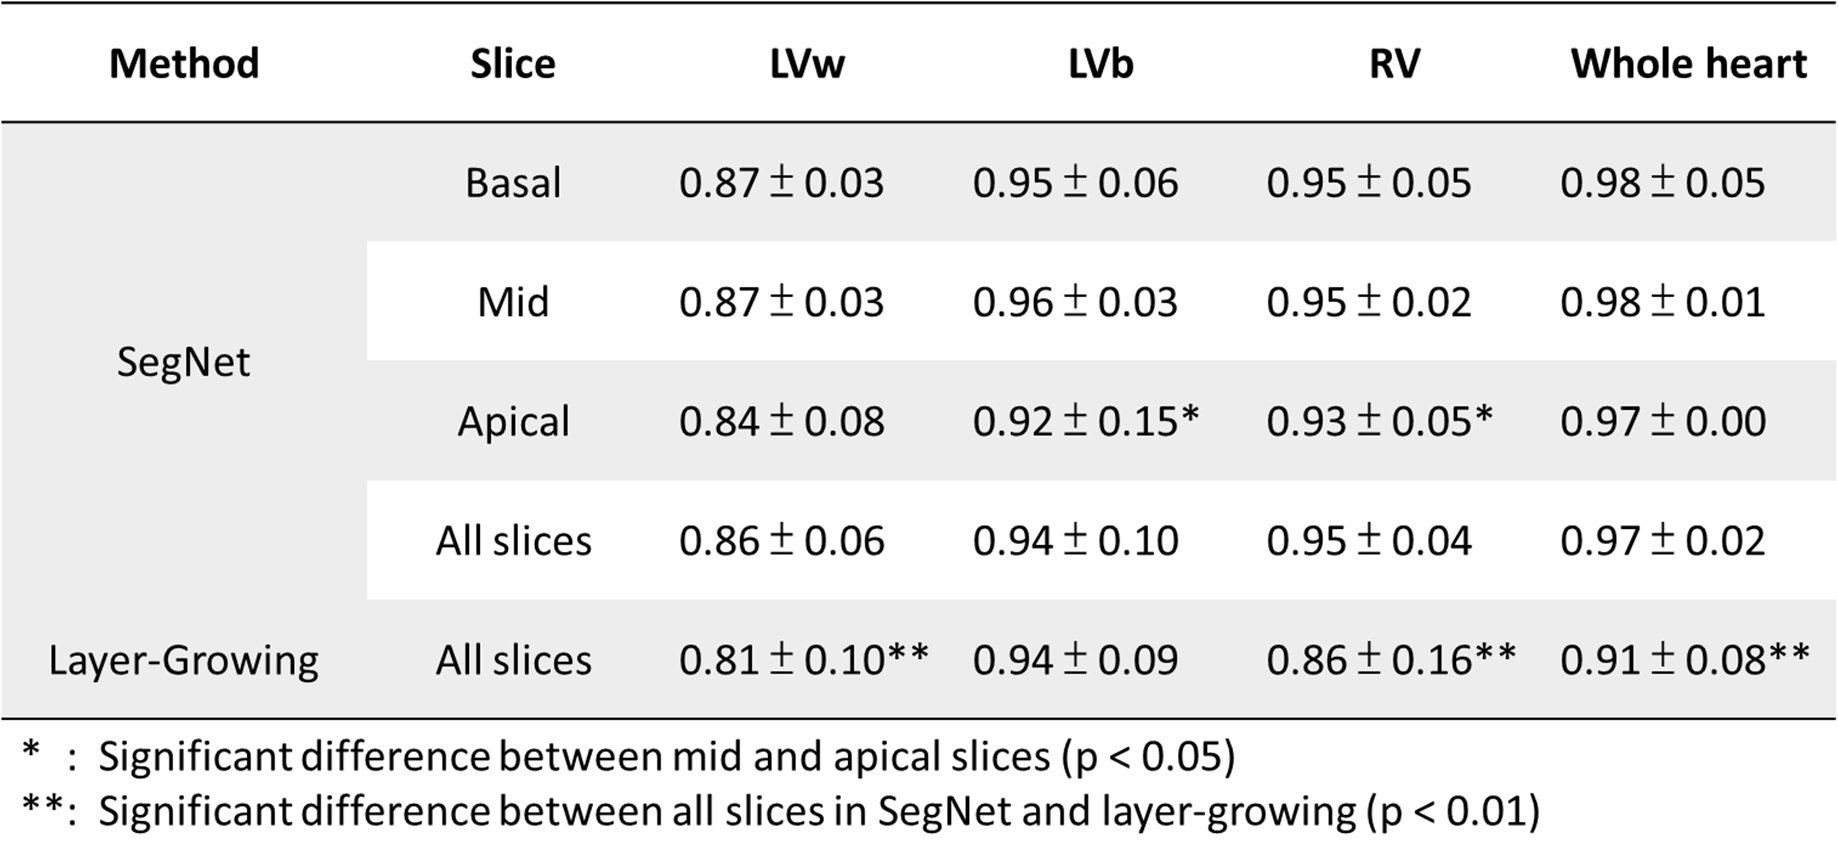
Figure 2 displays the segmented results of the three slices of a subject. The obtained masks (red: LVb, green: LVw, blue: RV) overlaying on T1 maps were generated by layer-growing and SegNet (500, 5000, 50000 iteration steps), respectively. Notice that SegNet with more iteration steps prominently improve the accuracy of the segmentation results. For this subject, the dice coefficients of the labeled heart regions (LVw, LVb, RV) were (0.89, 0.96, 0.95) and (0.80, 0.93, 0.83) for the optimized SegNet and layer-growing methods, respectively. Figure 3 shows the obtained AHA segments of this subject. Table 1 lists the averaged dice coefficients. In comparison to layer-growing, the SegNet method significantly improved the segmentation accuracy in LVw and RV (p < 0.01, paired t-test). In addition, the dice coefficients were lower in apical slices processed by the SegNet method.Discussions and Conclusion
In our previous study, we implemented a fully automatic bullseye analysis for native T1 values of the myocardium. Accurate segmentation results allow reliable analysis of regional T1 values. In this study, we used the recently emerging deep learning for the segmentation task. The results supported that SegNet outperformed the layer-growing method. The average dice coefficient of whole heart was approximately 0.97. The results support the trained SegNet could be a robust tool for whole-heart extraction. We aim to release this tool since it could be as useful as the brain extraction tool (BET) provided by FSL (FMRIB Software Library, the Analysis Group, FMRIB, Oxford, UK.). The major restriction of this study was that the training and validation data sets were limited to control and TOF subjects. Increasing the variety of the training data sets of SegNet could lead to more accurate segmentation and widen the clinical applications. In conclusion, the SegNet method increasing the accuracy of segmentation could improve the reliability and consistency of clinical applications of myocardial T1 values.Acknowledgements
Supported by the Ministry of Science and Technology under grants 104-2314-B-011-001-MY3References
1. Yun-Wen Wang, Chiao-Ning Chen, Teng-Yi Huang, and Ming-Ting Wu “Fully automatic myocardial ECV mapping: deformable image registration, LV segmentation and a cloud computing pipeline” ISMRM 2017, 22-27 April (#4762)
2. Yun-Wen Wang, Chun-Yu Huang, Hsiao-Hui Huang, and Teng-Yi Huang “Fully automatic bullseye analysis on short-axis MOLLI mapping: LV segmentation and AHA 17 parcellation” ISMRM 2017, 22-27 April (#4761)
3. Vijay Badrinarayanan, Alex Kendall, Roberto Chipolla, "SegNet: A Deep Convolutional En-coder-Decoder Architecture for Scene Segmentation", IEEE Transactions on Pattern Analysis and Machine Intelligence, Jan 2017.
Figures