2980
Quantitative Classification of Atherosclerotic Plaque Compositions in Carotid Arteries: An in vivo T1 Mapping StudyHuiyu Qiao1, Haikun Qi1, Dongye Li1,2, Dongxiang Xu3, Huijun Chen1, Chun Yuan1,3, and Xihai Zhao1
1Center for Biomedical Imaging Research, Department of Biomedical Engineering, Tsinghua University, Beijing, China, 2Center for Brain Disorders Research, Capital Medical University, Beijing, China, 3Department of Radiology, University of Washington, Seattle, WA, United States
Synopsis
This study sought to investigate the usefulness of in vivo T1 mapping in quantitative classification of compositions and vulnerability of carotid artery atherosclerotic plaques. We found that it is feasible to quantify the T1 values of atherosclerotic plaque compositions in carotid artery with in vivo T1 mapping. Significant differences in T1 values between fibrous tissue and other plaque compositions indicate that it is possible to classify plaque compositional features using T1 mapping. In addition, our findings of IPH and LRNC with significant different T1 values from other plaque compositions suggest the potential of T1 mapping in classification of plaque vulnerability.
Introduction
Vulnerability of carotid artery atherosclerotic plaques is associated with ischemic stroke. Histologically, vulnerable plaques are characterized by presence of intraplaque hemorrhage (IPH), large lipid-rich necrotic core (LRNC) or fibrous cap rupture.1,2 Therefore, it is important to characterize carotid vulnerable plaques prior to occurrence of cerebrovascular events. Currently, MR multi-contrast vessel wall imaging has been demonstrated to be an ideal non-invasive modality to identify plaque compositions.3 However, this technique is time consuming and its quantitative analysis is heavily dependent on reviewer’s experience. Recently, T1 mapping has been utilized in tissue quantification in ex-vivo intracranial atherosclerotic plaques.4,5 However, the capability of T1 mapping in classification of carotid plaque vulnerability is unknown. This study sought to investigate the usefulness of in vivo T1 mapping in assessing compositions and vulnerability of carotid artery atherosclerotic plaques.Methods
Study sample: Forty-five carotid atherosclerotic plaques from 24 symptomatic subjects (mean age, 65.0 ± 7.8 years; 20 males) were recruited and underwent MR imaging. The study protocol was approved by institutional review board and the written consent form was obtained from each patient. MR Imaging: All carotid arteries were imaged on 3.0T MR scanner (Achieva TX, Philips Healthcare) with a custom-designed 36-channel cerebrovascular coil or an 8-channel carotid coil. Multi-contrast MR vessel wall imaging and GOAL-SNAP6 imaging were performed with the parameters in Table 1. The GOAL-SNAP image series along the IR curve were reconstructed using sliding window and KWIC method7, similar to the previous study.6 Then, T1 map can be estimated from the IR image series.6 Image Analysis: Reconstructed GOAL-SNAP images were reformatted to 2mm axial slice with the same geometry to T1-QIR for analysis. All MR images were reviewed by two radiologists with >5 years’ experience in cardiovascular MR imaging using “CASCADE” (UW, Seattle, USA). The boundaries of lumen, outer wall and plaque components were outlined on each slice. All outlined regions of each slice were exported to a mask in which lumen, fibrous tissue, LRNC, calcification, IPH and loose matrix were labeled as different values. T1 fitting was performed on the marked regions and mean T1 values of different regions were calculated for each slice. Statistical Analysis: The T1 values of all plaque components were compared using One Way ANOVA test.Results
Of 586 slices with acceptable image quality from 24 subjects, 302 (51.5%) had LRNC, 134 (22.9%) had calcification, 136 (23.2%) had IPH, and 145 (24.7%) had loose matrix. The T1 values for fibrous tissue and all plaque components are detailed in Figure 1. Among all components, IPH showed the shortest T1 value (958.5 ± 394.3 ms) and the loose matrix had the longest T1 value (1508.7 ± 455.1 ms) (all p<0.001). The T1 value of LRNC (p=0.038) and calcification (p=0.037) was significantly longer than that of fibrous tissue. No significant difference in T1 value was found between LRNC and calcification (p=0.440). Typical carotid atherosclerotic plaque images of multi-contrast vessel wall and T1 mapping are shown in Figure 2 and 3.Discussion and Conclusion
It is feasible to quantify the T1 values of atherosclerotic plaque compositions in carotid artery in vivo with MR imaging. The significant differences in T1 values between fibrous tissue and all plaque compositions indicate that it might be possible to classify plaque compositional features using T1 mapping. In addition, our findings of IPH and LRNC with significant different T1 values from other plaque compositions suggest the potential of T1 mapping in characterizing carotid plaque vulnerability. In the present study, the overlap of T1 values between LRNC and calcification might be due to the partial volume effects, complexity of microstructure of LRNC and calcification, and susceptibility. Histological validation of capability of T1 mapping in identification of plaque compositions is warranted in future studies.Acknowledgements
This study is supported by a grant of National Natural Science Foundation of China (81771825).References
- Zavodni AE, Wasserman BA, McClelland RL, et al. Carotid artery plaque morphology and composition in relation to incident cardiovascular events: the Multi-Ethnic Study of Atherosclerosis (MESA). Radiology. 2014;271:381-389.
- Saam T, Hetterich H, Hoffmann V, et al. Meta-analysis and systematic review of the predictive value of carotid plaque hemorrhage on cerebrovascular events by magnetic resonance imaging. J Am Coll Cardiol. 2013;62:1081-1091.
- Cai JM, Hatsukami TS, Ferguson MS, et al. Classification of human carotid atherosclerotic lesions with in vivo multicontrast magnetic resonance imaging. Circulation 2002;106:1368-1373.
- Jiang Y, Zhu C, Peng W, et al. Ex-vivo imaging and plaque type classification of intracranial atherosclerotic plaque using high resolution MRI. Atherosclerosis. 2016;249:10-16.
- Harteveld AA, Denswil NP, Siero JC. Quantitative Intracranial Atherosclerotic Plaque Characterization at 7T MRI: An Ex Vivo Study with Histologic Validation. AJNR Am J Neuroradiol. 2016;37:802-810.
- Qi H, Sun J, Qiao H, et al. Carotid Intraplaque Hemorrhage Imaging with Quantitative Vessel Wall T1 Mapping: Technical Development and Initial Experience. Radiology 2017. In Press.
- Neumann D, Breuer FA, Völker M, et al. Reducing contrast contamination in radial turbo-spin-echo acquisitions by combining a narrow-band KWIC fi lter with parallel imaging. Magn Reson Med 2014;72:1680-1686.
Figures
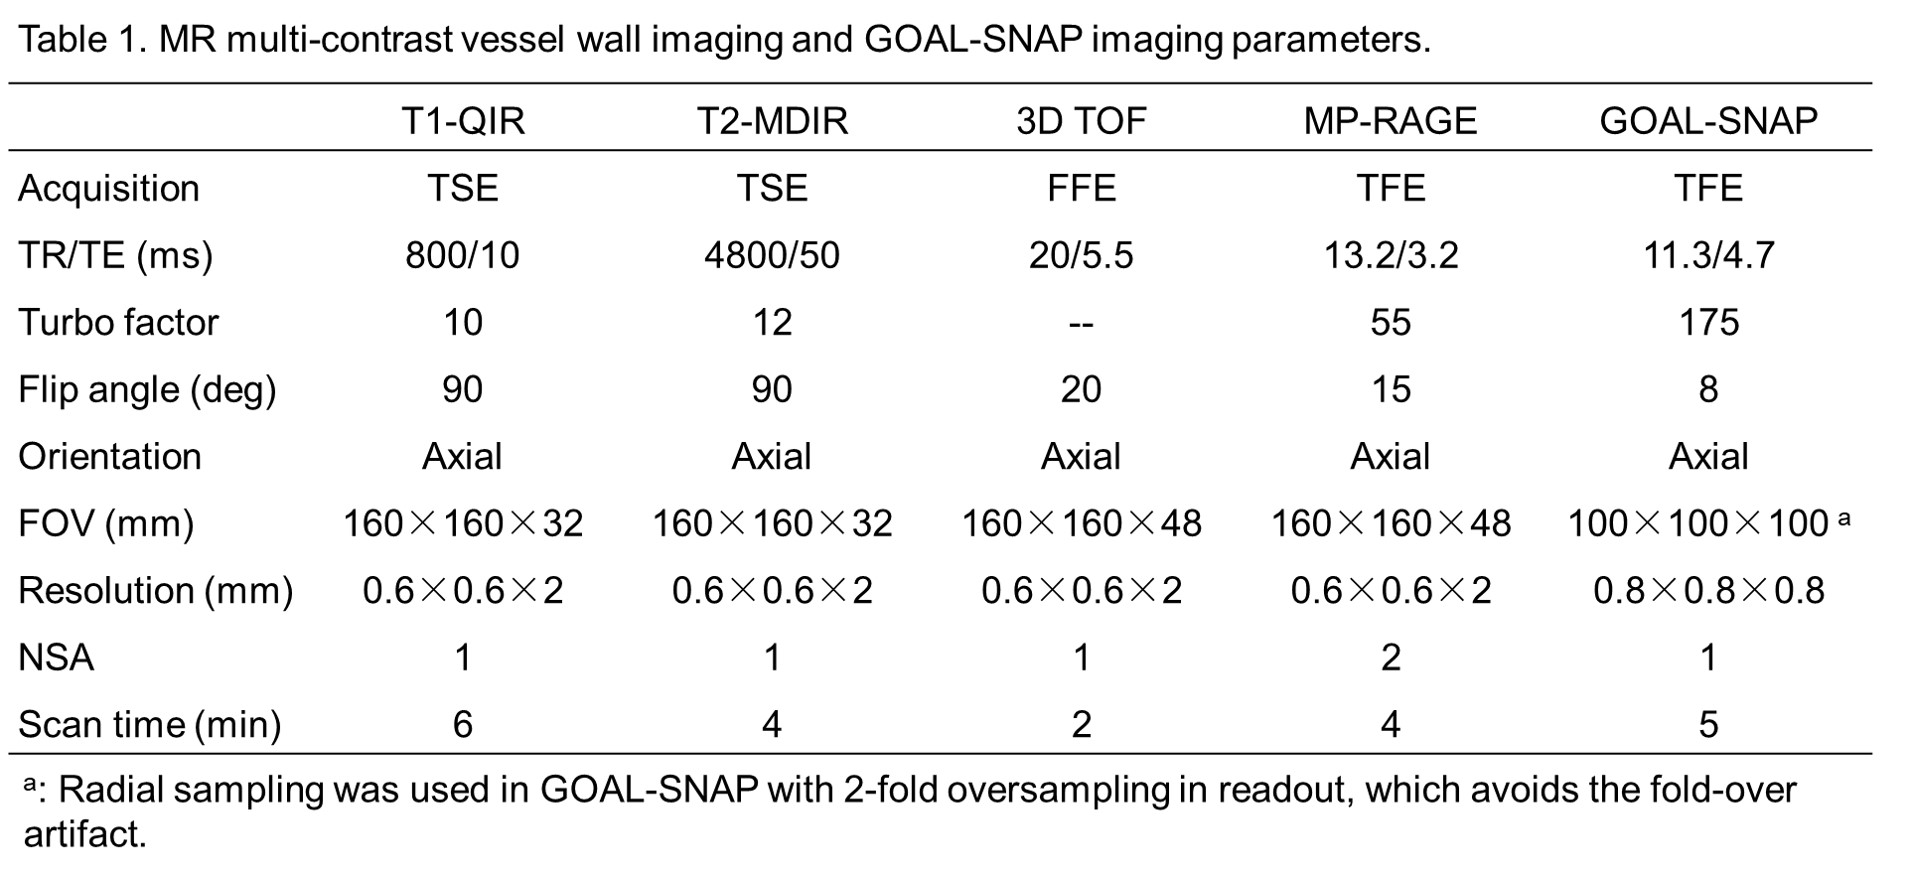
Table 1. MR imaging
parameters.
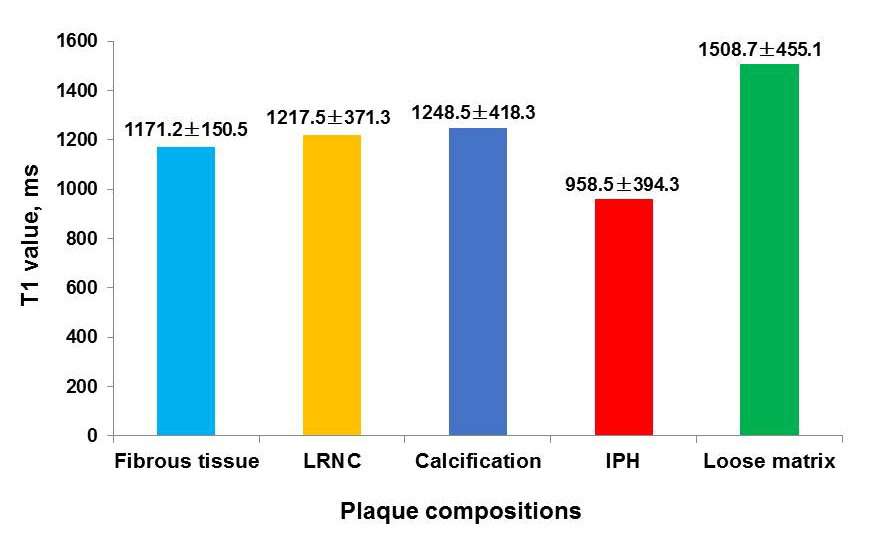
Figure 1. Mean T1
values of fibrous tissue and plaque compositions in carotid arteries.
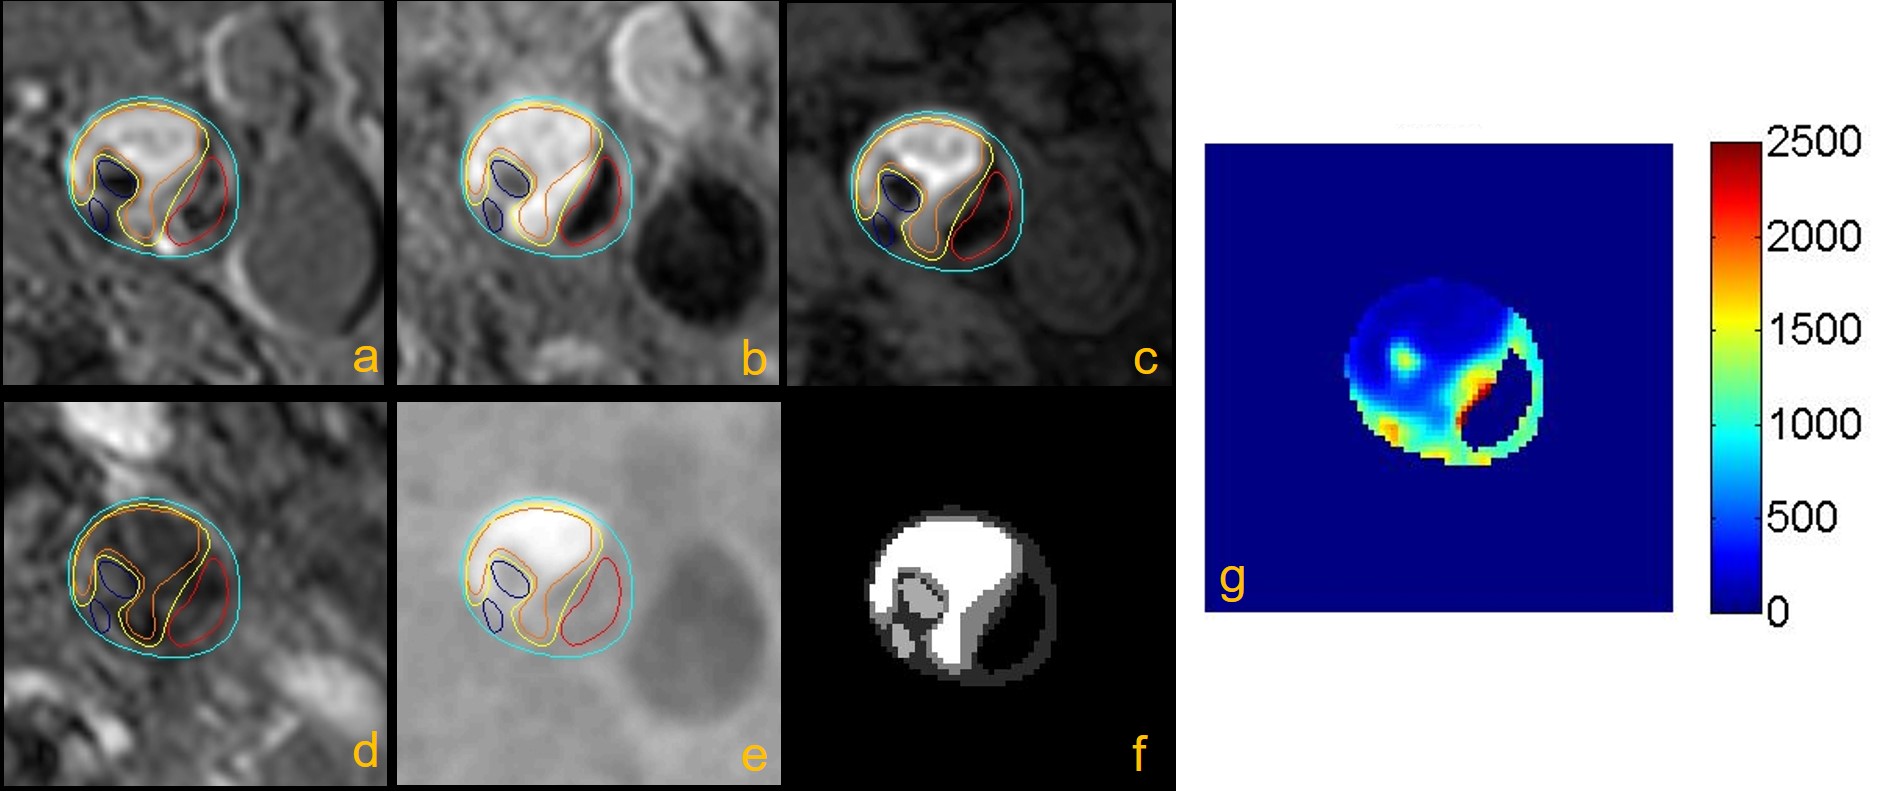
Figure 2. Multi-contrast
MR vessel wall and GOAL-SNAP images of carotid plaque with IPH and
calcification. a-e were TOF, T1-QIR, T2-MDIR, MP-RAGE, and reconstructed
GOAL-SNAP images; f was the mask of carotid lumen, wall and plaque components;
g was the T1 mapping calculated by GOAL-SNAP. IPH (orange boundary) showed a
reduced T1 compared with calcification (dark blue boundary) and fibrous tissue.
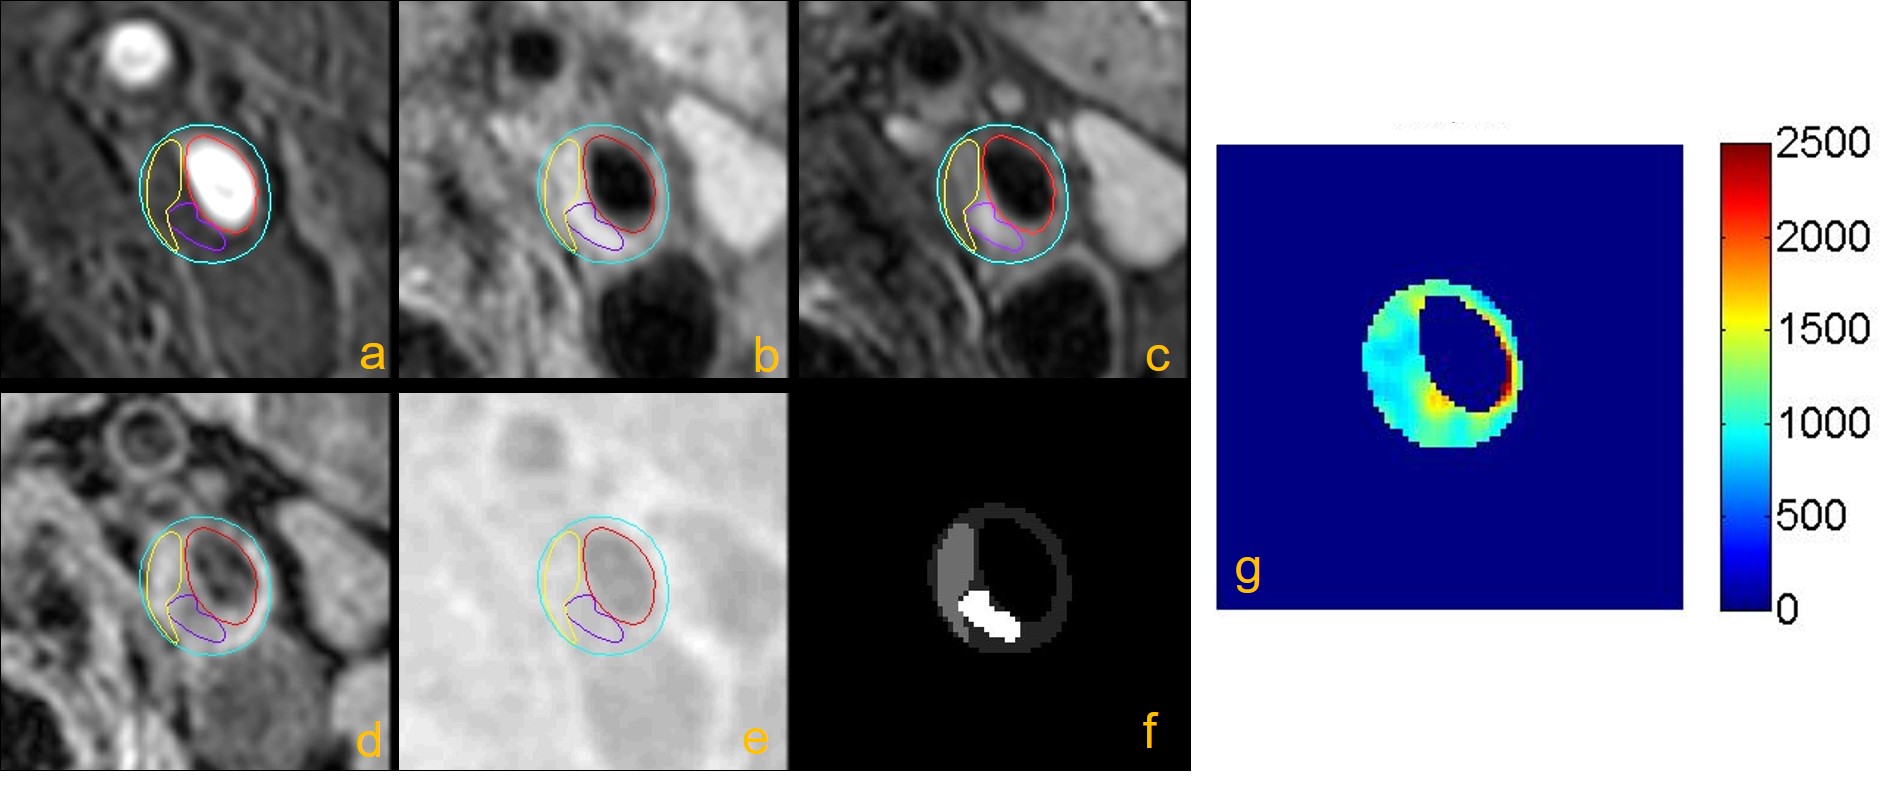
Figure 3. Multi-contrast
MR vessel wall and GOAL-SNAP images of carotid plaque with LRNC and loose matrix.
a-e were TOF, T1-QIR, T2-MDIR, MP-RAGE, and reconstructed GOAL-SNAP images; f was
the mask of carotid lumen, wall and plaque components; g was the T1 mapping
calculated by GOAL-SNAP. The T1 value of LRNC (yellow boundary) was shorter
than that of loose matrix (purple boundary).