2978
Estimation of aortic valve effective orifice area: a same day comparison between Doppler echocardiography and 4D flow MRI1Department of Radiology, Northwestern University, Chicago, IL, United States, 2Department of Cardiology, Feinberg Medical School, Chicago, IL, United States, 3Department of Biomedical Engineering, Northwestern University, Chicago, IL, United States
Synopsis
The purpose of this study was to compare the aortic valve effective orifice area (EOA) estimated between Doppler echocardiography and 4D flow MRI using a consecutive same-day study design to minimize inter-modality variability. Peak velocity and left ventricular outflow tract area were higher for MRI but velocity time integral was higher for echo. These differences were compensatory when computing EOA, which resulted in good agreement despite discrepancies in echo vs MRI. Volumetric 3D velocity information has the potential to better estimate EOA in the presence of eccentric jets. This potential strength will be studied in aortic stenosis patients.
INTRODUCTION
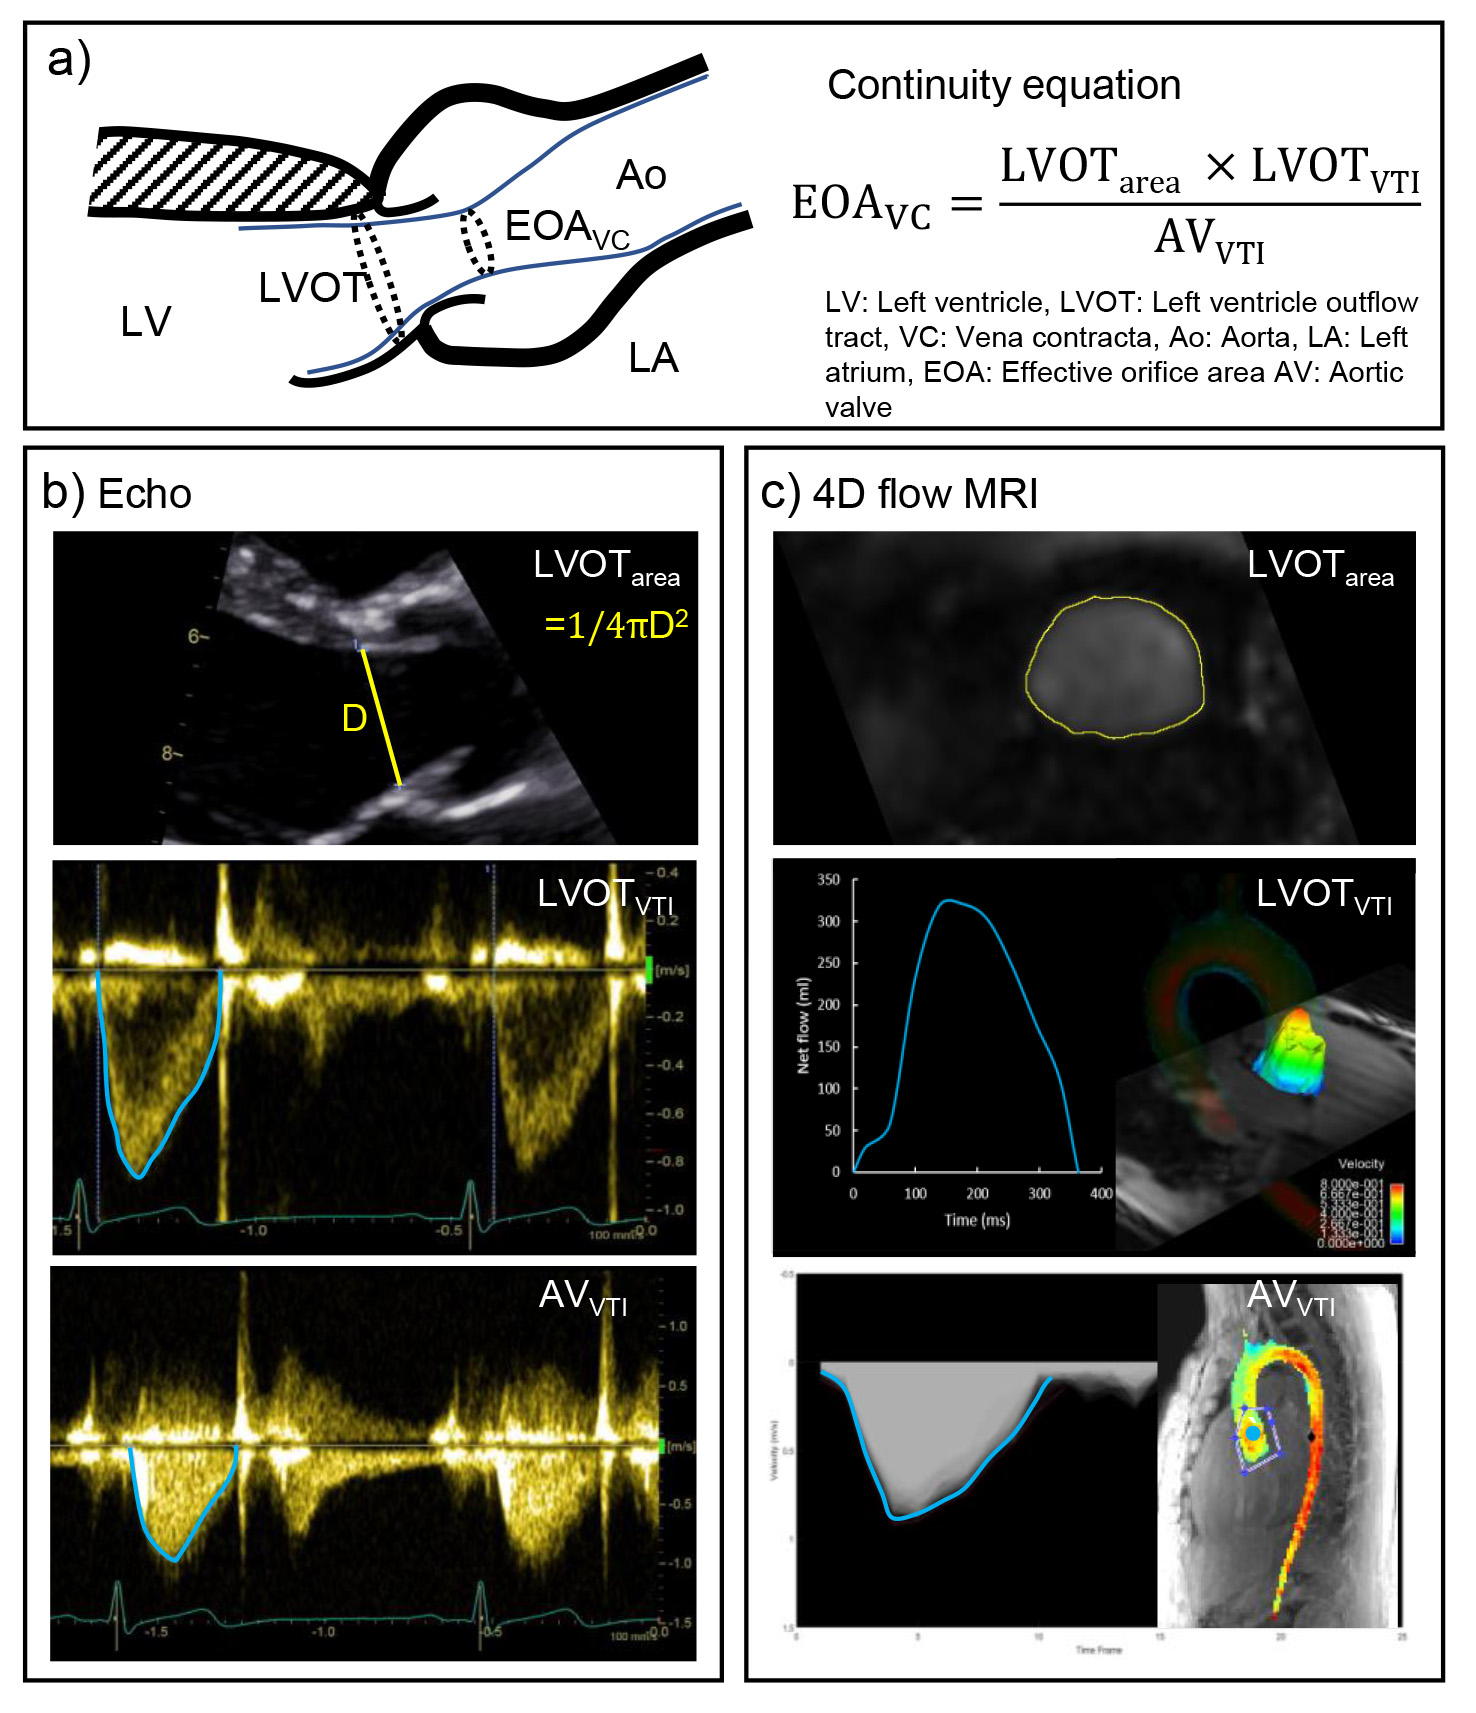
Aortic valve stenosis (AS) has severe consequences, including development of heart failure and aortopathy. Aortic valve stenosis severity is quantified by a number of parameters, including geometric valve orifice area, peak transvalvular velocity, pressure drop, and the aortic valve effective orifice area (EOA). EOA is the smallest area of a transvalvular jet in which the velocity is at a maximum, otherwise known as the jet vena contracta (VC). Current guidelines1,2 define severe stenosis as an EOA<1.0cm2. Doppler-echocardiography typically measures EOA by applying the continuity equation as stroke volume through the left ventricular outflow tract (LVOT) divided by the time integral of maximal velocity through the AV (AVVTI) (Figure1a). However, peak velocities may be underestimated due to Doppler beamline misalignment with the flow direction. Additionally, it is assumed that the shape of the LVOT is circular (when computing area, LVOTarea) and that the velocity profile across the LVOT is flat. These assumptions can lead to both over-and underestimation of EOA, but prior studies have suggested that on average, these potential errors often cancel out, resulting in similar EOA values when compared with MRI3. However, eccentric flow jets and distorted LVOT geometries may disturb this balance and significantly over or underestimate the EOA4. The purpose of this study was to investigate the validity of these assumptions when estimating EOA while minimizing inter-modality variability by performing echocardiography and MRI on the same day.METHODS
Doppler echocardiography and 4D flow MRI were obtained in 15 healthy volunteers (age: 38.2±14.98, 8 males) with a time gap between echo and MRI of 3.97±1.89hr [0.5, 6hr]. Echocardiography was performed with a GE Vivid E95 echo machine with R2 software (GE Medical Systems, USA). The LVOT diameter and midline velocity were measured by pulsed-wave Doppler; aortic transvalvular jet velocity was measured by continuous-wave Doppler following guidelines5 (Figure1b). A prospective ECG and respiratory gated 4D flow MRI scan was performed at 1.5T on a MAGNETOM AERA scanner (Siemens, Germany) using the following parameters: TR/TE/FA=4.75-4.87ms/2.4ms/7°, spatial resolution=3.3-3.9x2.2-2.7x2.4-2.8mm3, temporal resolution=38.4ms and velocity-encoding=150cm/s. The LVOTarea was measured from a 3D PC-MRA computed at peak systole6. LVOTVTI was calculated by integrating the mean velocity through the LVOT over time. AVVTI was calculated by integrating the peak velocity of the jet over 3-D volume and time, assuming velocity profile is flat (Figure1c).RESULTS
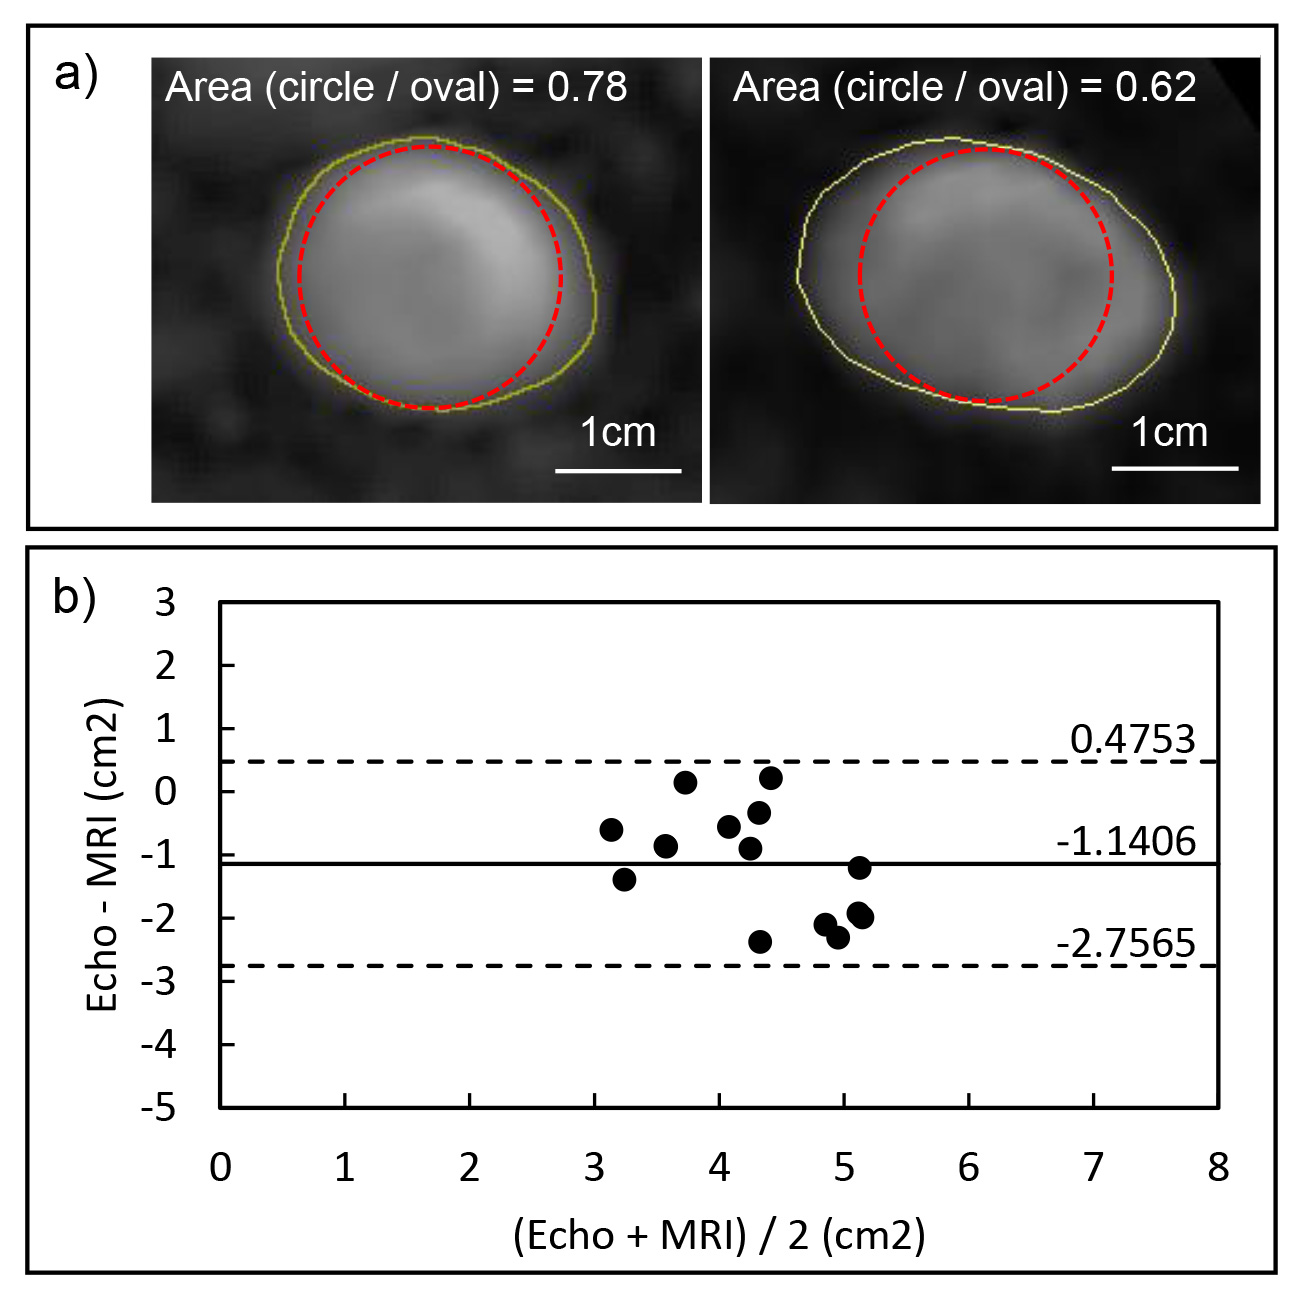
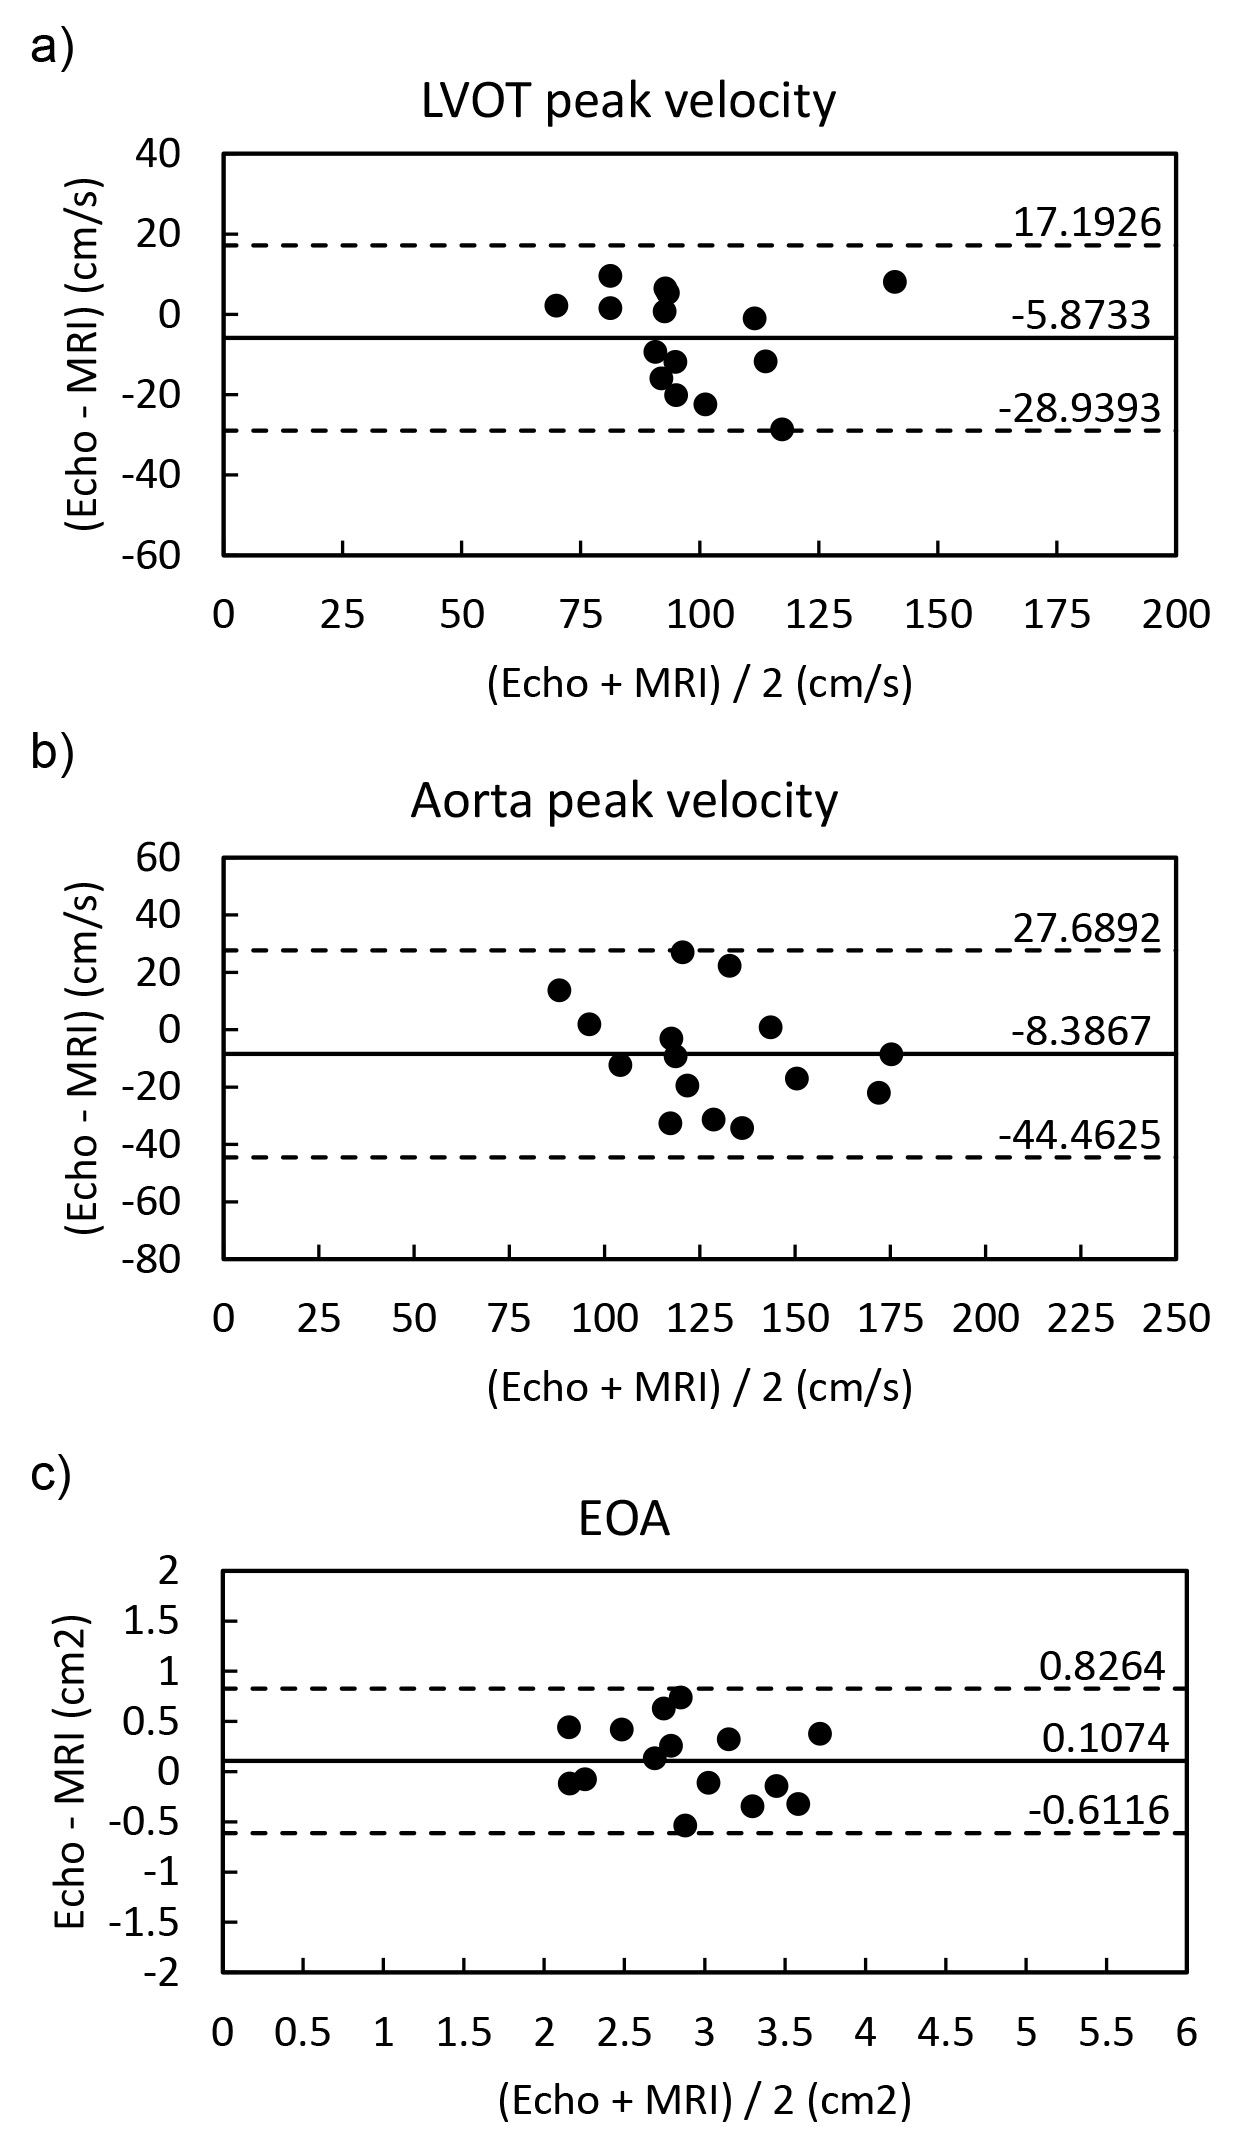
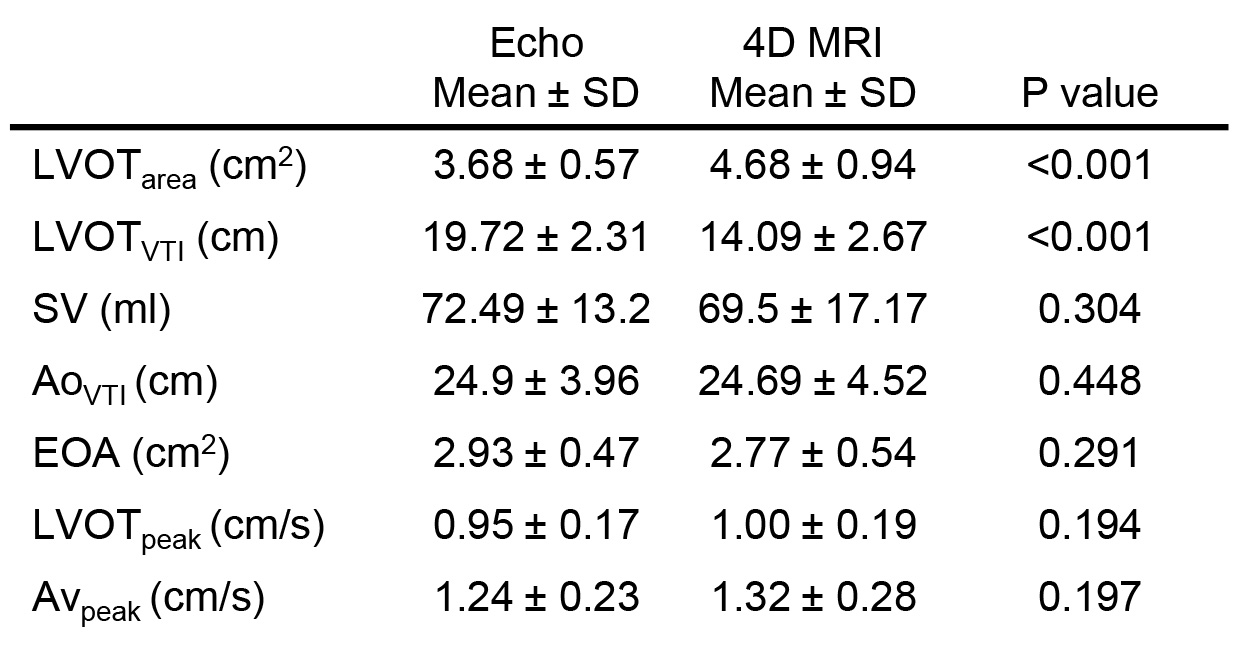
The LVOTarea measured by Doppler echocardiography was 22% smaller on average than 4D flow MRI (bias[limits of agreements]: -1.44[-2.76:0.48]cm2, p<0.001). Most echo cases (13/15) measured the diameter closer to the short axis (anterior-posterior) of the known oval shape of the LVOT (Figure2). The LVOTVTI calculated by echo was 26% larger by average than that calculated by MRI (5.63[1.66:9.61]cm, p<0.001). All echo cases showed higher LVOTVTI than 4D flow MRI (Figure3). Stroke volume (SV) and AVVTI calculated by echo and MRI were similar (p=0.304 and 0.448, respectively). LVOTpeak and AVpeak velocity measured by echo was smaller than that measured by MRI (-5.87[-28.94:17.19]cm/s and -8.39[-44.46:27.68]cm/s, respectively) (Figure4a,b). EOA calculated by echo was similar with MRI (0.101[-0.61:0.83]cm2, p=0.291) (Figure4c). Results are summarized in table.1.DISCUSSION
This same-day echo-MRI study confirms that error from simplifying assumptions are often canceled out when computing EOA, while spatial alignment and fixed measurement planes may further cause bias in EOA. As previously reported, underestimation of LVOTarea by assuming a circular cross-section is counterbalanced by overestimation of the mean LVOT velocity when assuming a flat velocity profile. Bias in peak velocity measurements between echo and MRI indicates that the peak velocity is not located in the center but somewhat skewed, and possibly not directed along the beamline. This bias might increase with eccentric jets and LVOT flow distorted by an upper septal bulge, which highlights the potential strength of volumetric 3D velocity information obtained with 4D flow MRI. The main limitation of this study is that it was performed only for healthy volunteers. Future studies will include complex jet structures such as those with in AS patients to understand if the compensatory under- and overestimation of the continuity equation parameters continues to yield valid EOA values. Additional improvements will temporally track the radial and axial movements of the VC to improve accuracy when estimating the EOA.CONCLUSION
This consecutive study confirms agreement between Doppler echocardiography and 4D flow MRI for estimation of EOA, yet possible reveals possible errors in echo due to jet-beam misalignment and assumption of a circular LVOT cross-section. Larger studies including complex flow structures are required to confirm if the continuity equation to compute EOA remains valid in the presence of significant disease.Acknowledgements
Contract grant sponsor: GE healthcare, National Institutes of Health (NIH); contract grant numbers: K25HL119608 and NIHR01HL133504
References
1. Nishimura RA., Otto CM, Bonow RO, et al. 2014 AHA/ACC guideline for the management of patients with valvular heart disease. Circulation. 2014, CIR-0000000000000031.
2. Vahanian A, Baumgartner H, Bax J, et al. Guidelines on the management of valvular heart disease: The Task Force on the Management of Valvular heart disease of the European Society of Cardiology. Eur Heart J. 2007,28(2):230-68.
3. Garcia J, Kadem L, Larose E, Clavel MA, et al. Compaison between cardiovascular magnetic resonance and transthoracic Doppler echocardiography for the estimation of effective orifice area in aortic stenosis. J Cardiovasc Magn Reson. 2011,13:25.
4. Baumgartner H, Khan SS, Derobertis M, Czer LS, et al. Doppler assessment of prosthetic valve orifice area: an in vitro study. Circulation.1992,85(6):2275-2283
5. Baumgartner H, Hung J, Bermejo J, Chamers JB, et al. Echocardiographic assessment of valve stenosis: EAE/ASE recommendations for clinical practice. J Am Soc Echocadiogr. 2009,22(1):1-23.
6.Garcia J, Barker AJ, Murphy I, Jarvis J et al. Four-dimensional flow magnetic resonance imaging-based characterization of aortic morphometry and haemodynamics: impact of age, aortic diameter, and valve morphology. Eur Heart J Cardiovasc Imaging. 2016,17:87-884.
Figures