2976
Evaluation of e-prime with cardiac magnetic resonance cine imaging—preliminary feasibility study with comparison to echocardiography1Department of Clinical Physiology, Skåne University Hospital, Lund University, Lund, Sweden, 2Department of Biomedical Engineering, Faculty of Engineering, Lund University, Lund, Sweden, 3Department of Radiology and Biomedical Imaging, Yale School of Medicine, Yale University, New Haven, CT, United States, 4Section of Cardiovascular medicine, Department of Internal Medicine, Yale School of Medicine, Yale University, New Haven, CT, United States
Synopsis
Diastolic dysfunction is commonly assessed by echocardiography, but not by cardiovascular magnetic resonance (CMR). To evaluate diastolic function, the mitral annular flow (E) and velocity (e’) at the early rapid filling phase are measured. While E can be accurately measured by CMR, methods for measuring e' need to be established. In this study a feature tracking based method for measuring e' is applied to CMR images, and validated against echocardiography. There was an agreement between the methods, but sources of disparities between CMR and echocardiographic e’ measurements need to be further studied in order to improve the accuracy of e’ measurement by CMR.
Introduction
Diastolic dysfunction is the underlying cause in 40-50% of patients suffering from heart failure [1]. Clinically, diastolic dysfunction is assessed by transthoracic echocardiography (TTE), by measuring the mitral annular flow (E) and velocity (e’) at the early rapid filling phase. E/e’ is a surrogate for left ventricular filling pressure [2] and has important implications for left atrial remodeling. Cardiovascular magnetic resonance (CMR) is not clinically utilized to measure e’, although it is feasible using tissue phase mapping [3] or feature tracking algorithms [4]. While markers of diastolic function ‘E’ and ‘A’ can be accurately measured by phase contrast CMR [1], without e’ their value is limited. The aim of this work was to show preliminary results of e’ measurements from long-axis 4-chamber CMR cine images using a semi-automatic feature tracking algorithm, validated against TTE.Methods
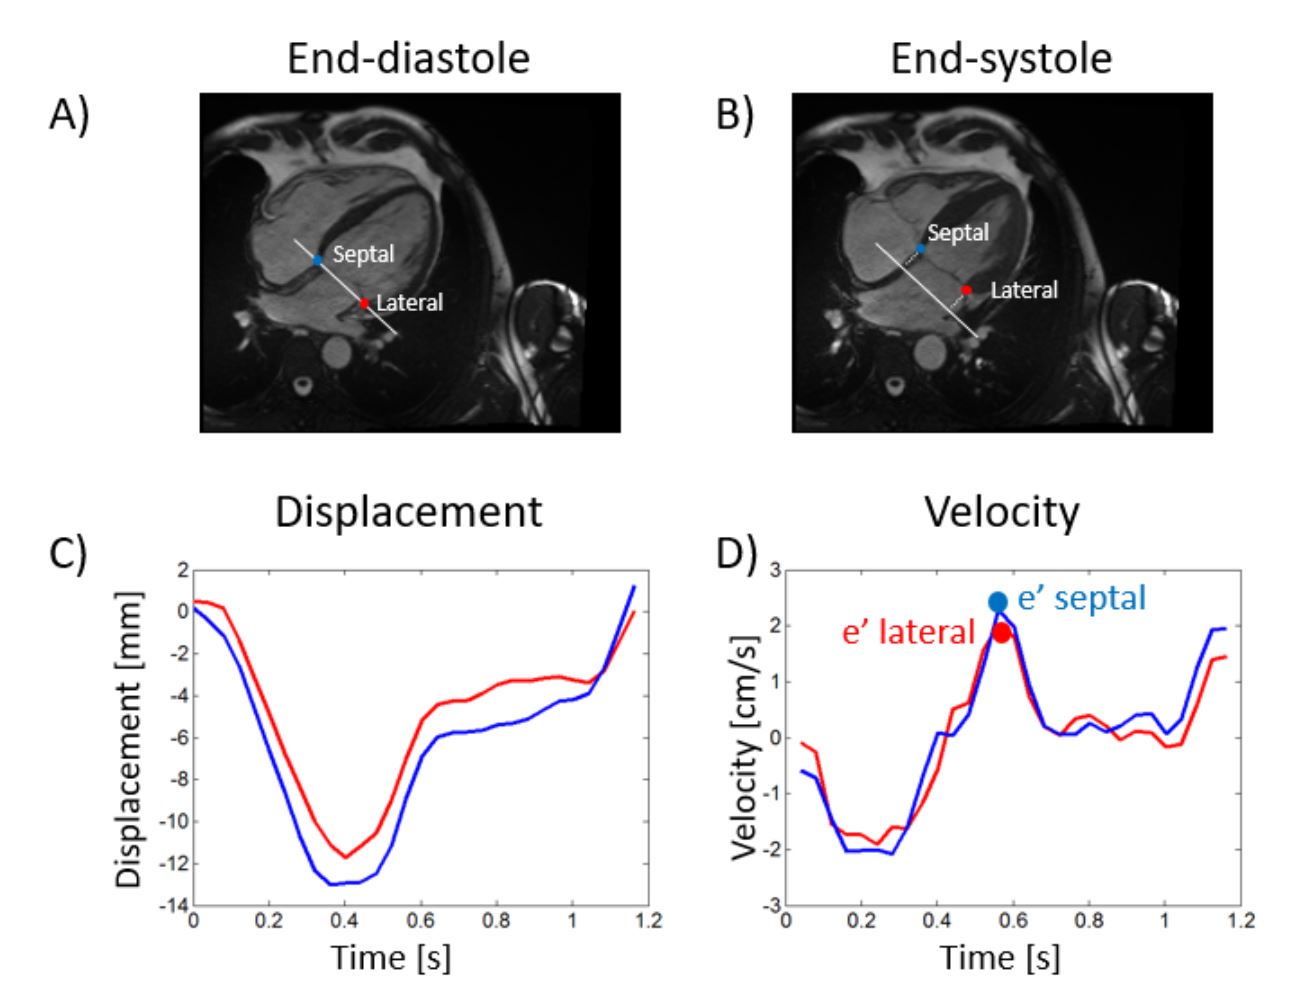
Thirty-five patients (13 female, age 49±16 years) underwent CMR on a 1.5T clinical scanner (Siemens Healthcare, Erlangen), as well as TTE. Patients were retrospectively included for diverse indications including dilated cardiomyopathy, hypertrophic cardiomyopathy, sarcoid, arrhythmogenic right ventricular cardiomyopathy, coronary disease and family history of disease. Patients with arrhythmia during the scan were excluded. CMR images were acquired with a balanced steady-state-free-precession (bSSFP) sequence with 30 timeframes per cardiac cycle, 2x2x8mm3, TR/TE/q=3ms/1.5m/60°. Heart-rate during CMR was 70±11 bpm (mean±SD). The software Segment [5] was used to asses e’, using a time-resolved feature tracking of the mitral annulus displacement with manual corrections when necessary [4], see Figure 1. The lateral and septal displacement curves were smoothed to eliminate discontinuities, and the velocity was calculated by taking the time derivative. The peak velocity at the early rapid filling phase was considered e’ in the CMR images.Results
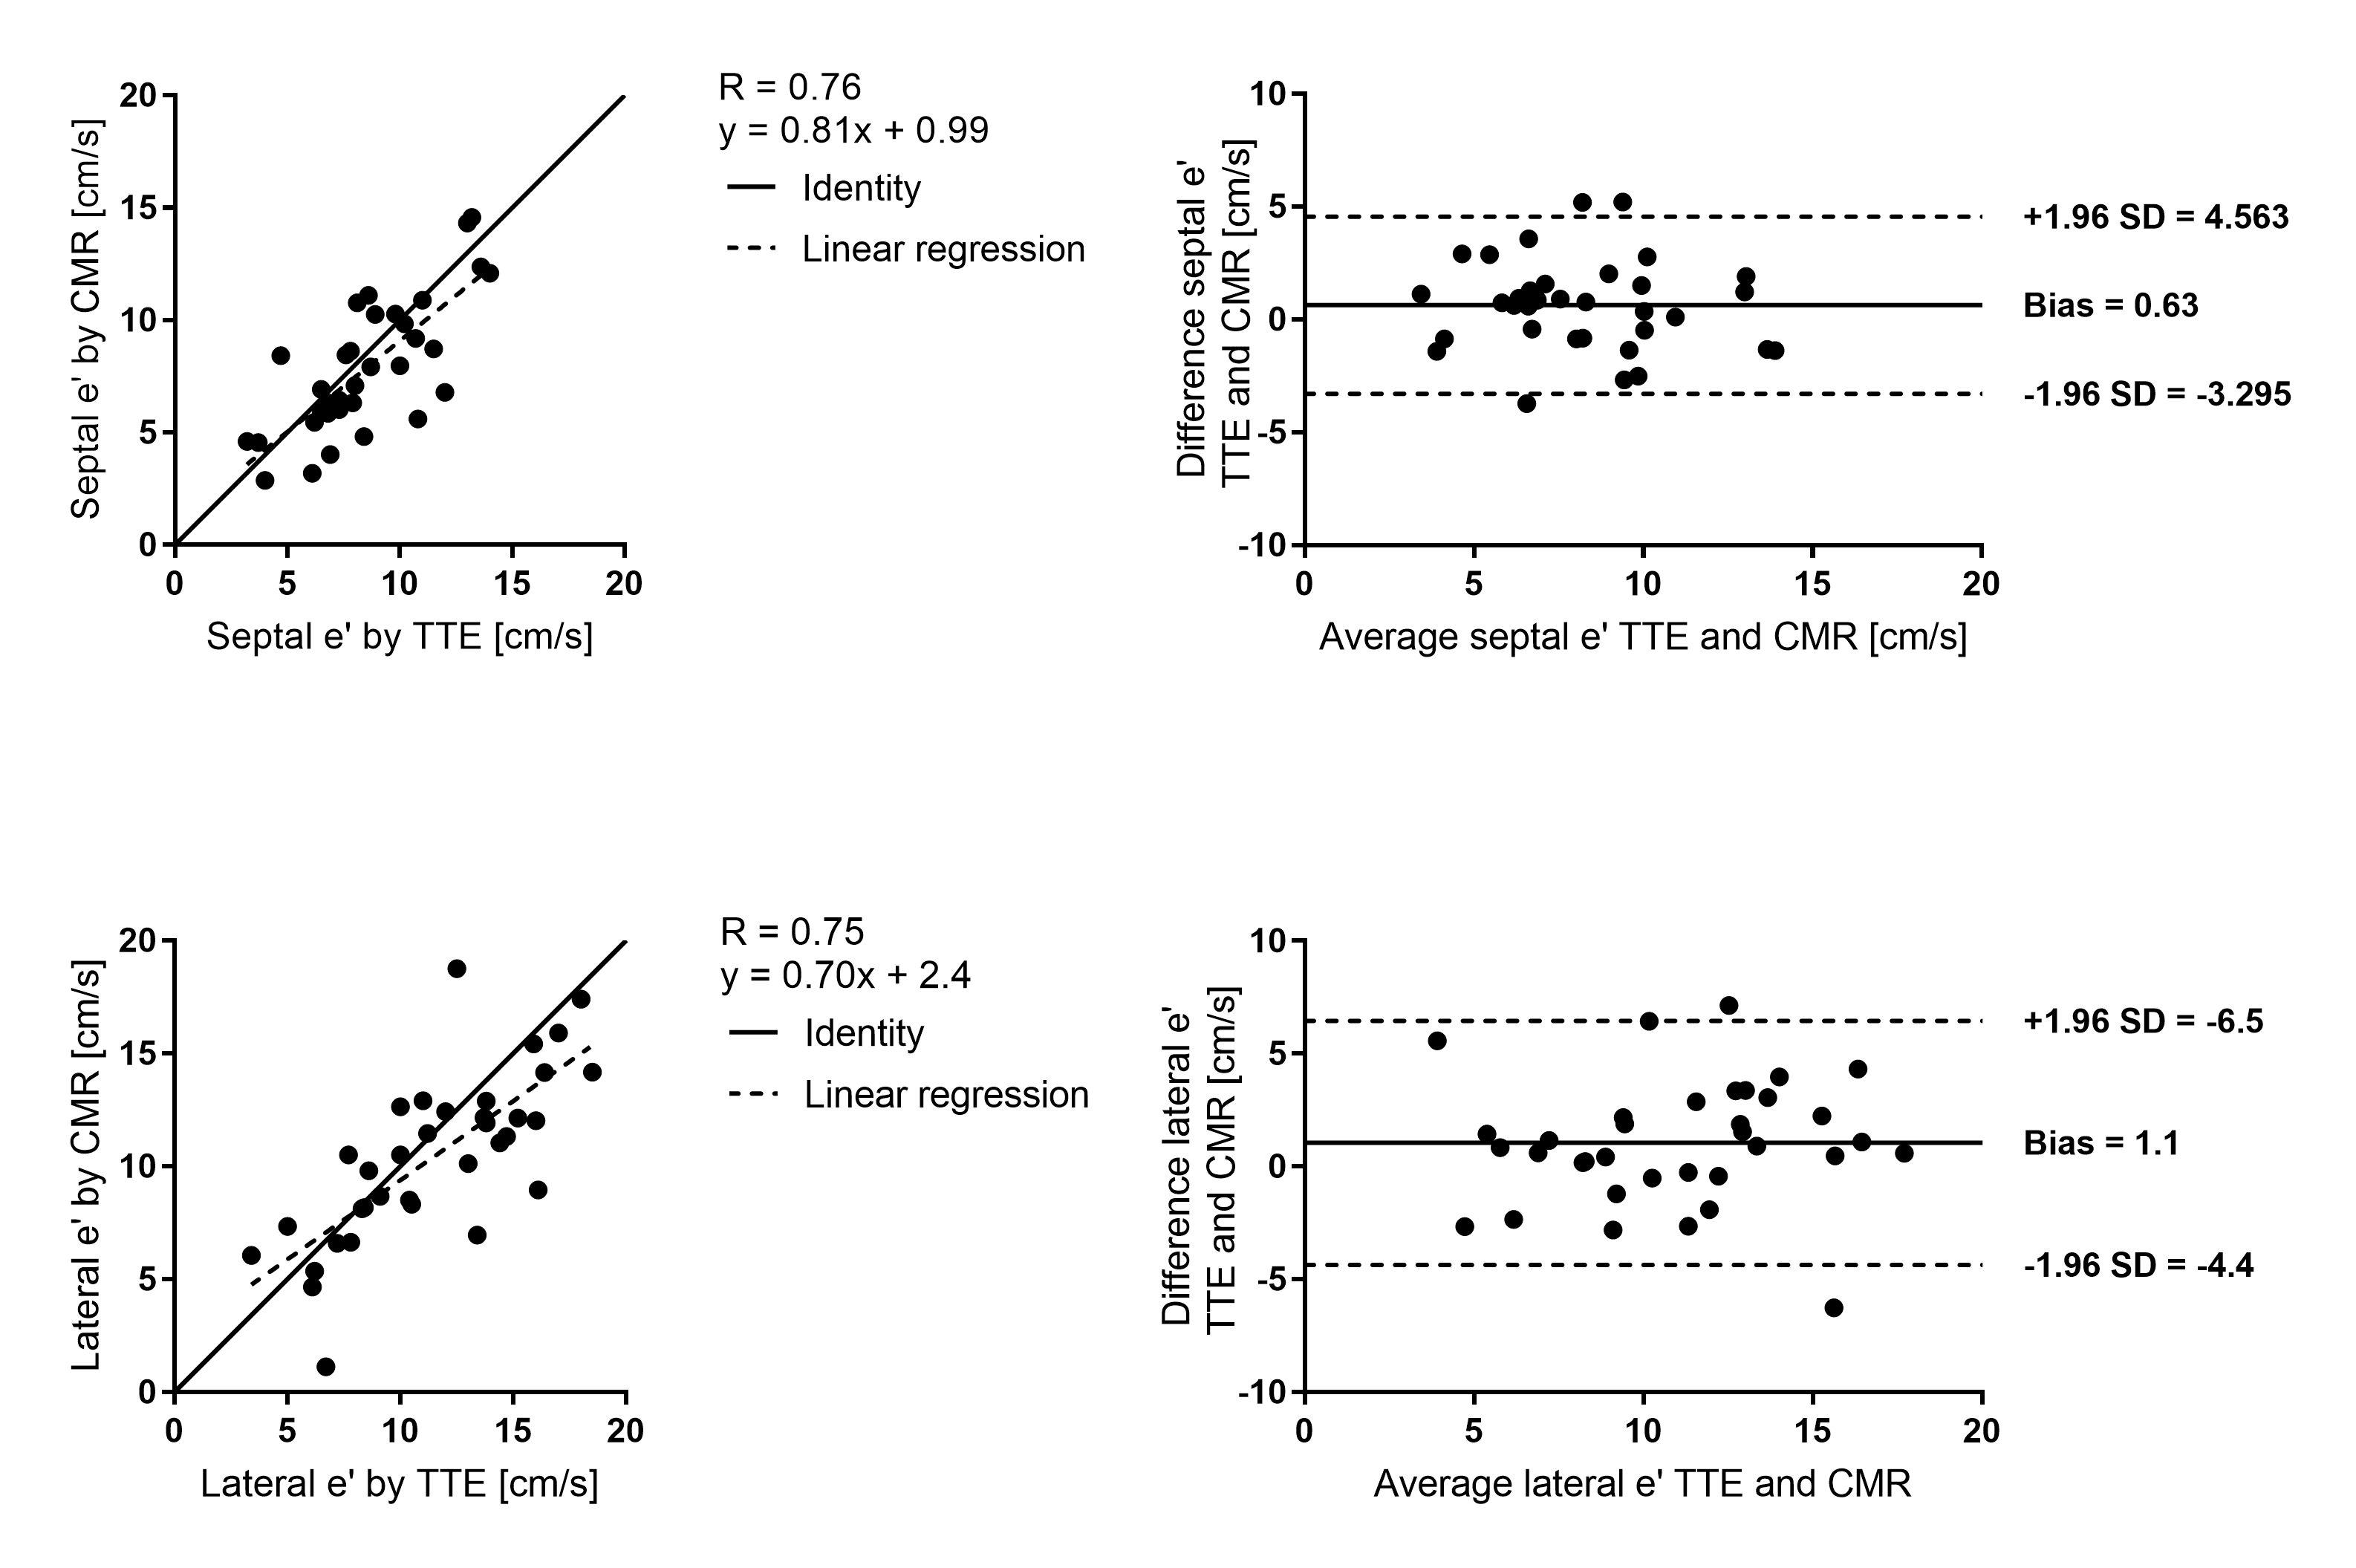
Figure 2 discloses the agreement between e’ by TTE and CMR. Correlation R values were strong (R=0.76 in septal point, R=0.75 in lateral point). Bland-Altman analysis yielded a low bias but rather large standard deviation (bias±2SD = 0.63±4.0 cm/s for septal e’, and 1.1±5.6 cm/s for lateral e’). Neither increased heart rate nor days between measurements by TTE and CMR were factors in the observed differences between the e’ measures.Conclusions
This preliminary study presents and validates a new CMR-based method for measuring e’, which could potentially enable assessment of diastolic function using CMR. Although there was a strong correspondence, it will be important to identify the sources of disparities between CMR and echocardiographic e’ measurement, in order to improve the accuracy of e’ measurement by CMR.Acknowledgements
This work was in part supported by the ISMRM Research Exchange Program, the Swedish Heart-Lung Foundation, and the NHI (R01HL122560).References
1. Caudron, Radiographics 2011
2. Nagueh, European Journal of Echocardiography 2009
3. Westenberg, Current cardiovascular imaging reports 2011.
4. Seemann, BMC Med Imaging 2017.
5. Heiberg, BMC Med Imaging 2010.
Figures