2975
Automatic lumen size measurement in carotid atherosclerosis with phase sensitive magnetic resonance angiography(MRA) using self-trained radial basis function kernel support vector machine1Radiology, University of Washington, SEATTLE, WA, United States
Synopsis
A self-trained algorithm based on Ostu’s method and a radial basis function (RBF) kernel support vector machine (SVM) model was developed for automatic lumen detection and quantification for the negative polarity map of SNAP magnetic resonance angiography(MRA). Based on an analysis of 15 arteries with carotid stenosis, the proposed automatic lumen segmentation algorithm demonstrated good agreement with manual lumen segmentation of SNAP MRA (intraclass correlation coefficient (ICC=0.95). The automated method also had good agreement with manual segmentation of CE-MRA (ICC = 0.90), which was comparable to the agreement between manually segmented SNAP MRA and CE-MRA (ICC = 0.93).
Purpose
Simultaneous Non-Contrast Angiography and intraPlaque hemorrhage (SNAP)1 is a phase sensitive inversion recovery cardiovascular MR angiographic method that can simultaneously detect and quantify luminal stenosis and intraplaque hemorrhage (IPH). Using a fully sampled reference scan, for optimized tissue contrast, the polarity of IPH and the lumen is positive and negative, respectively, while the magnitude of vessel wall is around zero. In this study, the negative polarity map of SNAP MRA was used to determine the lumen boundary. A self-trained algorithm based on Ostu’s method and radial basis function (RBF) kernel support vector machine (SVM) model was developed for automatic lumen detection and quantification. The lumen boundary defined in this way may be more consistent and with better agreement with the boundary identified by contrast enhanced MRA.Method
Lumen boundary identification is important for vessel wall imaging and stenosis measurement. But it may be difficult due to signal profiles and artifacts. Signal polarity map may help better define the true boundaries.
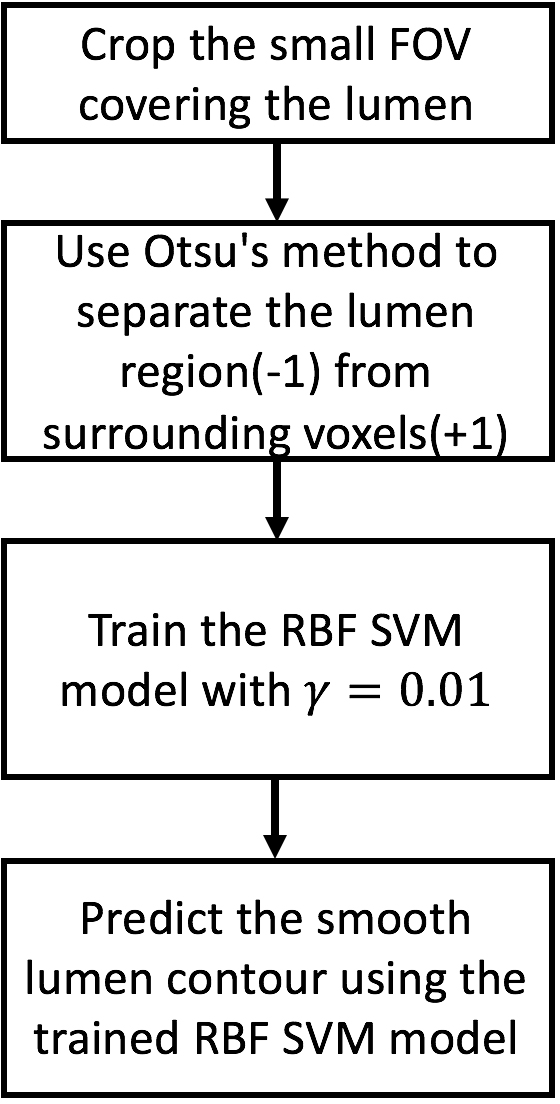
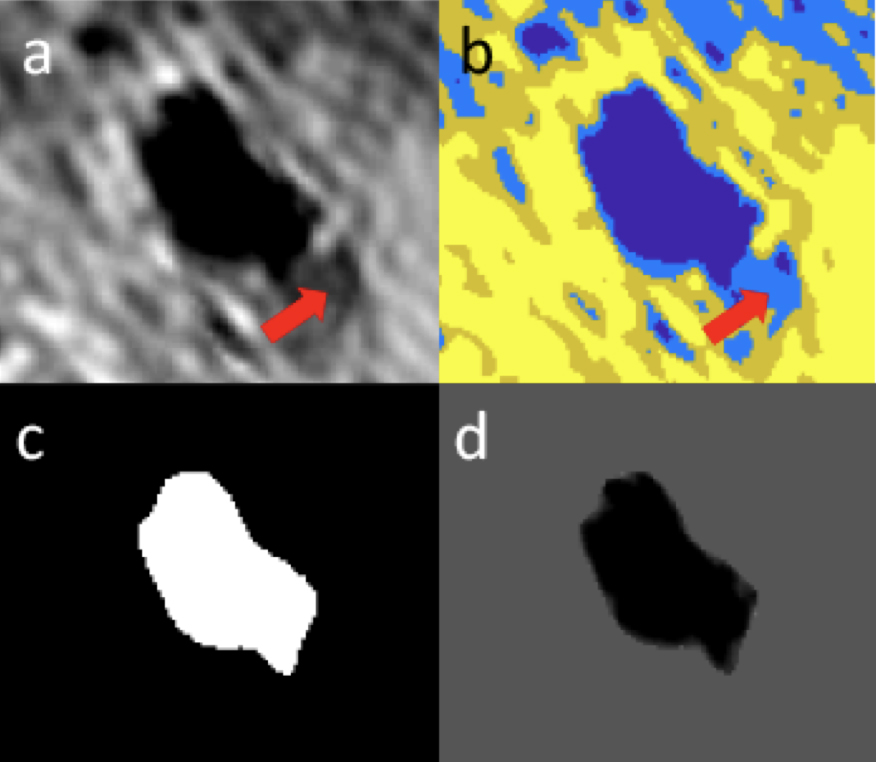
Theory: A flow chart of the algorithm is shown in Figure 1. Partial volume effects may produce negative polarity regions near the lumen which usually have a relatively low intensity compared to the lumen region. Ostu’s method was used to separate the lumen from the low intensity negative region (Figure 2b). Ostu’s method is to optimize the intensity threshold Tthre with maximum P=W1(u1-uaver)2+W2(u2-uaver)2where W1 and W2 represents the percentage of voxels whose intensity are smaller or larger than Tthre respectively. uaver represents the average intensity within the negative region. u1 and u2 represents the average intensity of voxels whose intensity is smaller and larger than Tthre respectively. Voxels were labeled as +1 or -1 if their intensity was larger or smaller than Tthre, respectively. The RBF kernel SVM model 2 was then used to smooth the lumen boundary. The RBF kernel function is k(x1,x2)=exp(-γ|x1-x2|2), where x1 and x2 represent two vectors and γ controls the smoothness of the SVM boundary. The coordinates and labels of the voxels within the FOV covering the lumen firstly served as the training data to train a RBF SVM model with γ set as 0.01. The same group of voxels are then served as the test data to predict their label and therefore produce a smooth lumen contour (Figure 2).
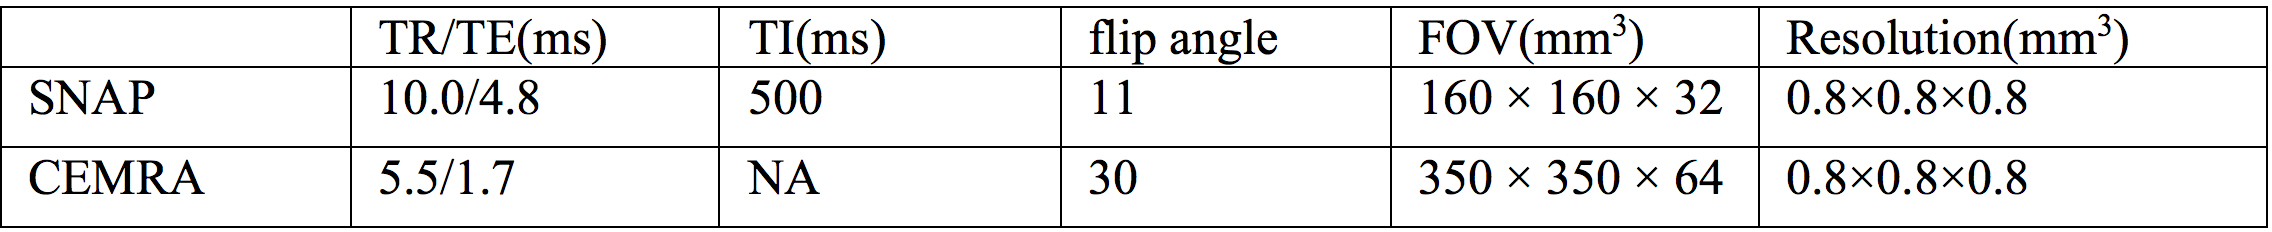
MRI Scan: Fifteen arteries from11 patients (72.1±8.6 years; 2 females) with luminal stenosis on CE-MRA were studied. The study procedures were approved by the Institutional Review Board. Written informed consent were obtained from all subjects prior to MRI. Subjects were scanned on a 3T whole-body scanner (Philips Achieva, Best, The Netherlands). An eight-channel phase-array surface coil (Chenguang, Shanghai, China) was used for carotid MRI. Each subject was scanned with SNAP and then contrast enhanced MRA (CEMRA) with the scan parameters shown in Table 1. CE-MRA was performed using 0.1 mmol/kg of gadolinium-based contrast agent (Magnevist, Bayer Healthcare, Wayne, NJ) with an injection rate of 2 ml/second followed by saline flush. A traditional first-pass CE-MRA was performed.
Image Analysis: Cross-sectional slices centered around carotid bifurcation were matched between the SNAP and CE-MRA. Lumen area was measured using the Sobel gradient map for CE-MRA (magnitude images). For SNAP, the lumen area was drawn and measured from the negative polarity map both automatically using the proposed algorithm and manually for comparison using negative polarity map as the reference. Agreement between techniques for measuring lumen area was evaluated using intraclass correlation coefficient (ICC) and paired t-test. The non-parametric bootstrap and percentile method were used to calculate 95% confidence intervals (CI) and compare ICC estimates between the two sequences.
Results
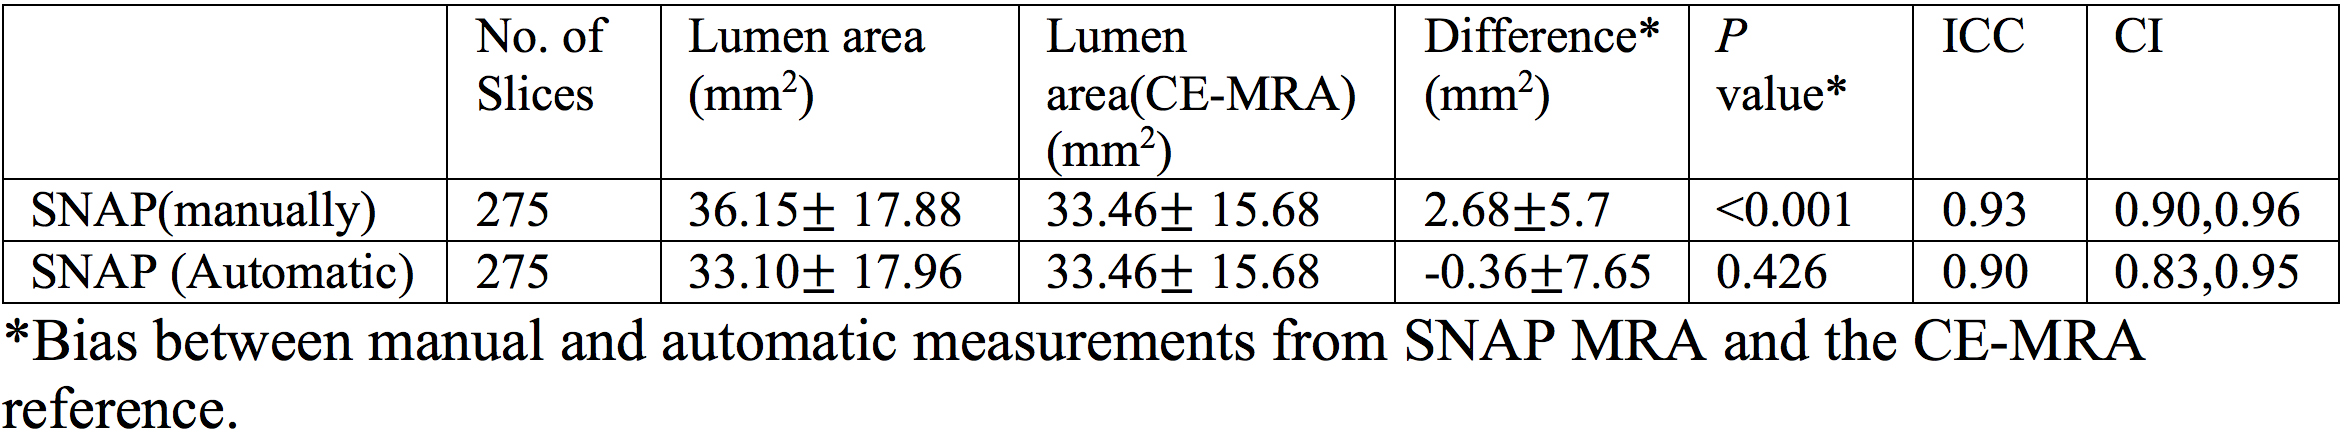
Agreement between SNAP MRA and CE-MRA measurements are summarized in Table 2 from 15 arteries with stenosis. Lumen area measured with the proposed automatic method achieved good agreement with CE-MRA (ICC=0.90, 95% CI: 0.83,0.95), which was comparable to the level of agreement between manual lumen segmentation on SNAP MRA and CE-MRA (ICC=0.93, 95% CI: 0.90, 0.95). Similarly, there was good agreement between the manual and automatic lumen area measurements from SNAP MRA (ICC=0.95, CI: 0.89, 0.98).Discussion and conclusion
In this study, an automatic lumen segmentation method relying on the negative polarity map of SNAP MRA was developed and showed good agreement in lumen area measurements with manual segmentation of SNAP and CE-MRA. This algorithm is self-trained without the need of extra training images. The lumen contour is determined by SVM model to locally separate the positive and negative voxels while the overall smoothness is controlled by the of RBF kernel and therefore is less sensitive to flow artifacts.Acknowledgements
This study is supported by grants from the National Institutes of Health (R01 HL103609 and R01 NS083503).References
1. Wang, J., Börnert, P., Zhao, H., Hippe, D.S., Zhao, X., Balu, N., Ferguson, M.S., Hatsukami, T.S., Xu, J., Yuan, C. and Kerwin, W.S., 2013. Simultaneous noncontrast angiography and intraplaque hemorrhage (SNAP) imaging for carotid atherosclerotic disease evaluation. Magnetic resonance in medicine, 69(2), pp.337-345.
2. Kotropoulos, C. and Pitas, I., 2003. Segmentation of ultrasonic images using support vector machines. Pattern Recognition Letters, 24(4), pp.715-727.
Figures