2974
Phase Unwrapping of 4D Flow Data with Graph Cuts1Electrical and Computer Engineering, University of Louisville, Louisville, KY, United States, 2University of Louisville, Louisville, KY, United States
Synopsis
A common problem with 4D flow magnetic resonance imaging is aliasing that occurs as a result of a low velocity encoding parameter. Consequently, an efficient and robust algorithm is needed to unwrap this data. We propose an iterative graph cuts algorithm to perform the necessary phase unwrapping and attain correct velocity values. The graph cuts algorithm utilizes a global energy minimization framework. This method is shown to accurately unwrap the aliased data more accurately than existing techniques for 4D Flow data. This included unwrapping synthetic data with Vencs down to 20% of the max velocity and SNRs down to 2.
Introduction
To date, few techniques have been applied to perform 4D flow phase unwrapping when velocity aliasing is present. Previously proposed techniques include Laplacian methods [1] and spatial gradient [2] techniques. This abstract explores a 4-dimensional graph cuts unwrapping technique for unwrapping aliased velocities in 4D flow MRI.Methods
The 4-dimensional graph cuts unwrapping algorithm is largely an extension of the algorithm developed in [3] and previously applied to MRI in [4]. Graph cuts leverage the max-flow min-cut theorem and have been applied widely to image segmentation. To leverage the max-flow min-cut theorem for phase unwrapping, edges between all voxels must be mathematically given a weight. Once this edge weights are determined, a minimum cut is made that also defines the maximum flow. Thusly, the algorithm determines the cut that will lead to the minimum energy for the entire dataset. Ideally, once the minimum energy is obtained the data will be unwrapped. The Phase Unwrapping Max-Flow Algorithm (PUMA) unwraps images via a sequence of binary optimizations. Following each iteration, every voxel label is kept at its current value or increased by one as seen in the following equation. $$K^{t+1}=K^{t}+n^{t+1}$$ In the above equation K is the wrap count integer value, n is a binary variable (0 or 1), and t represents the iteration count [3]. The wrap count integer determines the final unwrapping product using the equation $$$\phi(r)=\phi_{w}(r)+K*2\pi$$$ where $$$\phi(r)$$$ is the unwrapped phase at voxel, r, and $$$\phi_{w}(r)$$$ is the wrapped phase at voxel, r. For the 4D algorithm used in this abstract the local energies are weighted for neighboring voxels in the spatial (x, y, z) and temporal dimensions. Each binary optimization decreases the total energy of the system until the total energy of the system ceases to decrease with the optimization.Experimental Results
Testing was done on synthetic and phantom data. The 4D synthetic data is representative of pulsatile flow through cylindrical tubes – diameters: 10mm, 20mm, 30mm, and 40mm. The peak velocity was 100 cm/sec while the VENC was between 10 cm/sec and 100 cm/sec in increments of 10 cm/sec to create varying degree of aliasing. Complex Gaussian noise was added to the data to match the desired SNR level [1]. Real data was also collected using a rigid phantom of the LV outflow tract including an aortic valve on a 1.5 T Phillips Scanner. Real pulsatile flow velocity through the phantom was obtained with VENC of 40, 80, 125, and 250 cm/sec. 20 slices were collected through a phantom with a 1” diameter with in-plane resolution 1.5 mm x 1.5 mm and slice thickness = 3 mm. 16 temporal phases were collected. The peak systolic flow rate was set at 200 ml/sec while the peak velocity was observed at 175 cm/sec. Wrapping was observed in all of the scans in the systolic phase with the exception of the 250 cm/sec VENC setting. The 250 cm/sec VENC data was used as the true reference velocity data. The relative root mean squared error (RRMSE) between the reference data and the unwrapped data was used as an error metric.Results on Synthetic Data
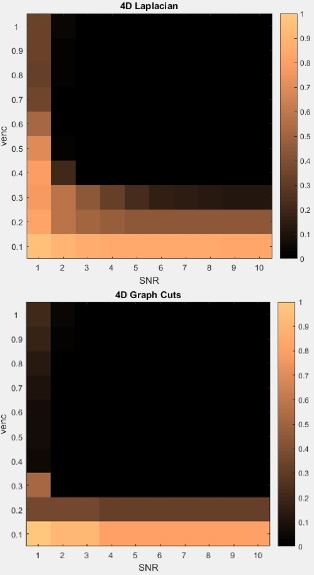
Ultimately, the graph cuts unwrapping technique proved completely successful (meaning all aliased voxels were accurately unwrapped) for VENC’s down to 20% of the max velocity and SNRs down to 2 (see figure 1). In comparison, the 4D Laplacian method was only completely effective for VENC’s down to 40% and SNRs down to 3.Results on Real Data
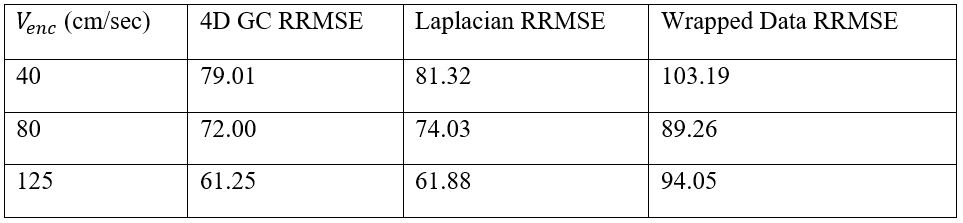
Figure 2 shows aliased systolic and diastolic images from an in-vitro flow phantom experiment, displaying images at the level of a synthetic aortic valve and corresponding unwrapped data. Table 1 summarizes results from the in-vitro phantom study.Discussion
The graph cuts algorithm has proven a reliable method for unwrapping smaller datasets of PC-MRI data. When compared with the standard 4D PC-MRI Laplacian unwrapping algorithm utilizing the RRMSE metric, the graph cuts algorithm proved marginally more accurate, but as seen in the case of synthetic data, with low SNR, the performance was superior. The method however is computationally more expensive than the Laplacian method.Acknowledgements
This research has been supported by NIH Grant R21HL132263.References
[1] M. Loecher, E. Schrauben, K. Johnson and O. Wieben, "Phase Unwrapping in 4D MR Flow With a 4D Single-Step Laplacian Algorithm," Journal of Magnetic Resonance Imaging, pp. 833-842, 2015. [2] M. Loecher, K. Johnson, B. Landgraf and O. Wieben, "4D Gradient Based Phase Unwrapping for PC-MR Flow Data," ISMRM, p. 3284, 2011. [3] J. Bioucas-Dias, "Phase Unwrapping via Graph Cuts," IEEE Transactions on Image Processing, pp. 698-709, 2007. [4] J. Dong, F. Chen, D. Zhou, T. Liu, Z. Yu and Y. Wang, "Phase Unwrapping With Graph Cuts Optimization and Dual Decomposition Acceleration for 3D High-Resolution MRI Data," Magnetic Resonance in Medicine, pp. 1353-1358, 2017.
Figures