2973
ECG Characterization and Correction during Exercise Stress Imaging1Medical Physics, University of Wisconsin - Madison, Madison, WI, United States, 2Radiology, University of Wisconsin - Madison, Madison, WI, United States
Synopsis
MRI during exercise stress can be a powerful tool in discerning abnormal cardiac behavior not apparent at rest. As a result of increased cardiac and respiratory motion, robust gating is essential for high-quality acquisitions during exercise. Due to increased patient motion, however, missed ECG triggers are more likely during exercise than at rest. For reconstructions with retrospective gating, such missed triggers can result in data attributed to the wrong portion of the cardiac cycle. In this work, we present an algorithm to identify and correct missed ECG triggers, allowing for exercise scans otherwise compromised by poor gating to be salvaged.
Introduction
A major challenge for cardiovascular MRI during exercise remains proper synchronization of the acquisition and reconstruction with the cardiac cycle. ECG gating is increasingly prone to missed R-wave triggers during exercise, likely due to subject motion, motion of the ECG electrodes, and decreased electrode contact from sweat. In this work, we characterize ECG gating performance during lengthy 4D flow acquisitions at rest and exercise and introduce an algorithm for retrospective gating to correct for missed ECG triggers without the need for prolonging scan time.Methods
Nine healthy controls (26±1 years; 6 male, 3 female) were imaged on a 3.0T scanner (Discovery 750, GE Healthcare). 4D flow imaging of the chest was performed at rest and during exercise with a radially undersampled trajectory (PC VIPR1,2; TR/TE=6.2/2.0ms; FA=10°; VENC=200cm/s; FOV=32x32x32cm; spatial resolution=1.25mm isotropic; scan time=9.25 min). Bellow position and R-wave trigger locations as detected by 4-lead vector ECG were recorded for retrospective respiratory and ECG gating in a custom offline reconstruction. Supine exercise was conducted at 70% of each subject’s VO2,max in the magnet bore with an MR-compatible stepper (Ergospect GmbH). Exercise imaging began when each subject had achieved a steady-state heart rate. ECG gating for scans at rest and during exercise were analyzed in MATLAB. A custom algorithm was used to count the number of missed ECG triggers by analyzing the time intervals between successive trigger points and estimate the locations of missed ECG triggers for an improved reconstruction. Missed trigger locations were estimated by dividing artificially extended intervals from missed heart beats into multiple intervals on the order of a moving median RR interval. Images were reconstructed with the original and corrected gating information. A custom tool3 was used to measure flow waveforms in the aorta pre- and post-gating correction. Following gating corrections, composite Poincaré plots4 were created from normalized RR measurements for the cases at rest and stress to characterize short-term and long-term heart rate variability.Results
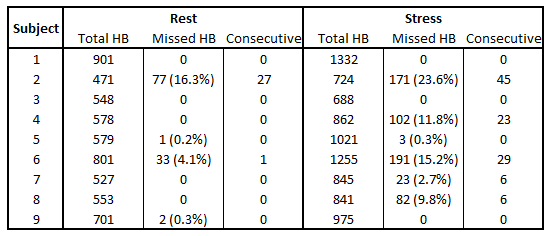
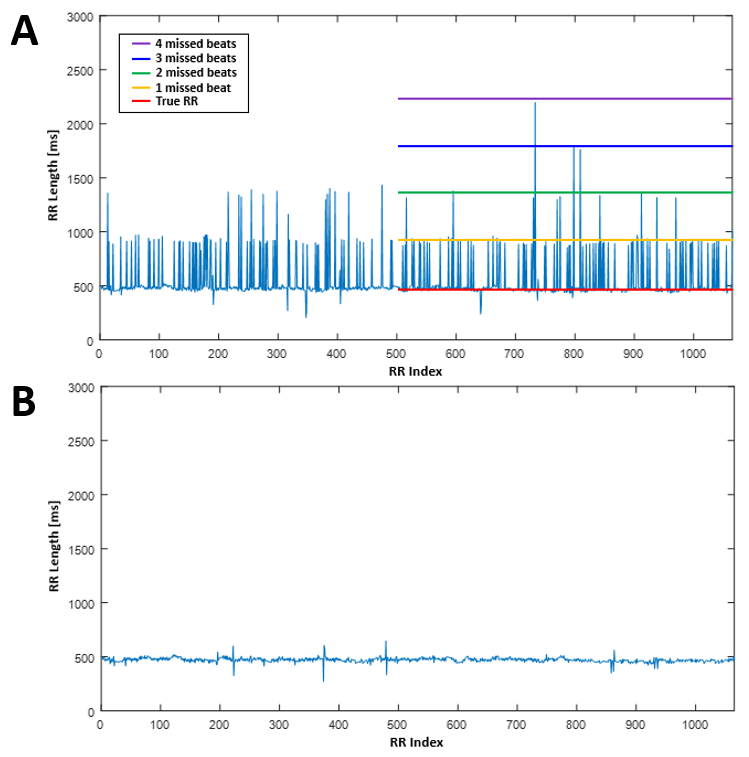
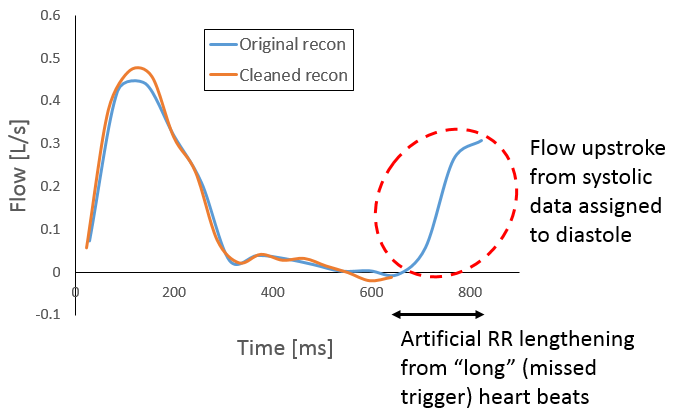
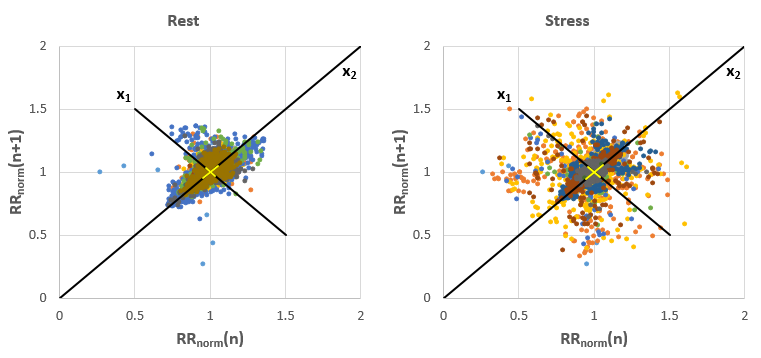
Figure 1 summarizes the missed heart beats across all subjects. At rest, an average of 2% of R-wave triggers were missed. During exercise, gating performance degraded with an average 7% of triggers missed. Figure 2A shows a representative plot of each recorded RR interval length during exercise. While a clear baseline RR interval could be noted at approximately 500 ms, frequent RR intervals approximately integer multiples of the baseline RR interval were observed where one or more consecutive ECG triggers had been missed. Figure 2B shows effective correction of the RR interval lengths for the same subject after the ECG correction algorithm was applied. Figure 3 shows the effect the ECG correction had on total flow and peak flow measurements. On average, total flow changed 29±42% (max:121%) following correction, while peak flow only varied 4±2% (max:8%). These changes can be visualized on a representative corrected flow waveform in Figure 4. Figure 5 shows the composite Poincaré plots generated at rest and stress. Similar long-term heart rate variability was observed (σ(x2,rest)=0.095, σ(x2,stress)=0.105), while exercise acquisitions showed noticeably higher short-term variability (σ(x1,rest)=0.054, σ(x1,stress)=0.076).Discussion
Missed ECG triggers were only a minor concern at rest, as most subjects had none missed or few enough to not noticeably affect flow waveforms when acquired over a 10 min scan. However, during exercise, it was not uncommon for 10-15% of triggers to be missed, which caused significant inaccuracies in flow waveforms and measurements. The simple ECG trigger correction algorithm proved to be effective for corrections. Minimal changes in peak flow measurements following correction suggested preservation of the systolic flow curve, while larger reductions in total flow corresponded to the elimination of false flow measurements during diastole. This algorithm allows for original image SNR to be preserved during exercise imaging, as no recorded data has to be discarded. With trigger corrections in place, the Poincaré plots showed similar long-term variations in heart rate at both rest and stress, suggesting that a steady-state exercise heart rate was achieved for the duration of the scan. Future work will seek to improve temporal binning of corrected data by accounting for variable relative systole and diastole lengths as a function of RR interval length.Conclusion
In this study, we characterized ECG performance at rest and stress and implemented an algorithm to retrospectively correct for missed ECG triggers. Missed triggers were less common at rest, but a noticeable problem during exercise. The algorithm we implemented proved to be effective at correcting the ECG gating, allowing for better flow characterization without the need to discard acquired data associated with missed triggers or prolong scan time.Acknowledgements
We gratefully acknowledge research support from GE Healthcare.References
1. Gu T, Korosec FR, Block WF, Fain SB, et al. PC VIPR: a high-speed 3D phase-contrast method for flow quantification and high-resolution angiography. AJNR. 2005; 26(4): 743-749.
2. Johnson KM, Lum DP, Turski PA, Block WF, et al. Improved 3D phase contrast MRI with off-resonance corrected dual echo VIPR. MRM. 2008;60(6):1329-1336.
3. Stalder AF, Russe MF, Frydrychowicz A, Bock J, et al. Quantitative 2D and 3D phase contrast MRI: Optimized analysis of blood flow and vessel wall parameters. MRM. 2008; 60(5): 1218-1231.
4. Singh B, Singh M. ECG artifacts and Poincare plot based heart rate variability. IJLTET. 2015; 5(4).
Figures