2967
Validation of MR multitasking myocardial perfusion reserve measurements against simultaneous 13N-ammonia PET1Biomedical Imaging Research Institute, Cedars-Sinai Medical Center, Los Angeles, CA, United States, 2Department of Bioengineering, University of California, Los Angeles, Los Angeles, CA, United States, 3Department of Surgery, Cedars-Sinai Medical Center, Los Angeles, CA, United States, 4Board of Governors Regenerative Medicine Institute, Cedars-Sinai Medical Center, Los Angeles, CA, United States, 5Department of Medicine, David Geffen School of Medicine, University of California, Los Angeles, Los Angeles, CA, United States
Synopsis
Measurements from myocardial perfusion MRI have previously been compared against separate PET measurements. However, MR quantification is complicated by signal nonlinearity (leading to a dual-bolus paradigm) and ECG misfires; furthermore, physiological variation in between separate PET and MR assessments are a confounding factor in validation. This work leverages the recent advent of multimodal PET-MR systems to perform a preliminary validation of quantitative MPR measurements from MR multitasking—a new framework allowing single-bolus, non-ECG perfusion quantification—against simultaneous 13N-ammonia PET-MR measurements in pigs. Excellent agreement was found between modalities (no bias, p=0.66; intraclass correlation coefficient=0.95).
Introduction
Quantitative myocardial perfusion MRI is evolving as a promising tool for the diagnosis and stratification of patients with suspected coronary artery disease1. However, quantification is currently complicated by the nonlinear response of signal intensity to contrast agent concentration—leading to a dual-bolus2 paradigm—as well as potential ECG misfires. MR multitasking3, 4, a new framework for quantitative MR perfusion, addresses both ECG dependence and signal nonlinearity by acquiring continuously and resolving the other image dynamics (or “tasks”) which arise in addition to dynamic contrast enhancement. Resolving cardiac motion removes ECG dependence and allows analysis at any cardiac phase. Resolving T1 recovery accounts for signal nonlinearity, producing time-resolved ΔR1 measurements directly proportional to contrast agent concentration and permitting single-bolus perfusion quantification.
$$$\quad$$$In the past, myocardial perfusion reserve (MPR) measurements from MR methods have been validated against separate measurements from PET5-8, the noninvasive standard for quantitative perfusion. However, physiological variations arising from such asynchronous assessments have been shown to be a confounding factor in measurement comparison9. The recent advent of multimodal PET-MR systems10 now provides an excellent opportunity for simultaneous measurements. This work presents a preliminary validation of quantitative MPR measurements from single-bolus MR multitasking against simultaneous 13N-ammonia PET-MR measurements in pigs.
Methods
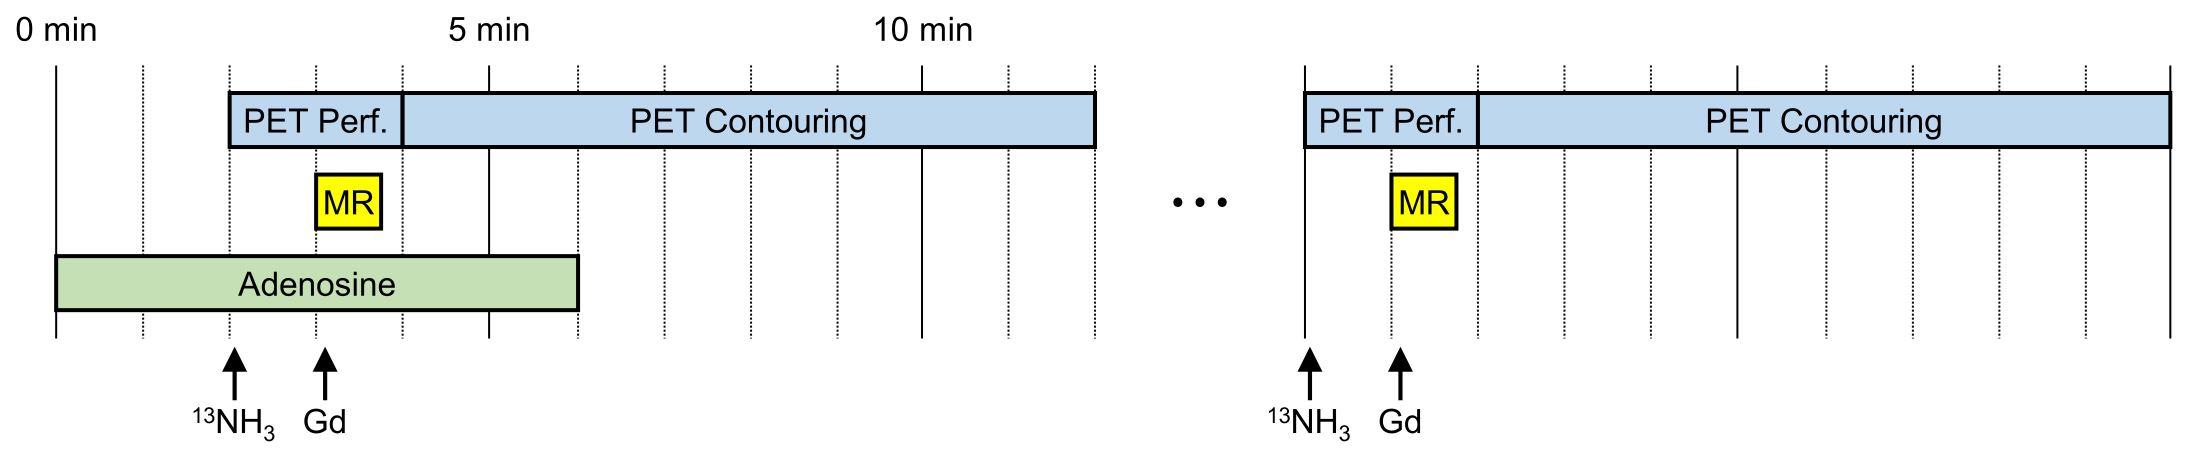
All images were acquired on a 3 T Siemens Biograph mMR PET-MR scanner. Myocardial perfusion was assessed first during vasodilator stress (300–320 μg/kg/min adenosine, administered for 6 min) and again later at rest. PET and MRI perfusion assessments were performed simultaneously, with the PET tracer (~4 mCi 13N-ammonia) injected 1 min before the MRI contrast agent (0.05 mmol/kg gadobutrol). Figure 1 illustrates this protocol, which was run in two farm pigs a total of four times (all on different days).
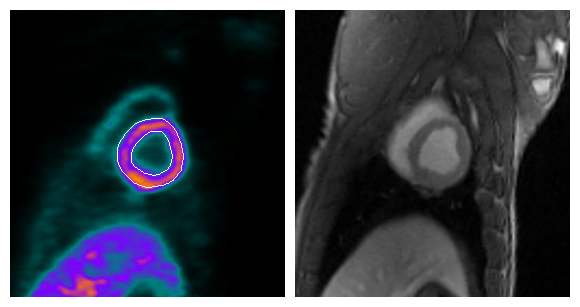
$$$\quad$$$PET images were collected in 3D list mode for 10 min. PET attenuation correction was performed using two-point Dixon MR images11 (Figure 2). Sixteen dynamic PET images (twelve 10-s, two 30-s, one 1-min, and one 6-min frame) were reconstructed using attenuation-weighted ordered-subsets expectation maximization with 3 iterations and 14 subsets, with high-definition resolution recovery option and 5-mm Gaussian postfiltering12. Flow was quantified from the first 2 min of images using a two-compartment model13, and the last 8 min were used to identify left ventricular contours, all in QPET14 (a clinically validated PET software).
$$$\quad$$$MR images were collected in a mid-ventricular short-axis slice during a 45-s breath-hold, using multitasking to perform single-bolus, non–ECG-gated continuous FLASH acquisition throughout repeated 300 ms saturation recovery periods4. Additional measurement parameters were flip angle = 10°, TE = 1.6 ms, TR = 3.6 ms, spatial resolution = 1.7 mm × 1.7 mm, and slice thickness = 8 mm. Time-resolved T1 mapping produced ΔR1 curves proportional to contrast agent concentration; systolic flow was quantified from these ΔR1 curves using Fermi deconvolution15,16 in MATLAB.
$$$\quad$$$For each modality, MPR was calculated as the ratio of stress flow to rest flow. MPR was compared between modalities in the six AHA mid-ventricular myocardial segments using a paired t-test and the intraclass correlation coefficient (ICC).
Results
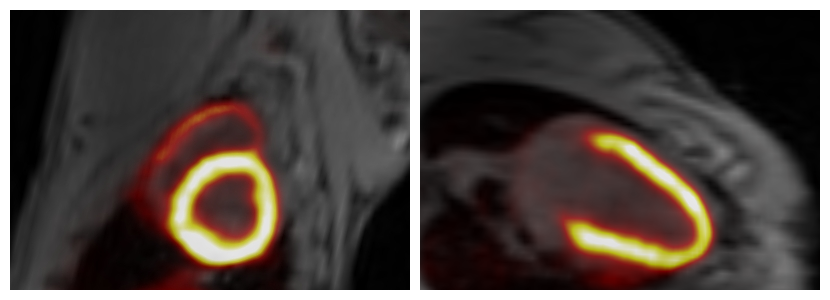
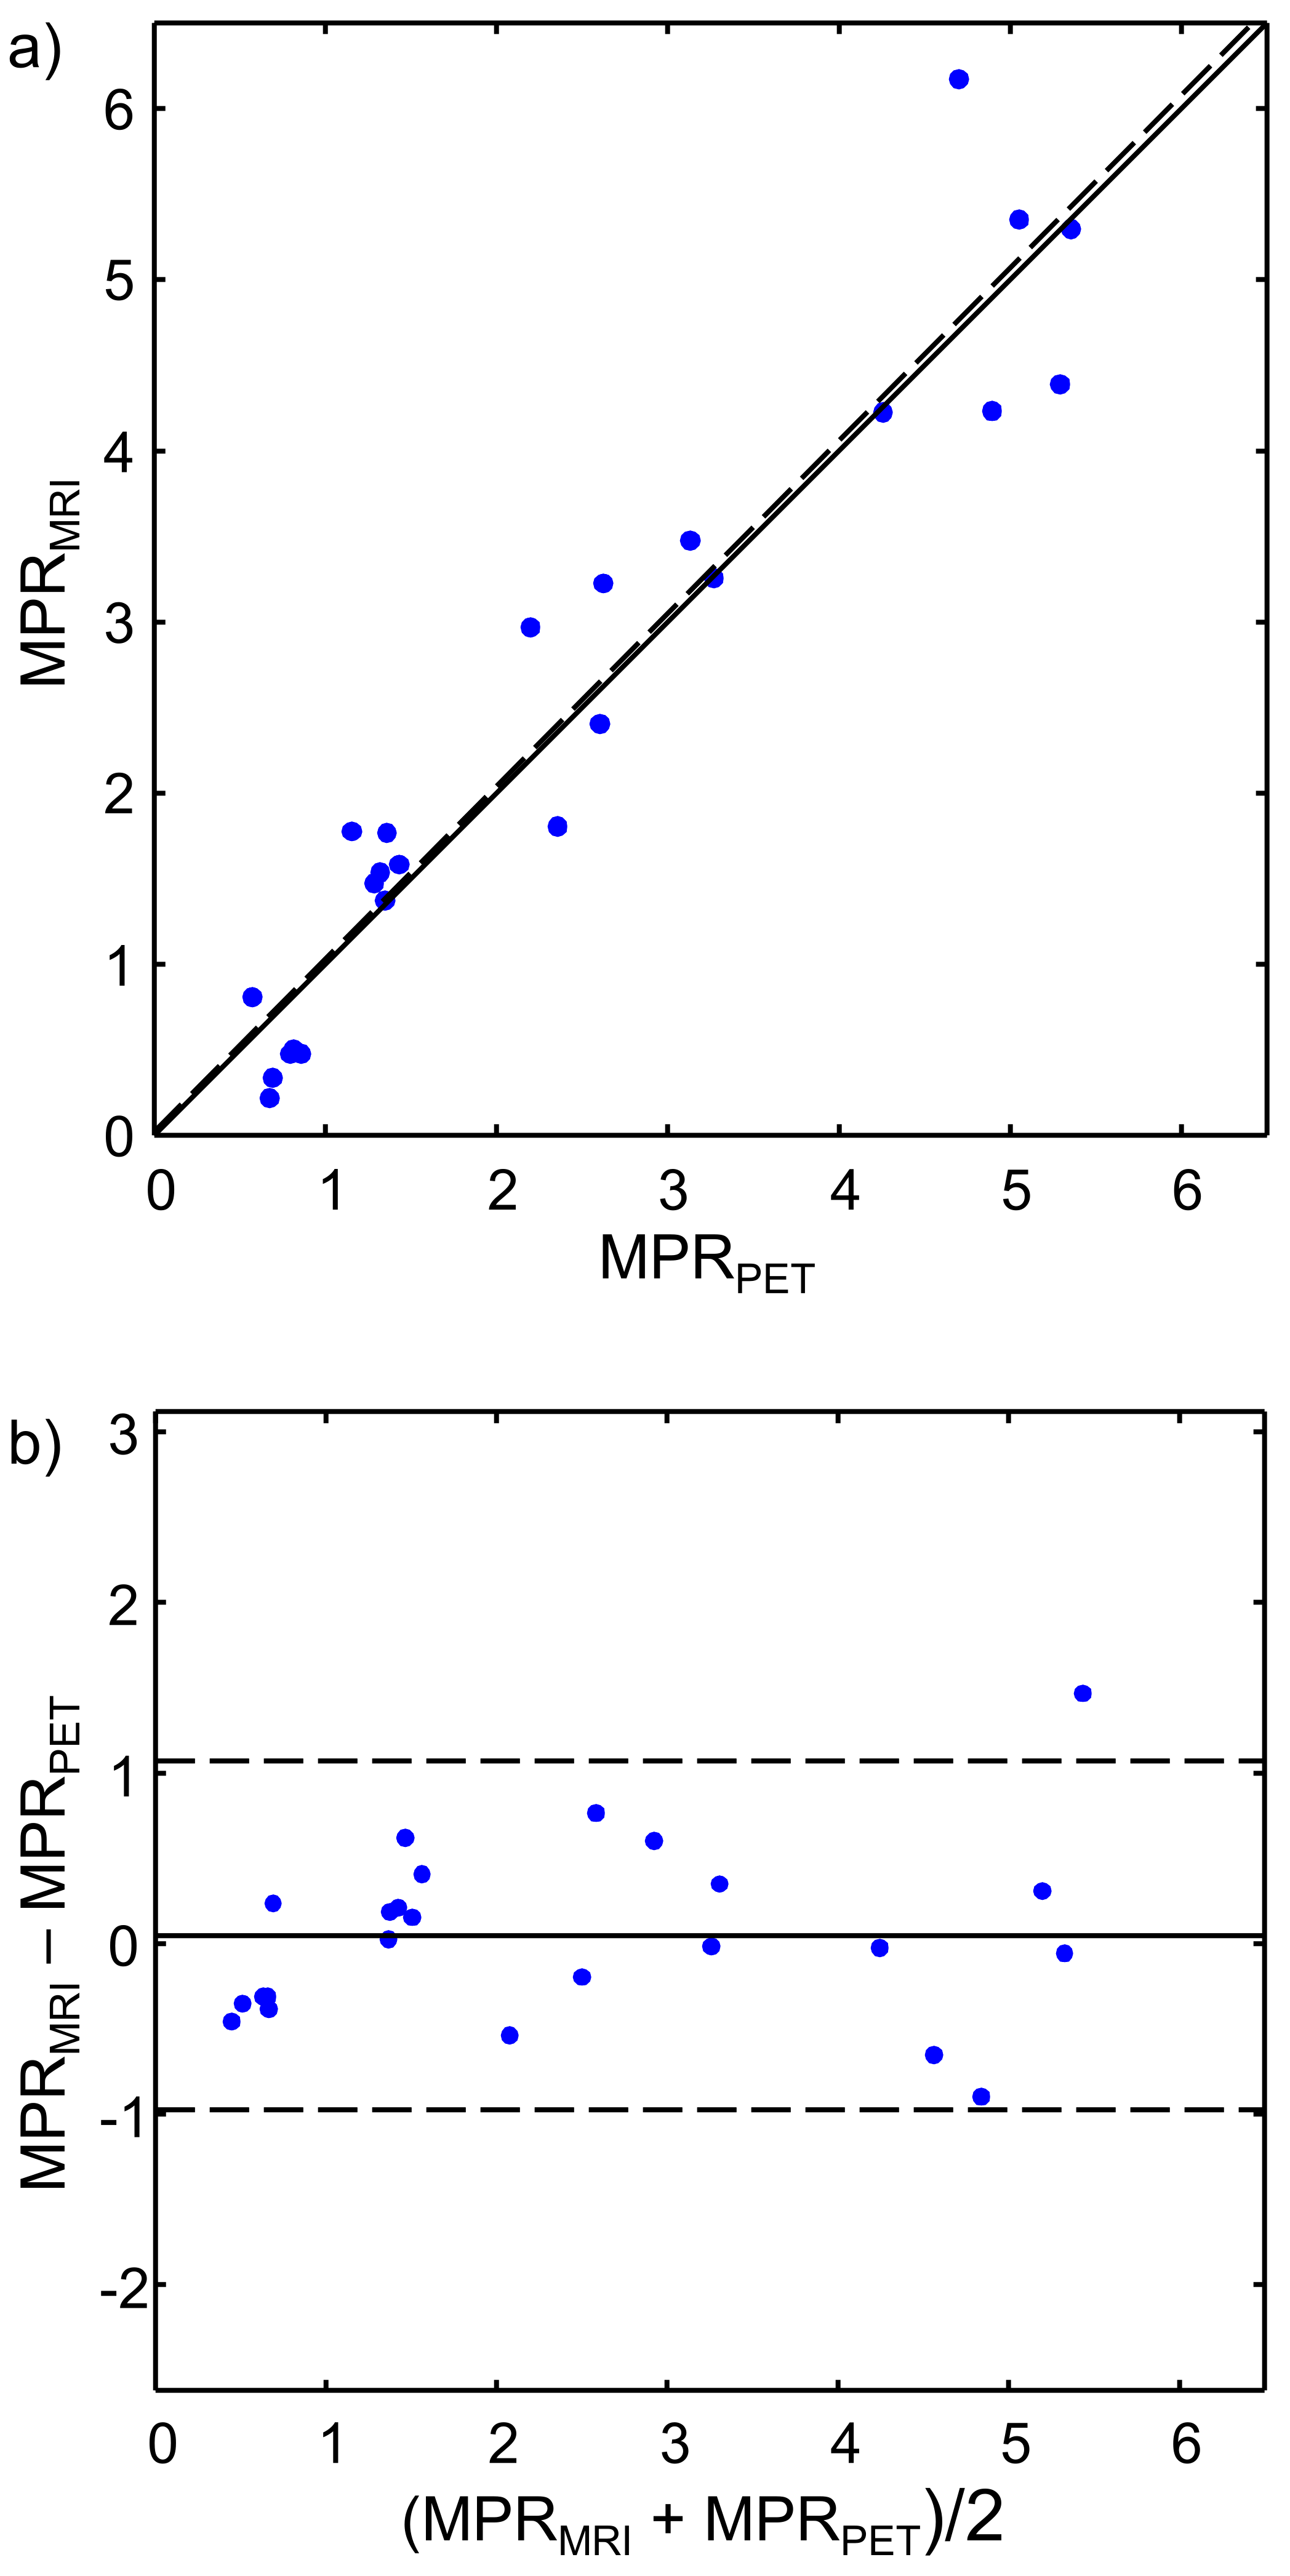
Example rest and stress images from PET and MRI from one session are shown in Figure 3. Figure 4 shows a scatter plot and Bland–Altman plot comparing the n = (6 segments)*(4 sessions) = 24 measurements of MPR. During one session, the subject had no stress response to adenosine, resulting in MPR measurements below 1; this was observed in both modalities. No statistically significant bias was observed between modalities (p = 0.66), and ICC = 0.95.Discussion
Measurements showed excellent agreement with no bias between modalities. ICC values are higher than have been seen in asynchronous PET-MR MPR comparisons5-8, which may be due to improved accuracy of T1-based multitasking perfusion measurements, lack of confounding physiological changes between asynchronous PET and MR scans, and/or increased between-sample variance from a wide range of stress responses. In this preliminary study, only a single mid-ventricular slice was collected during MR scanning, limiting the spatial coverage of the comparison. Follow-up work should include expansion of the MR method to multislice or 3D, evaluation in more subjects, and evaluation in subjects with coronary stenoses.Conclusion
We have demonstrated that perfusion assessments using simultaneous 13N-ammonia PET and single-bolus MR multitasking in pigs exhibited excellent agreement between modalities. The results demonstrate the feasibility of validating MR measurements against concurrent PET measurements and exhibit promising accuracy and precision of measurements using MR multitasking.Acknowledgements
This work was supported by NIH 1R01HL124649.References
- Jerosch-Herold M. Quantification of myocardial perfusion by cardiovascular magnetic resonance. J Cardiovasc Magn Reson. 2010;12(1):57.
- Christian TF, Rettmann DW, Aletras AH, Liao SL, Taylor JL, Balaban RS, Arai AE. Absolute myocardial perfusion in canines measured by using dual-bolus first-pass MR imaging. Radiol. 2004;232.
- Christodoulou AG, Shaw JL, Sharif B, Li D, A general low-rank tensor framework for high-dimensional cardiac imaging: Application to time-resolved T1 mapping. Proc Int Soc Magn Reson Med 2016; 867.
- Christodoulou AG, Shaw JL, Bi X, Sharif B, Li D, Non-ECG first-pass myocardial perfusion T1 mapping with low-rank tensor cardiovascular MR multitasking. Proc Int Soc Magn Reson Med. 2017; 450.
- Pärkkä JP, Niemi P, Saraste A, Koskenvuo JW, Komu M, Oikonen V, Toikka JO, Kiviniemi TO, Knuuti J, Sakuma H. Comparison of MRI and positron emission tomography for measuring myocardial perfusion reserve in healthy humans. Magn Reson Med. 2006;55(4):772-9.
- Fritz‐Hansen T, Hove JD, Kofoed KF, Kelbaek H, Larsson HB. Quantification of MRI measured myocardial perfusion reserve in healthy humans: a comparison with positron emission tomography. J Magn Reson Imaging. 2008;27(4):818-24.
- Pack NA, DiBella EV, Rust TC, Kadrmas DJ, McGann CJ, Butterfield R, Christian PE, Hoffman JM. Estimating myocardial perfusion from dynamic contrast-enhanced CMR with a model-independent deconvolution method. J Cardiovasc Magn Reson. 2008;10(1):52.
- Morton G, Chiribiri A, Ishida M, Hussain ST, Schuster A, Indermuehle A, Perera D, Knuuti J, Baker S, Hedström E. Quantification of absolute myocardial perfusion in patients with coronary artery disease: Comparison between cardiovascular magnetic resonance and positron emission tomography. J Am Coll Cardiol. 2012;60(16):1546-55.
- O’Doherty J, Sammut E, Schleyer P, Stirling J, Nazir MS, Marsden PK, Chiribiri A. Feasibility of simultaneous PET-MR perfusion using a novel cardiac perfusion phantom. Eur J Hybrid Imaging. 2017;1(1):4.
- Catana C, Procissi D, Wu Y, Judenhofer MS, Qi J, Pichler BJ, Jacobs RE, Cherry SR. Simultaneous in vivo positron emission tomography and magnetic resonance imaging. Proc Natl Acad Sci U S A. 2008;105(10):3705-10.
- Marshall HR, Prato FS, Deans L, Théberge J, Thompson RT, Stodilka RZ. Variable lung density consideration in attenuation correction of whole-body PET/MRI. J Nucl Med. 2012;53(6):977-84.
- Slomka PJ, Alexanderson E, Jácome R, Jiménez M, Romero E, Meave A, Le Meunier L, Dalhbom M, Berman DS, Germano G. Comparison of clinical tools for measurements of regional stress and rest myocardial blood flow assessed with 13N-ammonia PET/CT. J Nucl Med. 2012;53(2):171-81.
- Choi Y, Huang S-C, Hawkins RA, Kuhle WG, Dahlbom M, Hoh CK, Czernin J, Phelps ME, Schelbert HR. A simplified method for quantification of myocardial blood flow using nitrogen-13-ammonia and dynamic PET. J Nucl Med. 1993;34(3):488-97.
- Nakazato R, Berman DS, Dey D, Le Meunier L, Hayes SW, Fermin JS, Cheng VY, Thomson LE, Friedman JD, Germano G. Automated quantitative Rb-82 3D PET/CT myocardial perfusion imaging: Normal limits and correlation with invasive coronary angiography. J Nucl Cardiol. 2012;19(2):265-76.
- Axel L. Tissue mean transit time from dynamic computed tomography by a simple deconvolution technique. Invest Radiol. 1983;18:94-9.
- Jerosch-Herold M, Wilke N, Stillman AE, Wilson RF. Magnetic resonance quantification of the myocardial perfusion reserve with a Fermi function model for constrained deconvolution. Med Phys. 1998;25(1):73-84.
Figures