2959
Oxygenation-sensitive cardiovascular magnetic resonance in Hypertensive Heart Disease with LVMH and Non-LVMH:Insight from altered mechanics and cardiac BOLD imaging1Renji Hospital, School of Medicine, Shanghai Jiao Tong University, Shanghai, China, 2Wayne State University, Detroit, MI, United States, 3Department of Cardiology, Renji Hospital, School of Medicine, Shanghai Jiao Tong University, Shanghai, China, 4Philips Healthcare, Shanghai, China
Synopsis
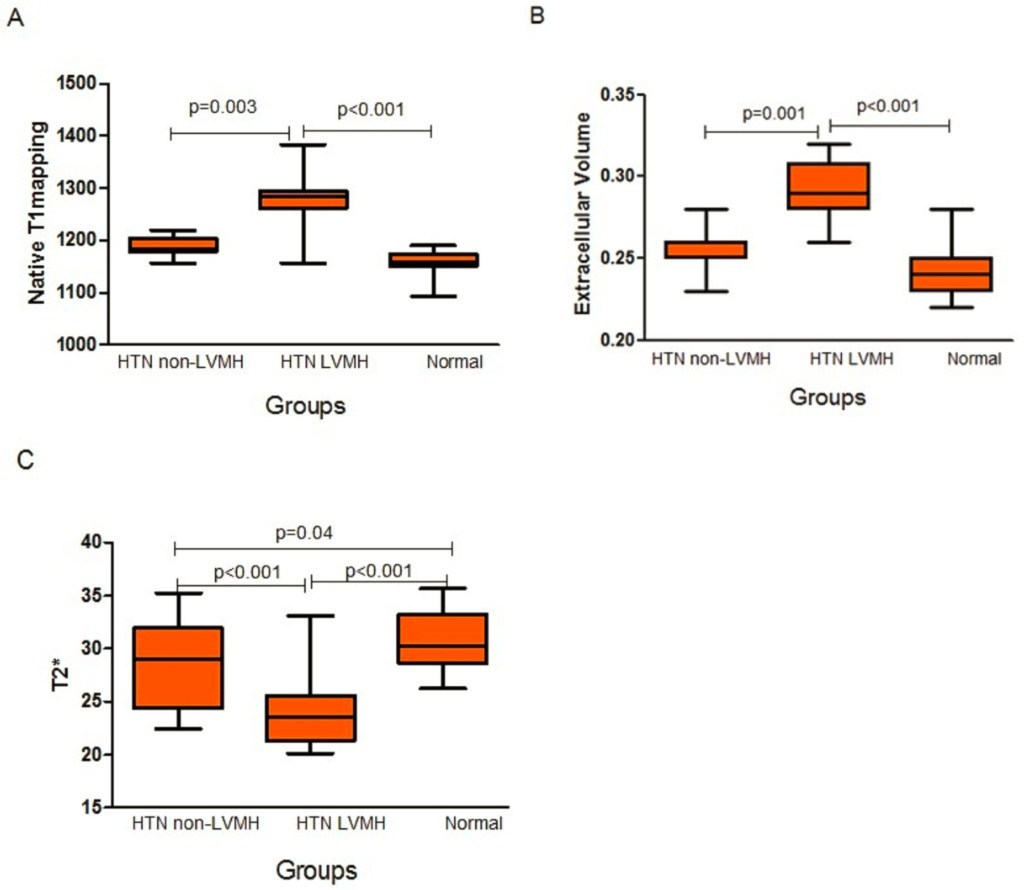
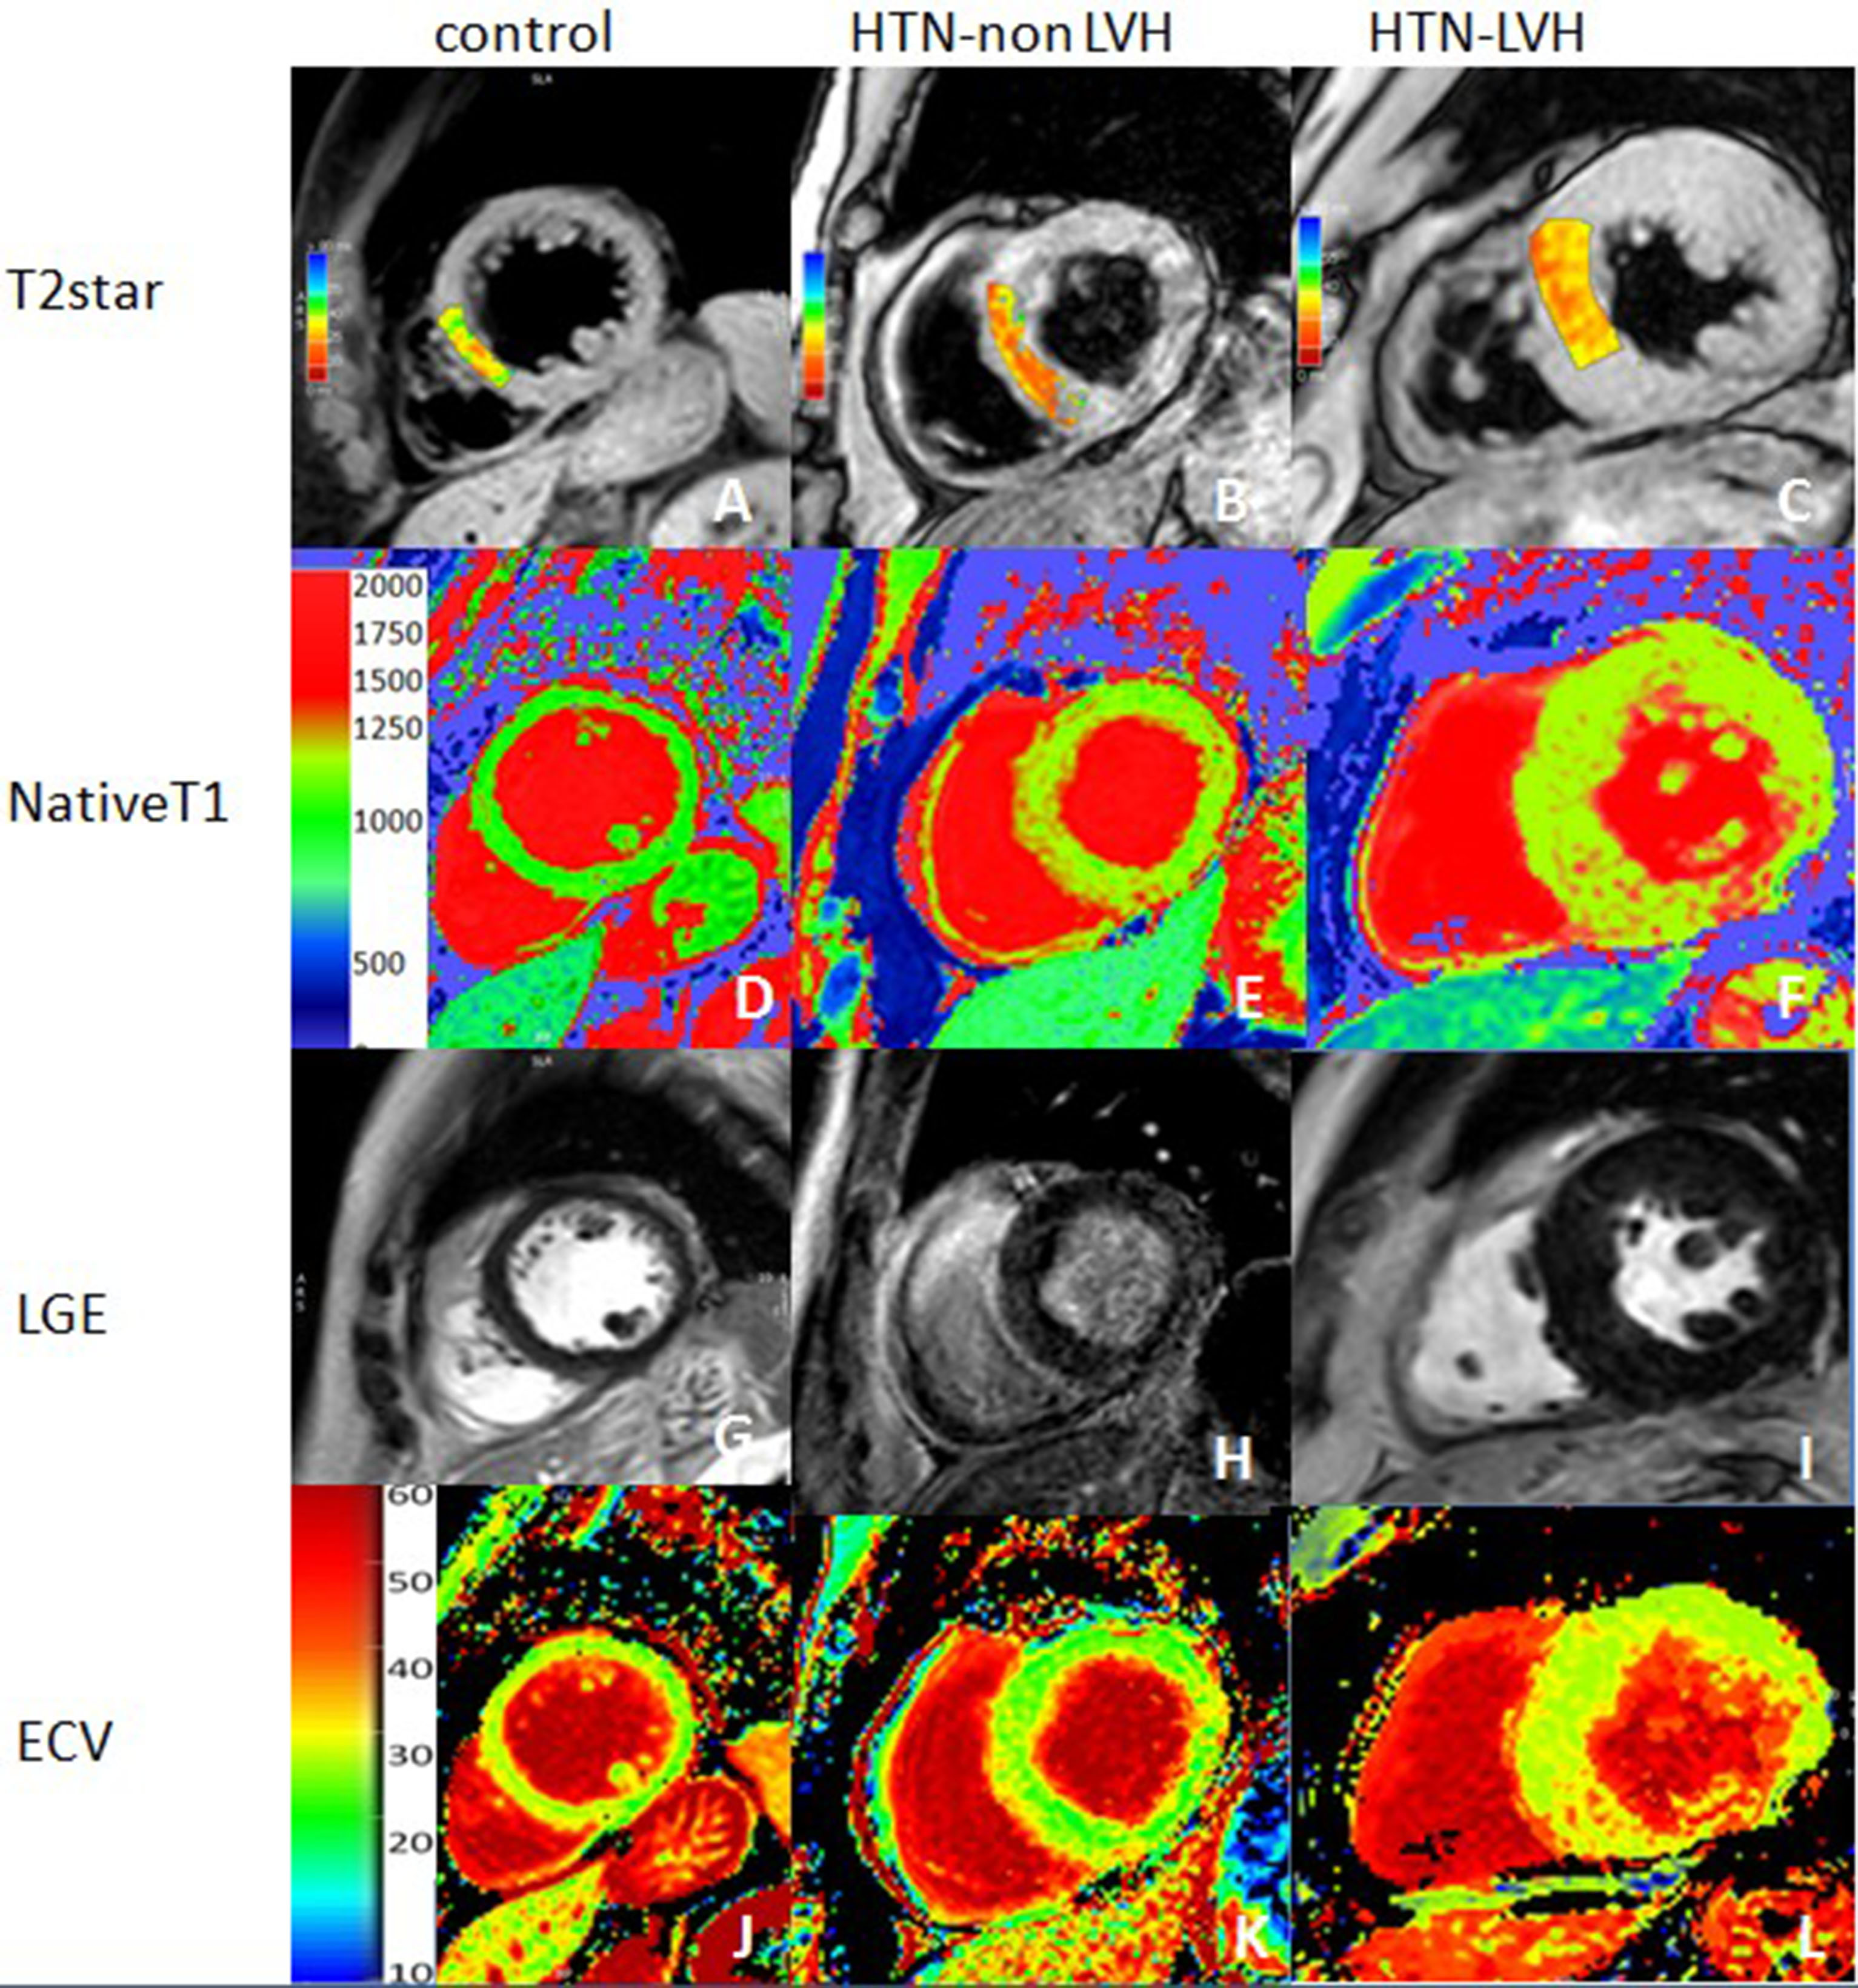
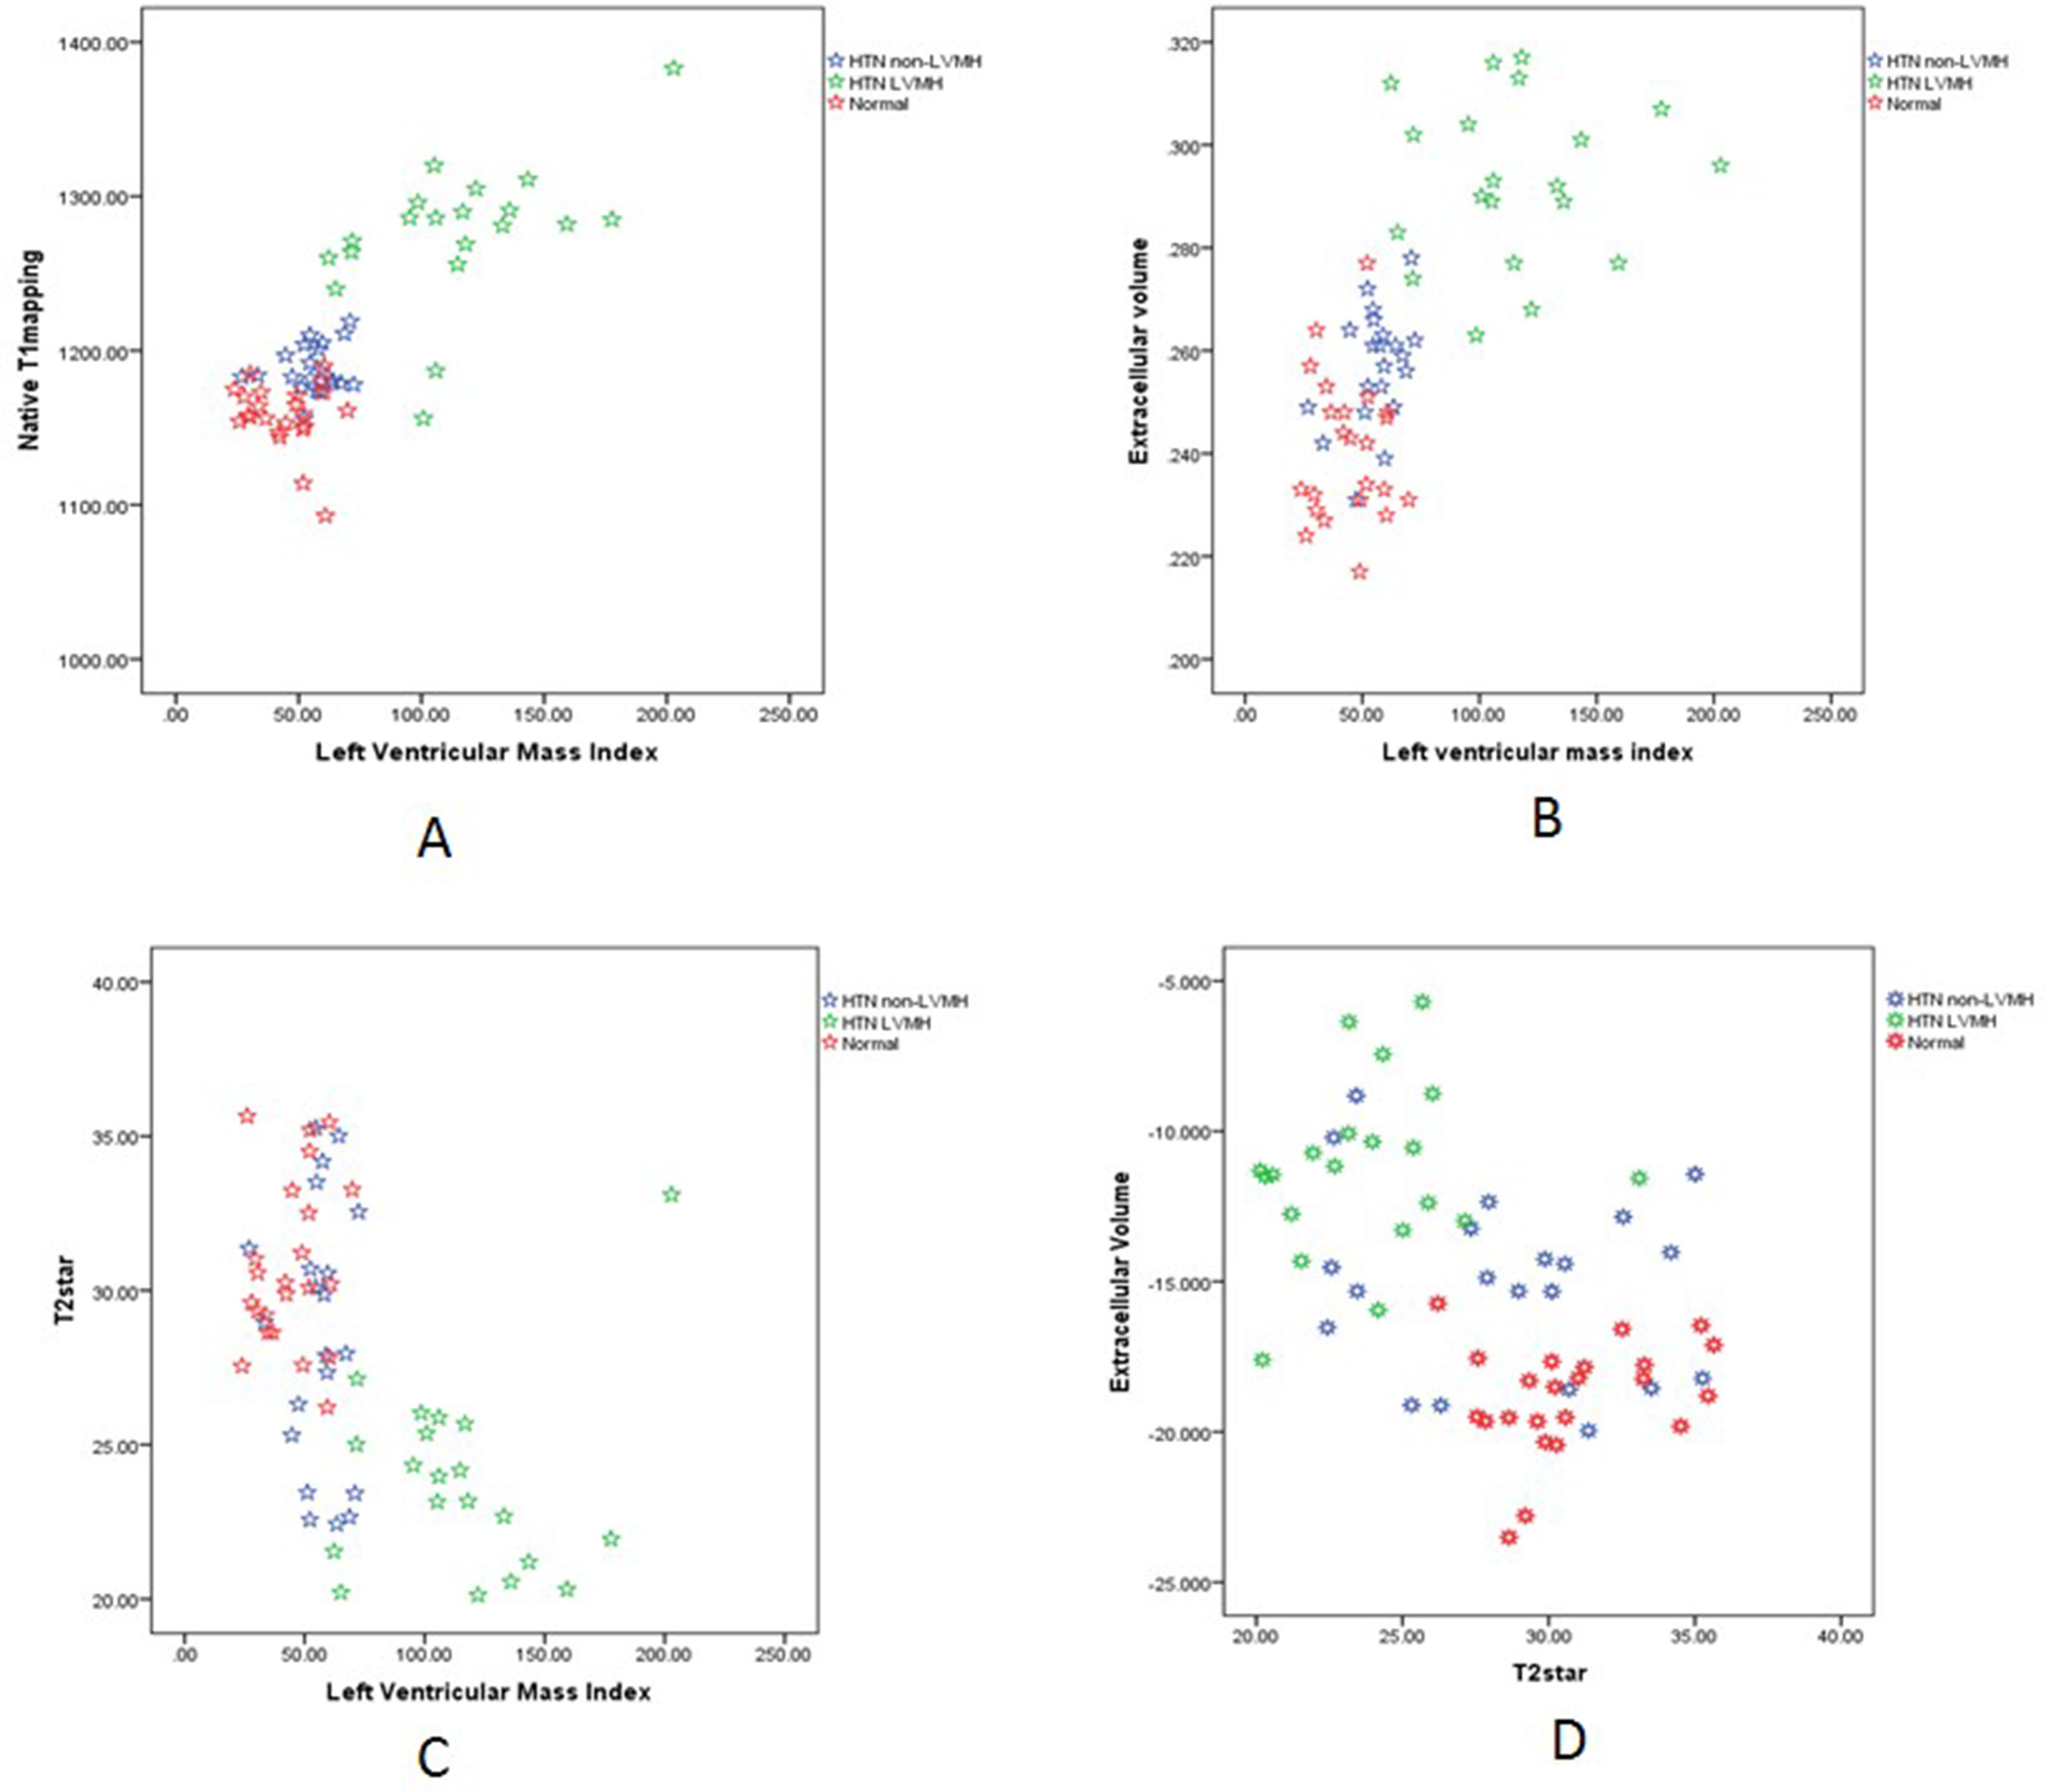
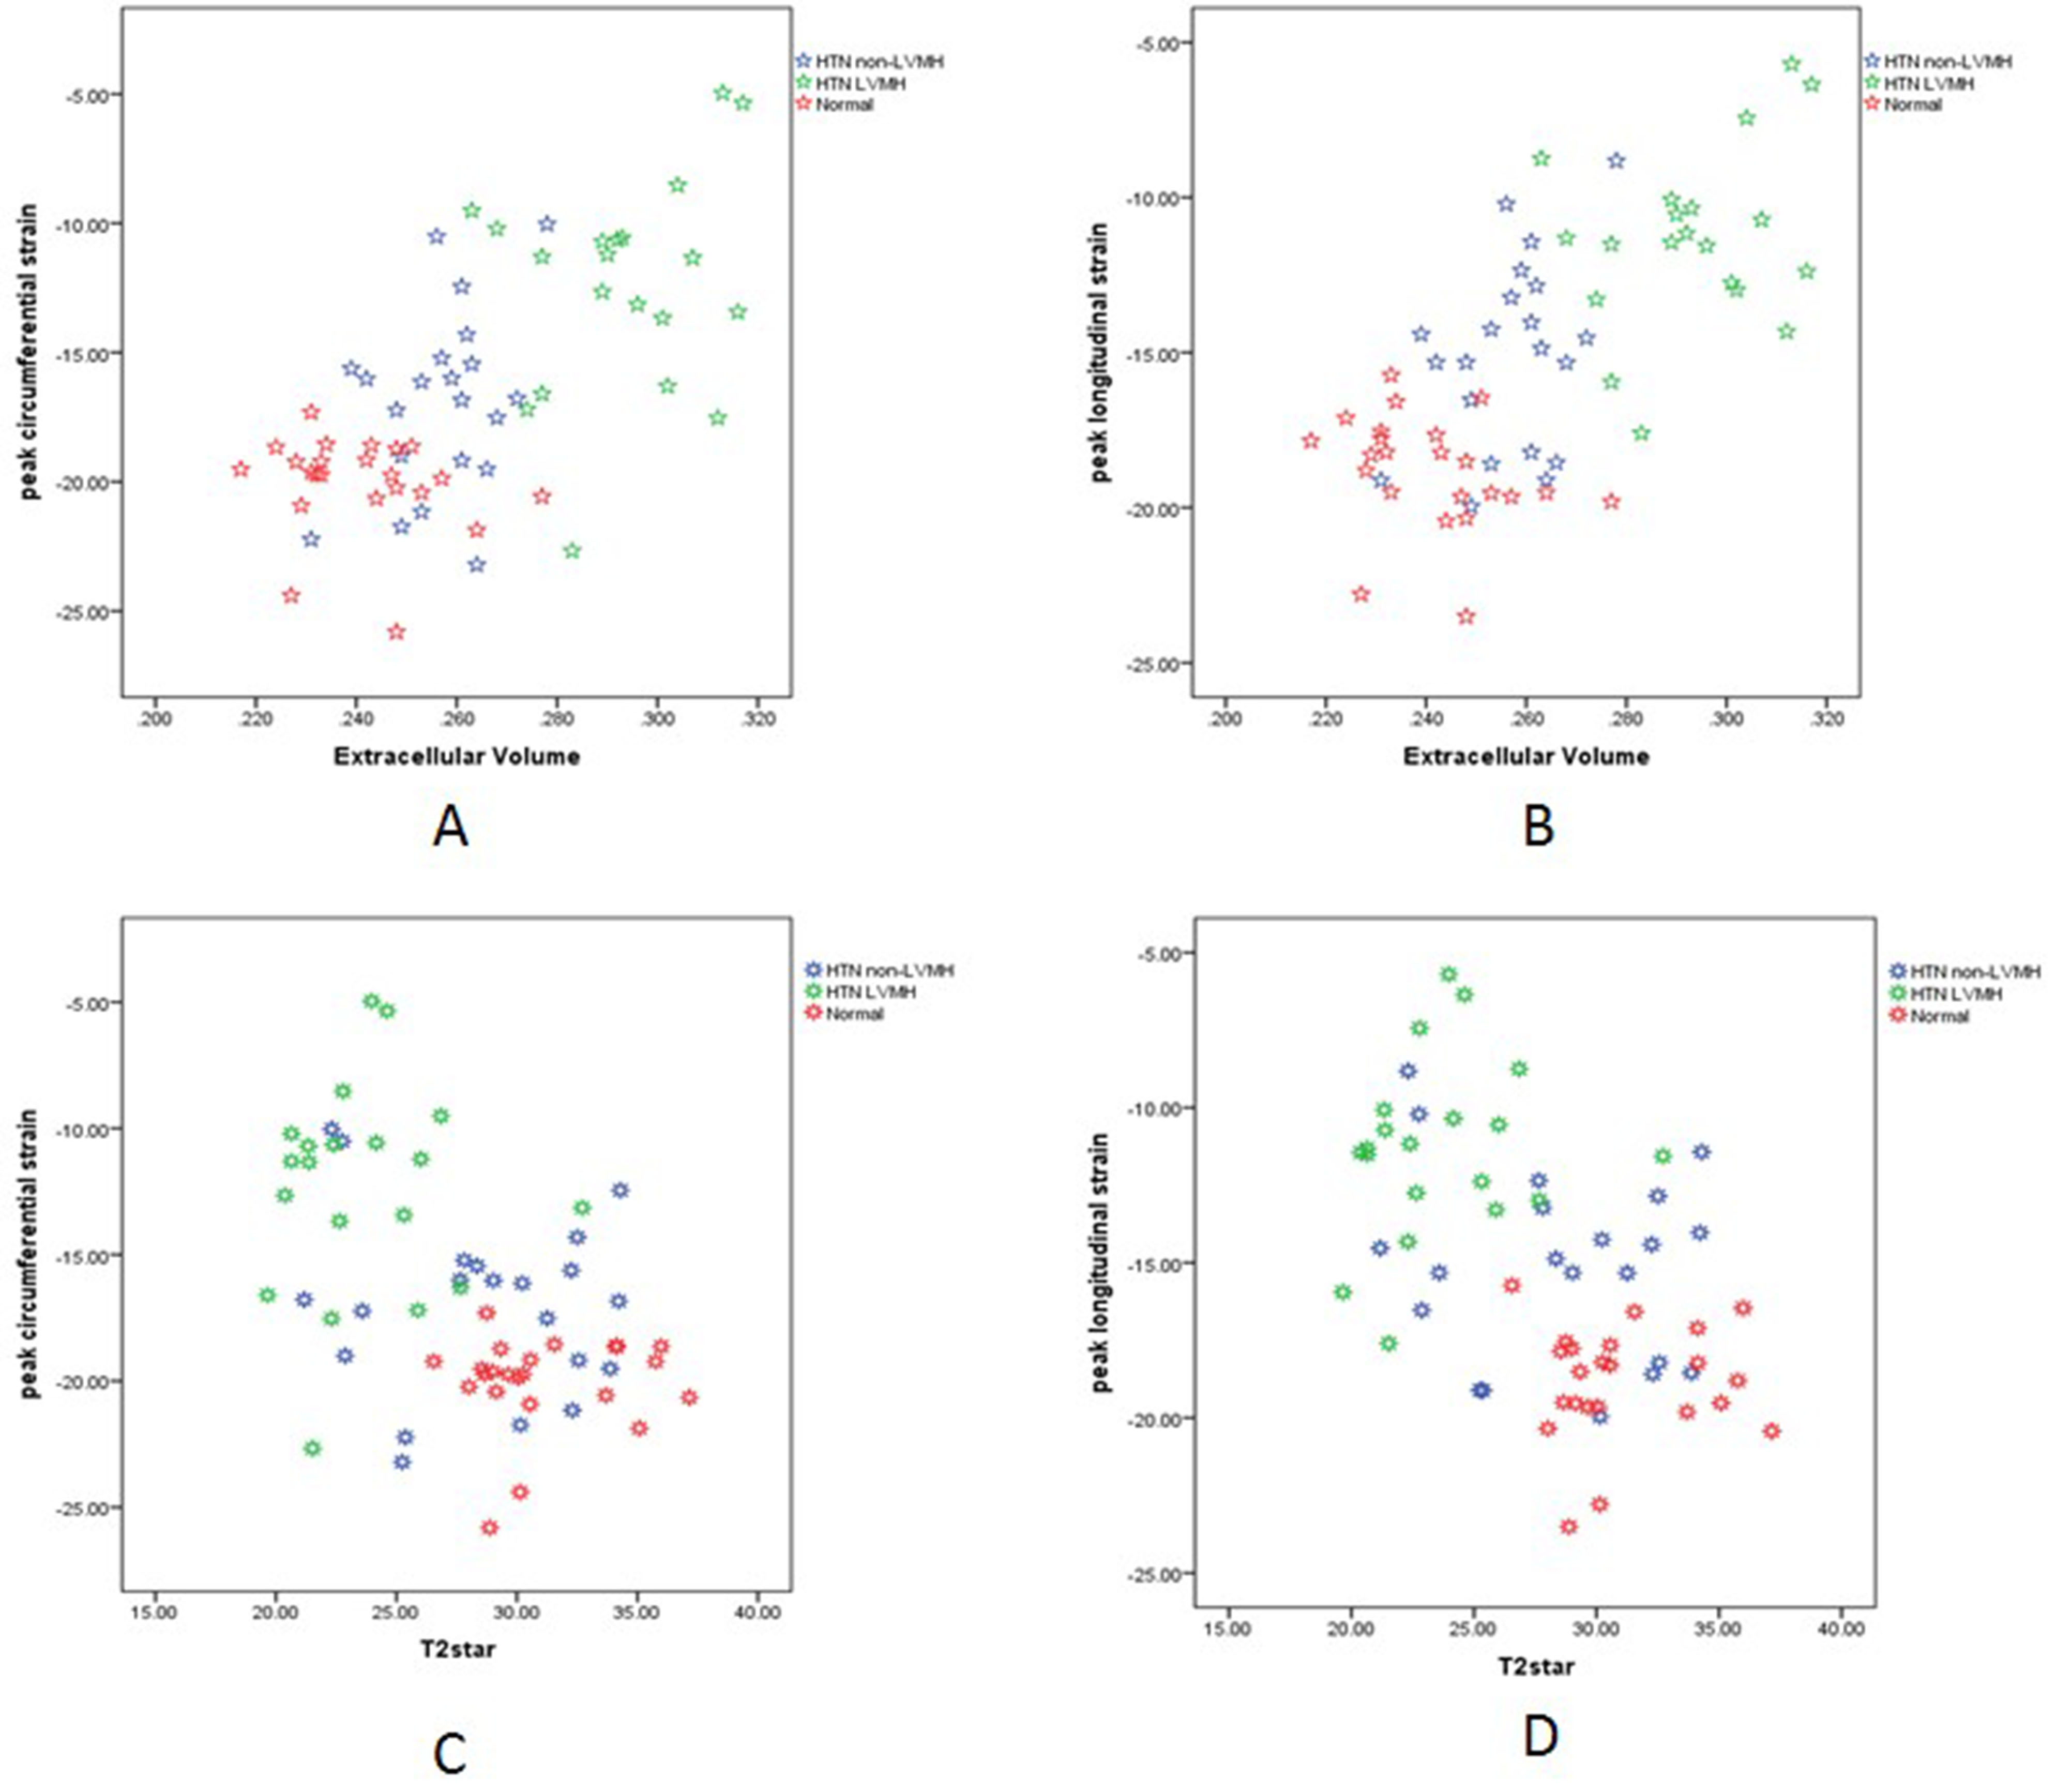
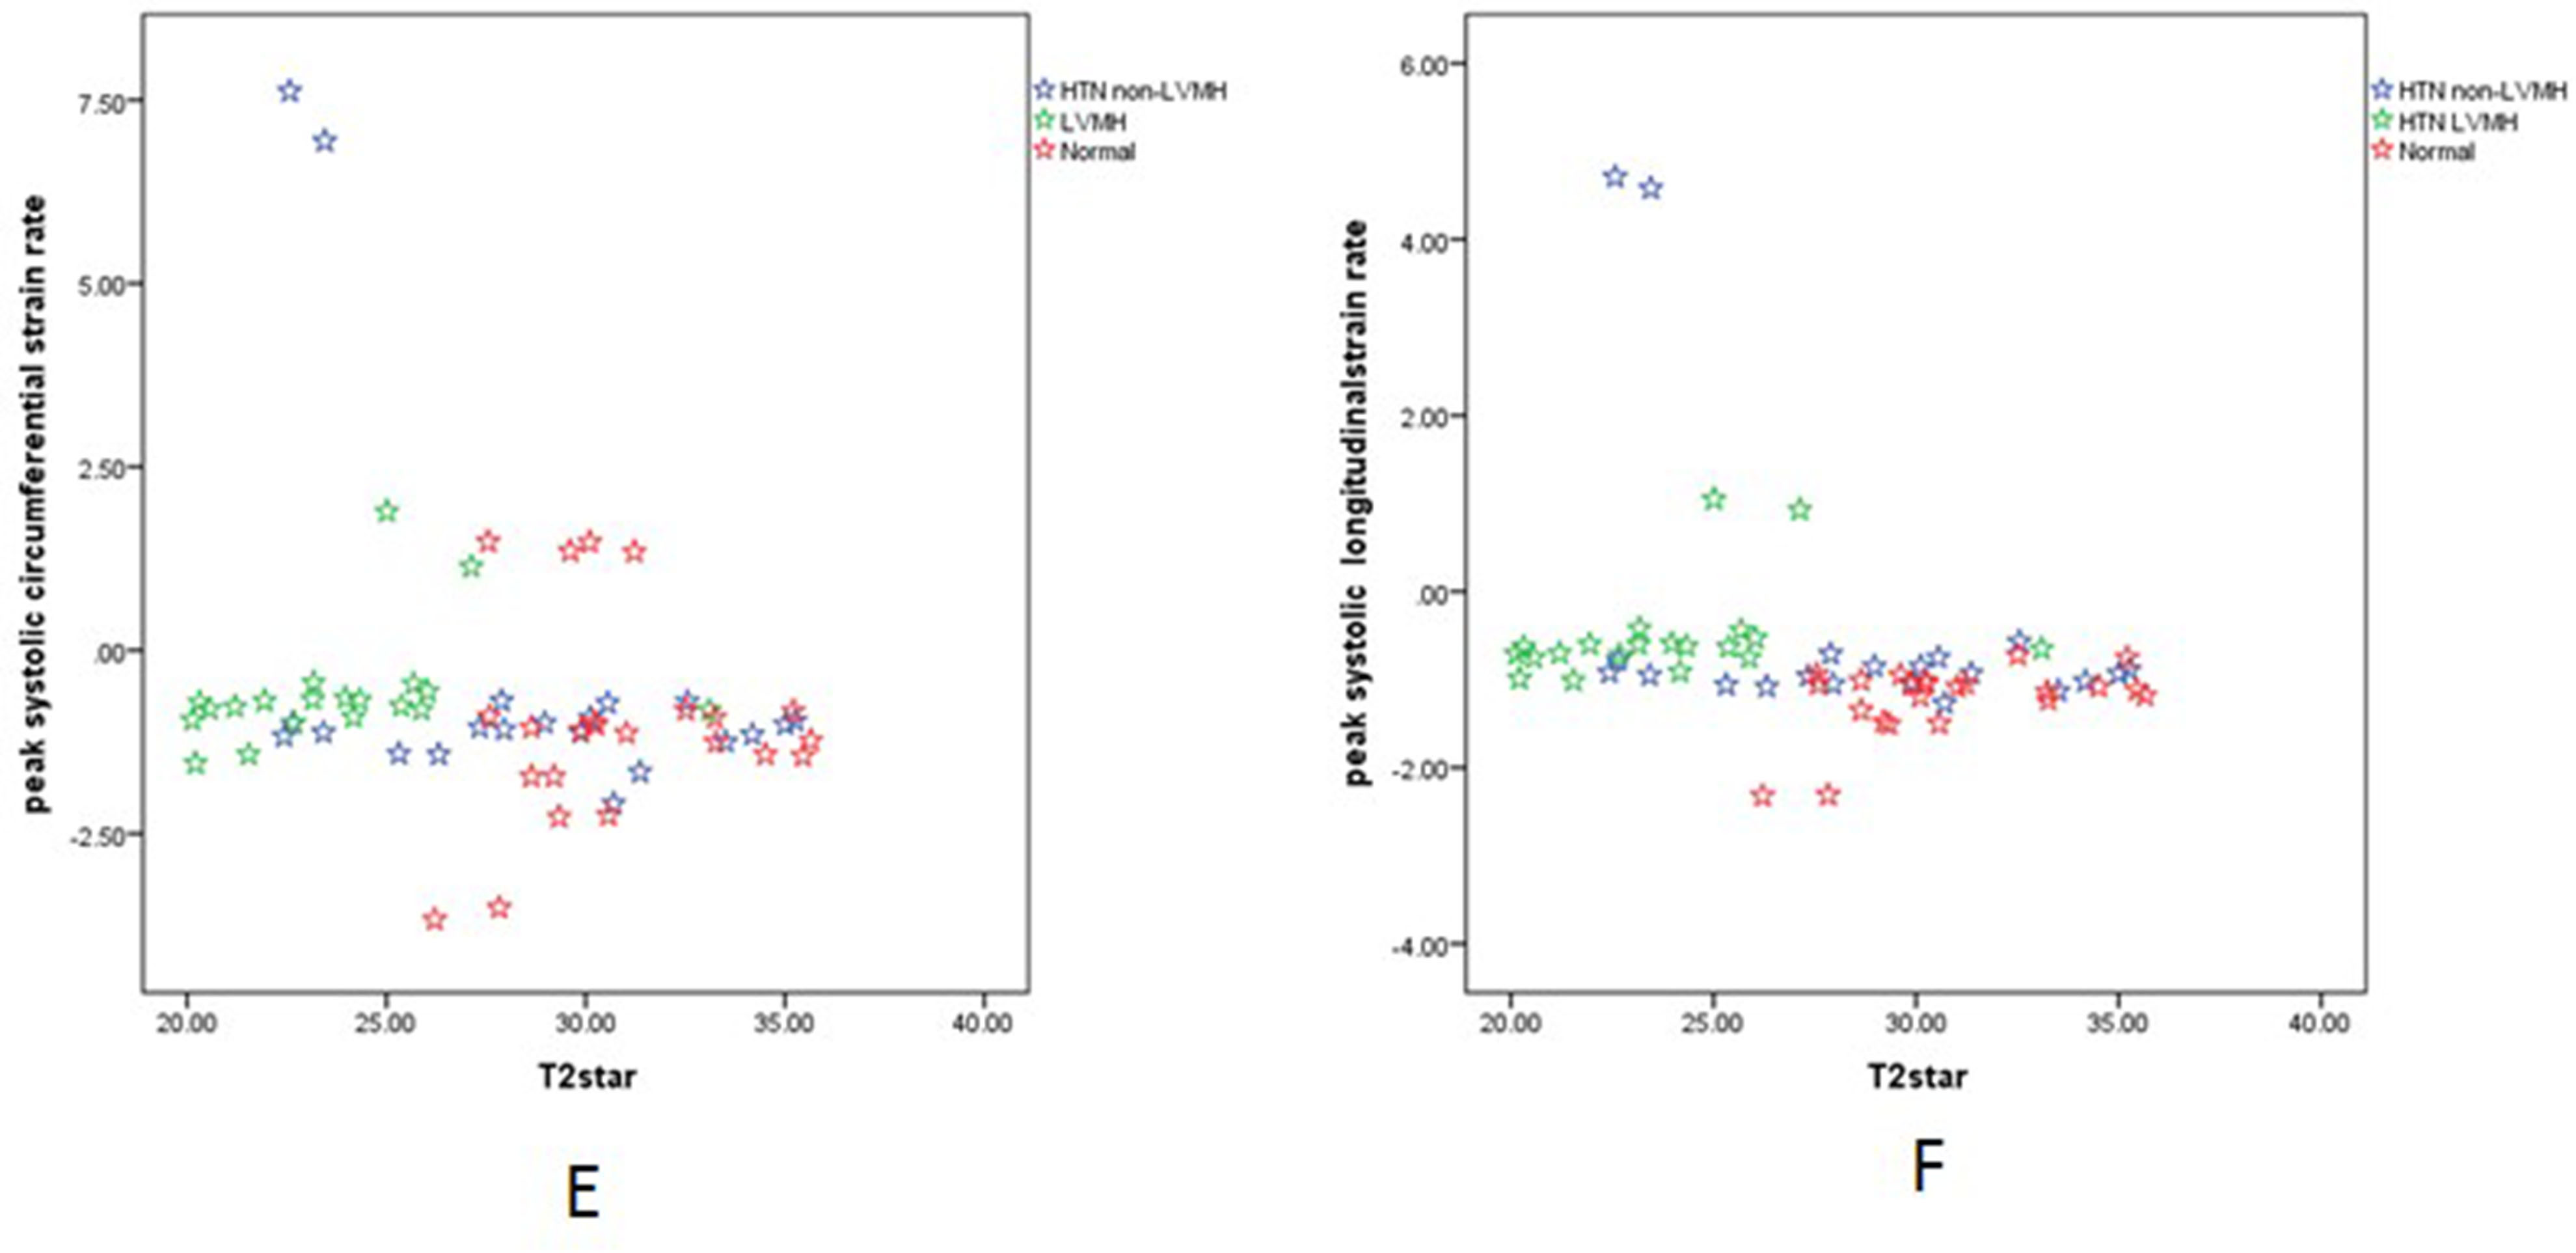
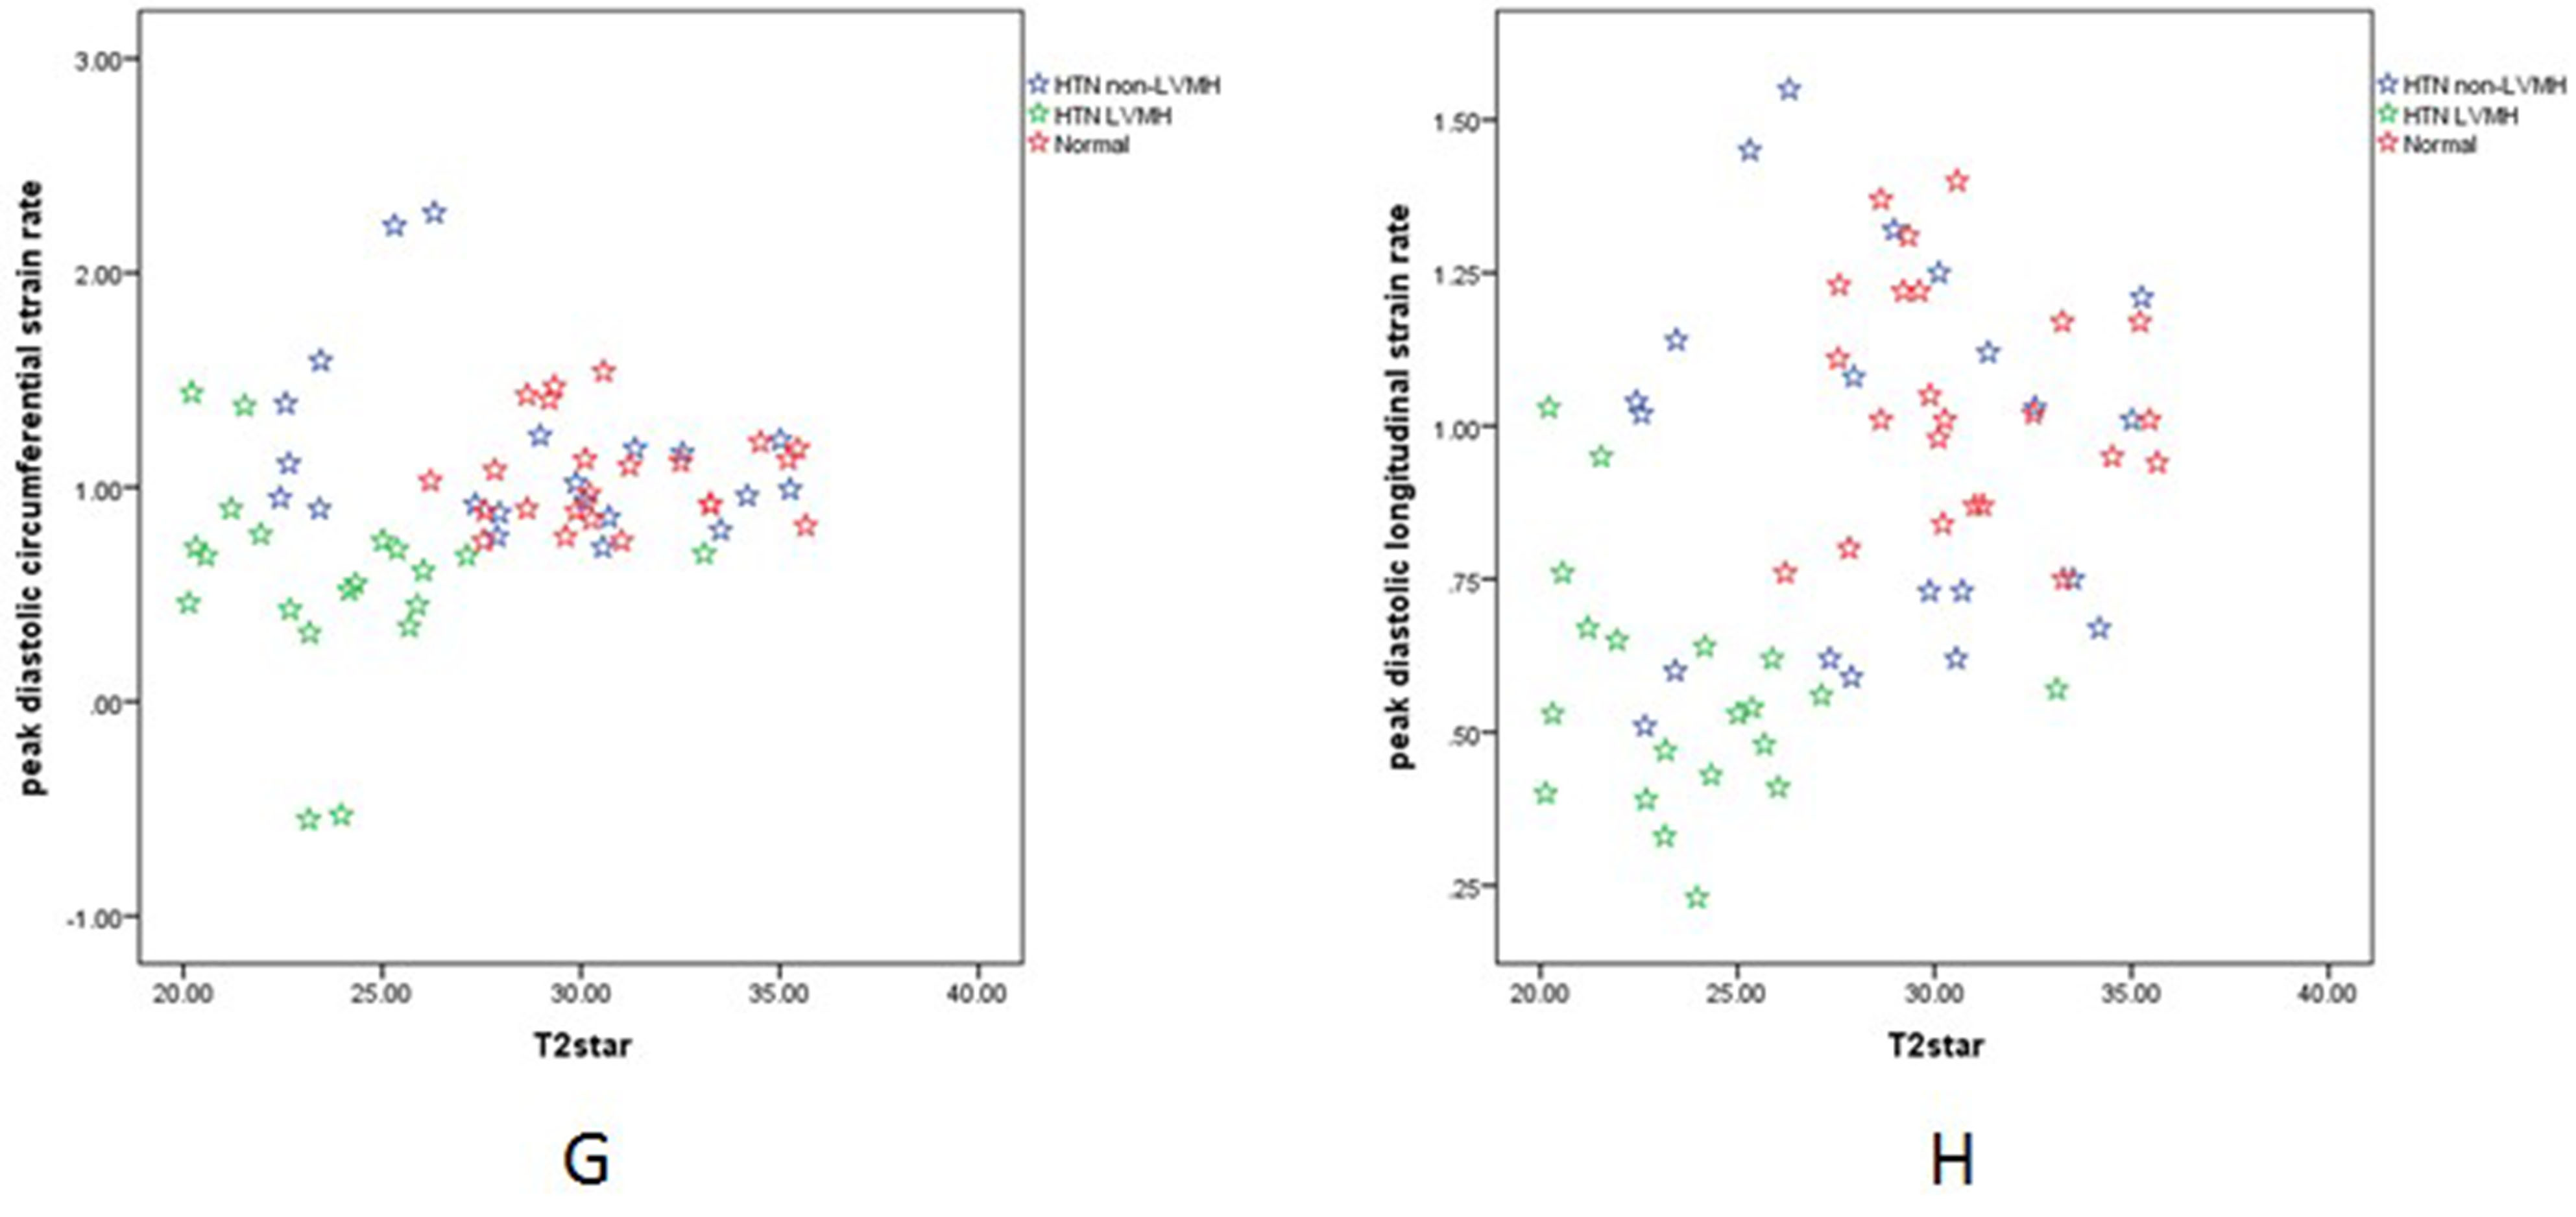
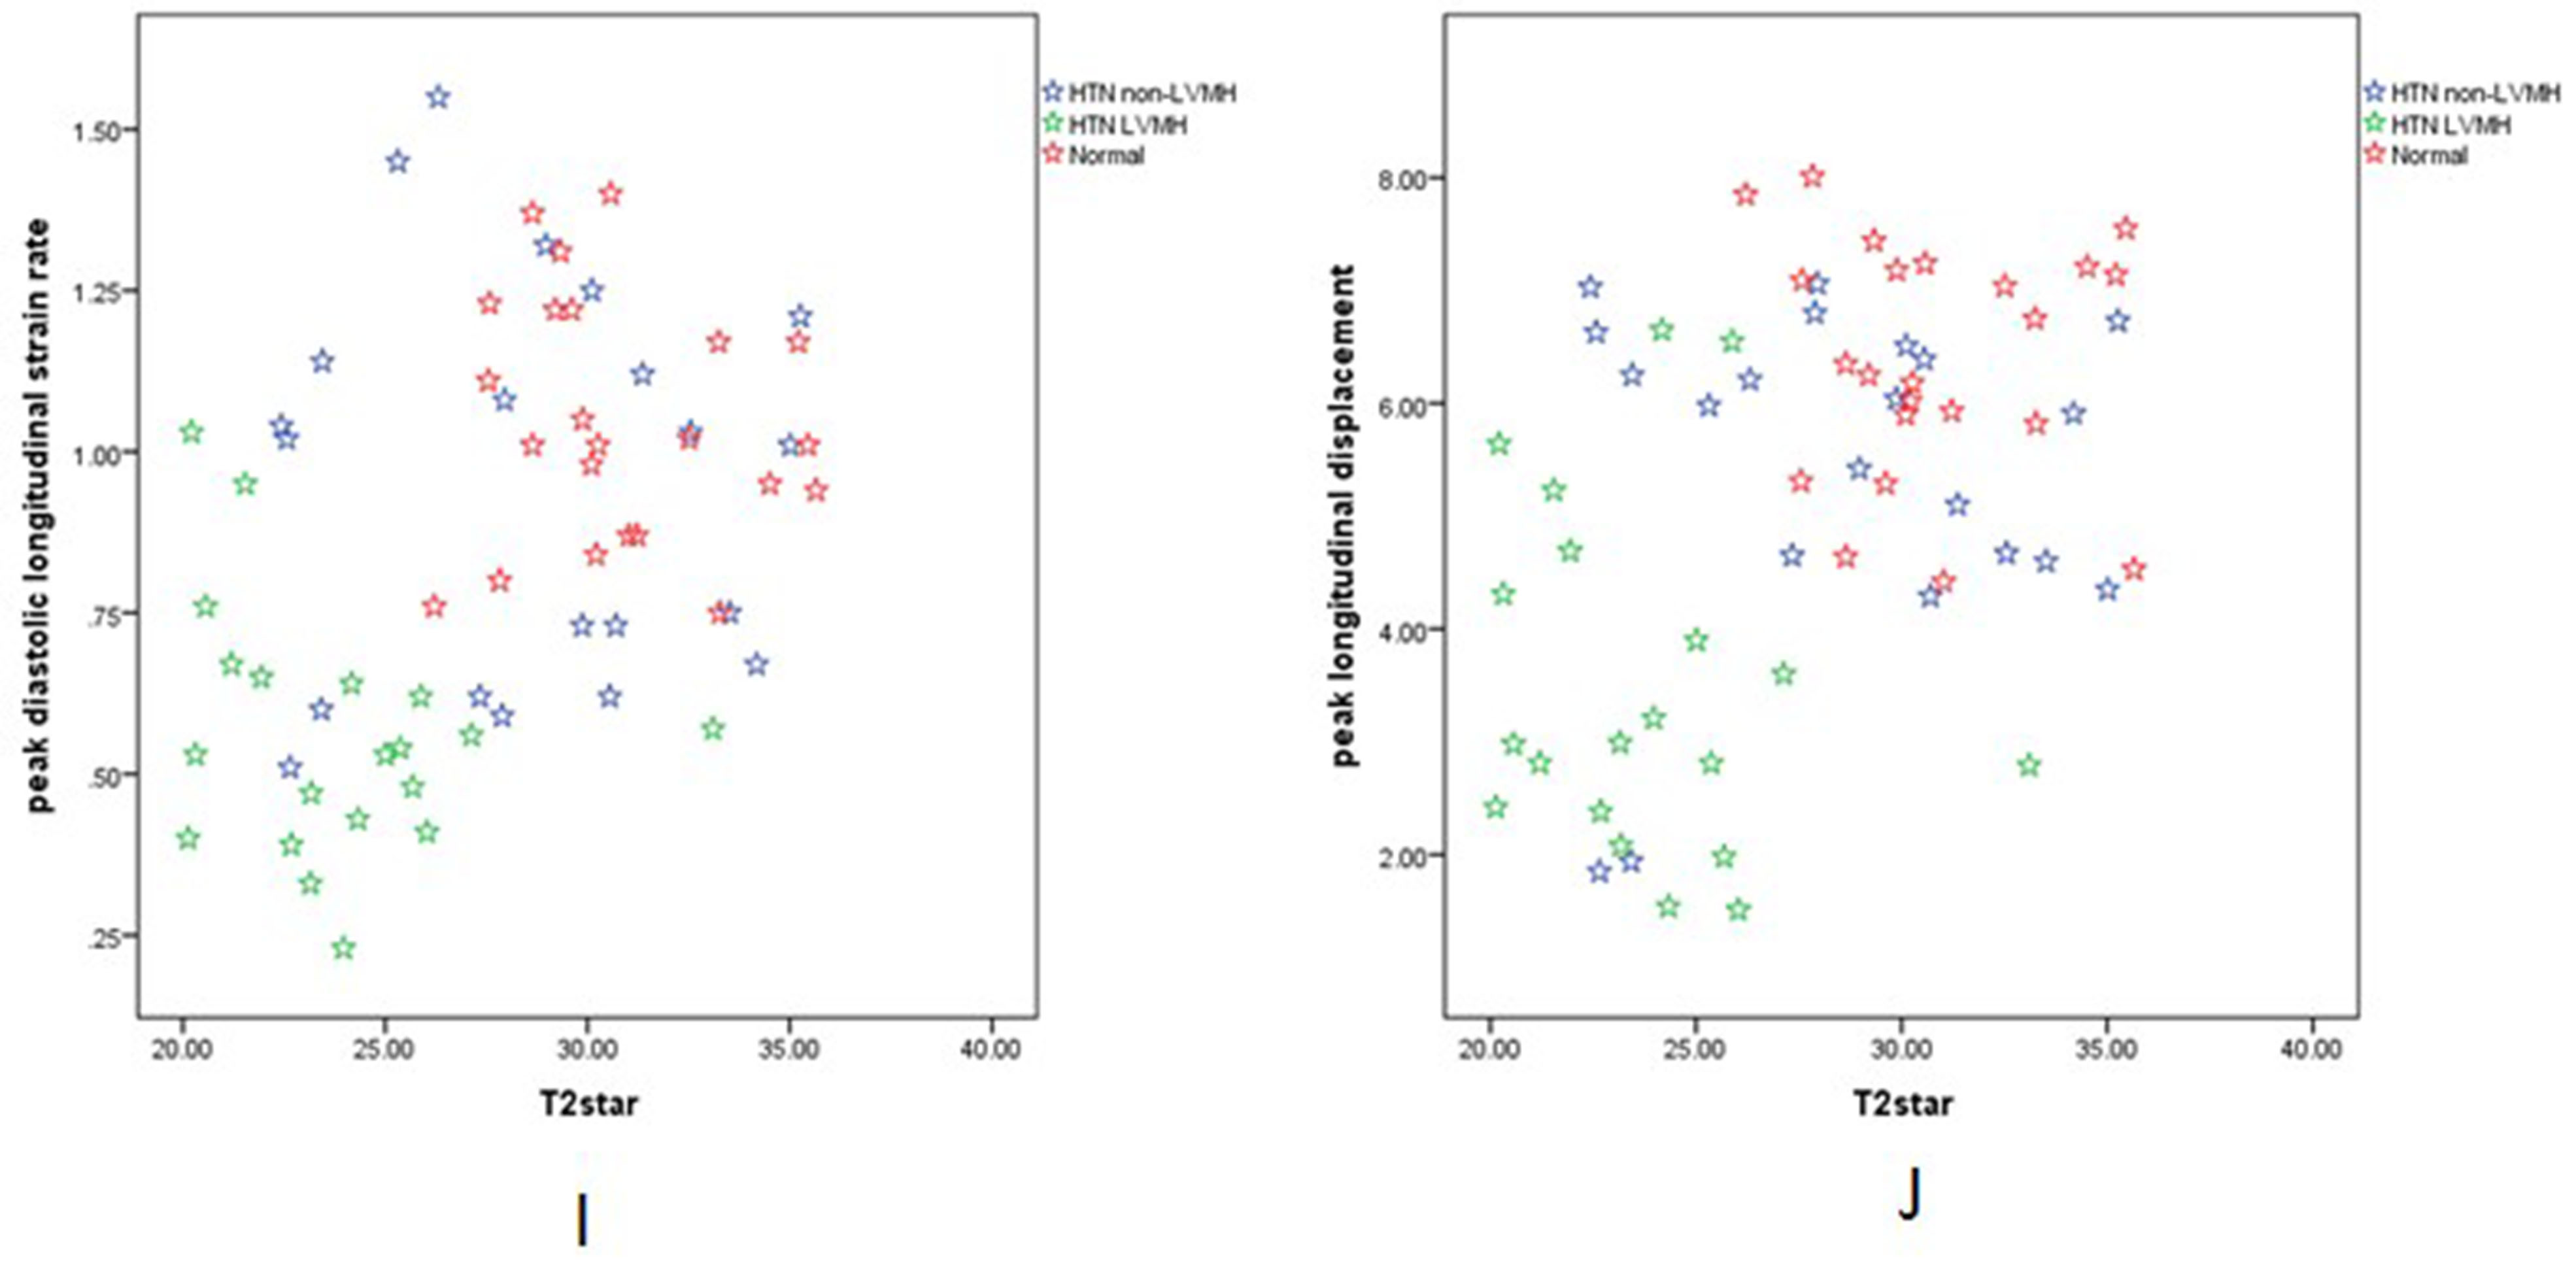
According to our study findings, BOLD MRI detected greater deoxygenated hemoglobin in HTN LVMH(measured by T2* BOLD MRI)compared with HTN non-LVMH and control groups. Lower T2* BOLD MRI values were associated with higher ECV values and correlated with reductions in circumferential and longitudinal strain, strain rate and displacement. Higher LVMI was associated with an increase in ECV and nativeT1, and a decrease inT2* BOLD MRI values. To our knowledge, this is the first study to assess the influence of myocardial oxygenation on cardiac function in hypertensive patients by applying combined T2* BOLD MRI, T1mapping and strain analysis. Assessing myocardial capillary oxygenation by BOLD MRI relies on the measurement of BOLD MRI relaxation time through endogenous contrast of deoxygenated hemoglobin. Myocardial microvascular oxygenation could reflect a balance or imbalance between oxygen supply and demand.
Abstract
Objectives: Non-invasive assessment of myocardial oxygenation by T2* Blood Oxygen Level Dependent (BOLD) imaging in hypertensive patients with left ventricular myocardial hypertrophy (HTN LVMH) and hypertensive patients without LVMH (HTN non-LVMH) and its correlation with myocardial mechanics assessed by strain analysis. Methods: A total of 64 HTN patients and normotensive participants were recruited for this study . HTN patients were separated into two separate groups based on left ventricular mass index(LVMI). Using a 3.0 Tesla scanner, dedicated T1 mapping, BOLD MRI (T2*), and strain analysis were performed. All the images were analyzed by blinded observers and comparative statistics were conducted. Results: T2* BOLD values were significantly lower in the HTN LVMH group verses the controls (23.78±3.09 vs. 30.77±2.71, p<0.001) and HTN non-LVMH group (23.78±3.09 vs. 28.64±4.23, p<0.001). T2* BOLD values of the HTN non-LVMH patients were slightly lower than that of the controls (28.64±4.23, 30.77±2.71, p=0.04). Left ventricular peak global longitudinal and circumferential strain were reduced in all HTN LVMH patients compared to the HTN non-LVMH patients and the normotensive controls. The extracellular volume (ECV) and BOLD MRI values were also correlated with the three-dimensional global circumferential strain parameters (spearman rho = 0.6, p < 0.05 and Spearman rho=-0.43, p < 0.05).ECV and BOLD MRI correlated with longitudinal strain (spearman rho=0.64, p<0.05 and Spearman rho=-0.49, p<0.05). Patients with lowerT2* BOLD values had significant decreases in longitudinal and circumferential strain, strain rate, or displacement. Conclusions:By using T2* BOLD cardiac MRI and strain analysis, we showed that HTN LVMH patients have both impaired myocardial mechanics and reduced myocardial oxygenation compared to HTN non-LVMH and normotensive groups. T2* BOLD cardiac MRI could provide a feasible parameter for detecting myocardial microvascular oxygen concentrations in patients with HTN.Acknowledgements
Supported by National Natural Science Foundation of China (Youth Program No.81401403), Shanghai Municipal Commission of Health and Family Planning excellent young talent program(No. 2017YQ031) and Shanghai Jiao Tong University Medical engineering cross fund (YG2014MS48).References
1. Writing Group M, Mozaffarian D, Benjamin EJ, et al (2016) Heart Disease and Stroke Statistics-2016 Update: A Report From the American Heart Association. Circulation 4:e38-360. 2. Rodriguez-Porcel M, Herrman J, Chade AR, et al (2004) Long-term antioxidant intervention improves myocardial microvascular function in experimental hypertension. Hypertension 2:493-8. 3. Sironi AM, Pingitore A, Ghione S, et al (2008) Early hypertension is associated with reduced regional cardiac function, insulin resistance, epicardial, and visceral fat. Hypertension 2:282-8. 4. Lin J, Zhu X, Chade AR, et al (2009) Monocyte chemoattractant proteins mediate myocardial microvascular dysfunction in swine renovascular hypertension. Arteriosclerosis, thrombosis, and vascular biology 11:1810-6. 5. Reddy HK, Campbell SE, Janicki JS, et al (1993) Coronary microvascular fluid flux and permeability: influence of angiotensin II, aldosterone, and acute arterial hypertension. The Journal of laboratory and clinical medicine 3:510-21. 6. Mather AN, Fairbairn TA, Ball SG, et al (2011) Reperfusion haemorrhage as determined by cardiovascular MRI is a predictor of adverse left ventricular remodelling and markers of late arrhythmic risk. Heart 6:453-9. 7. Friedrich MG, Karamitsos TD (2013) Oxygenation-sensitive cardiovascular magnetic resonance. Journal of cardiovascular magnetic resonance : official journal of the Society for Cardiovascular Magnetic Resonance 43. 8. Pepe A, Meloni A, Rossi G, et al (2017) Prediction of cardiac complications for thalassemia major in the widespread cardiac magnetic resonance era: a prospective multicentre study by a multi-parametric approach. European heart journal cardiovascular Imaging. 9. Kondur AK, Li T, Vaitkevicius P, et al (2009) Quantification of myocardial iron overload by cardiovascular magnetic resonance imaging T2* and review of the literature. Clinical cardiology 6:E55-9. 10. Pickering TG, Hall JE, Appel LJ, et al (2005) Recommendations for blood pressure measurement in humans and experimental animals: part 1: blood pressure measurement in humans: a statement for professionals from the Subcommittee of Professional and Public Education of the American Heart Association Council on High Blood Pressure Research. Circulation 5:697-716. 11. Olivotto I, Maron MS, Autore C, et al (2008) Assessment and significance of left ventricular mass by cardiovascular magnetic resonance in hypertrophic cardiomyopathy. Journal of the American College of Cardiology 7:559-66. 12. Sado DM, Maestrini V, Piechnik SK, et al (2014) Noncontrast myocardial T1 mapping using cardiovascular magnetic resonance for iron overload. Journal of Magnetic Resonance Imaging. 13. van Ooij P, Allen BD, Contaldi C, et al (2016) 4D flow MRI and T1 -Mapping: Assessment of altered cardiac hemodynamics and extracellular volume fraction in hypertrophic cardiomyopathy. Journal of magnetic resonance imaging : JMRI 1:107-14. 14. Scatteia A, Baritussio A, Bucciarelli-Ducci C (2017) Strain imaging using cardiac magnetic resonance. Heart failure reviews 4:465-76. 15. Feigl EO (1983) Coronary physiology. Physiological reviews 1:1-205. 16. Geltman EM, Henes CG, Senneff MJ, et al (1990) Increased myocardial perfusion at rest and diminished perfusion reserve in patients with angina and angiographically normal coronary arteries. Journal of the American College of Cardiology 3:586-95. 17. Treasure CB, Klein JL, Vita JA, et al (1993) Hypertension and left ventricular hypertrophy are associated with impaired endothelium-mediated relaxation in human coronary resistance vessels. Circulation 1:86-93. 18. Gradman AH, Alfayoumi F (2006) From left ventricular hypertrophy to congestive heart failure: management of hypertensive heart disease. Progress in cardiovascular diseases 5:326-41. 19. Kirk P, He T, Anderson LJ, et al (2010) International reproducibility of single breathhold T2* MR for cardiac and liver iron assessment among five thalassemia centers. Journal of magnetic resonance imaging : JMRI 2:315-9. 20. Carpenter JP, He T, Kirk P, et al (2011) On T2* magnetic resonance and cardiac iron. Circulation 14:1519-28. 21. Levy D, Larson MG, Vasan RS, et al (1996) The progression from hypertension to congestive heart failure. JAMA : the journal of the American Medical Association 20:1557-62. 22. Rossi MA (1998) Pathologic fibrosis and connective tissue matrix in left ventricular hypertrophy due to chronic arterial hypertension in humans. Journal of hypertension 7:1031-41. 23. Querejeta R, Varo N, Lopez B, et al (2000) Serum carboxy-terminal propeptide of procollagen type I is a marker of myocardial fibrosis in hypertensive heart disease. Circulation 14:1729-35. 24. Anderson LJ, Holden S, Davis B, et al (2001) Cardiovascular T2-star (T2*) magnetic resonance for the early diagnosis of myocardial iron overload. European heart journal 23:2171-9. 25. Tucci M, Quatraro C, Frassanito MA, et al (2006) Deregulated expression of monocyte chemoattractant protein-1 (MCP-1) in arterial hypertension: role in endothelial inflammation and atheromasia. Journal of hypertension 7:1307-18. 26. Kass DA (2005) Ventricular arterial stiffening: integrating the pathophysiology. Hypertension 1:185-93. 27. Garceau P, Nguyen ET, Carasso S, et al (2011) Quantification of myocardial iron deposition by two-dimensional speckle tracking in patients with beta-thalassaemia major and Blackfan-Diamond anaemia. Heart 5:388-93. 28. Marsella M, Borgna-Pignatti C, Meloni A, et al (2011) Cardiac iron and cardiac disease in males and females with transfusion-dependent thalassemia major: a T2* magnetic resonance imaging study. Haematologica 4:515-20. 29. Leonardi B, Margossian R, Colan SD, et al (2008) Relationship of magnetic resonance imaging estimation of myocardial iron to left ventricular systolic and diastolic function in thalassemia. JACC Cardiovascular imaging 5:572-8.Figures