2950
Bias in the assessment of left ventricular function with compressed sensing CINE MRI1Electrical Engineering, Kwangwoon University, Seoul, Republic of Korea, 2Radiology, Severance Hospital, Yonsei University College of Medicine, Seoul, Republic of Korea, 3Brain Research Laboratory, Children’s National Health System, Washington, DC, United States
Synopsis
We report that a bias in the assessment of left ventricular function (LVF) is due to the compressed sensing (CS) CINE. In cardiac CINE MRI EDV (or ESV) is assessed when blood volume is a maximum (or a minimum). Practically a time window (given by VPS) is used to reduce scan time. For CS-CINE the time window is expanded by adopting data at nearby cardiac frames. The expanded acquisition window reduces EDV and increases ESV due to time average effect. Note that the changes of the quantities are not random, thus they should be removed for a better diagnosis.
Introduction
Cardiac CINE MRI has been recognized as an accurate noninvasive method to assess three-dimensional left ventricular function (LVF). Compressed sensing (CS) and parallel imaging are useful techniques to reduce scan time, yet to maintain high quality cardiac images without high power and high slew rate gradient systems. They have been successfully applied to cardiac CINE imaging. Some previous studies reported biases in LVF with CS-CINE method during Bland-Altman analysis; however, the biases were often attributed to experimental and physiological variations. In this paper, we investigated that the bias is due to CS-CINE.Methods
Assessment of LVF was tried using subsampled data from full data acquired without compressed sensing. Cardiac CINE MRI with a short axis view was acquired at 3.0T MRI system (Siemens). A segmented CINE imaging with a balanced SSFP sequence was employed with parameters: TR = 3.88ms, TE = 1.94ms, VPS = 8, transverse resolution = 1.37mm x 1.37mm, slice thickness = 8mm, number of slices = 12, FOV = 350mm x 350mm. SENSE factor of 2 was used throughout the experiments. Eight healthy volunteers (7 male and 1 female, Age=24.9±2.09, BMI=22.0+1.66 kg/m2) were participated for the experiments.
Four subsampled data set was obtained with compression factor (CF) = 2, 3, 4, and 8, by which variations of end-diastolic volume (EDV) and end-systolic volume (ESV) due to temporal resolution and localization of selection plane can be excluded.
Three CS methods were employed for the analysis: FOCUSS,1 ITSC,2 and view sharing. Each CS method has its own sampling strategy. Only even locations of the phase encoding gradient were chosen to facilitate parallel imaging (SENSE factor=2). Once the reconstruction for CS is done, folded images are obtained, which are unfolded by SENSE reconstruction as shown in Fig.1 in all the three methods.3
We used our own segmentation program to eliminate human-dependent variation in the segmentation of blood volume. By two-stage segmentation (coarse and refined) most of voxels in the myocardium and the blood in ventricle are used in the calculation of the threshold, thereby initial seed positions are not critical in the segmentation.
Results
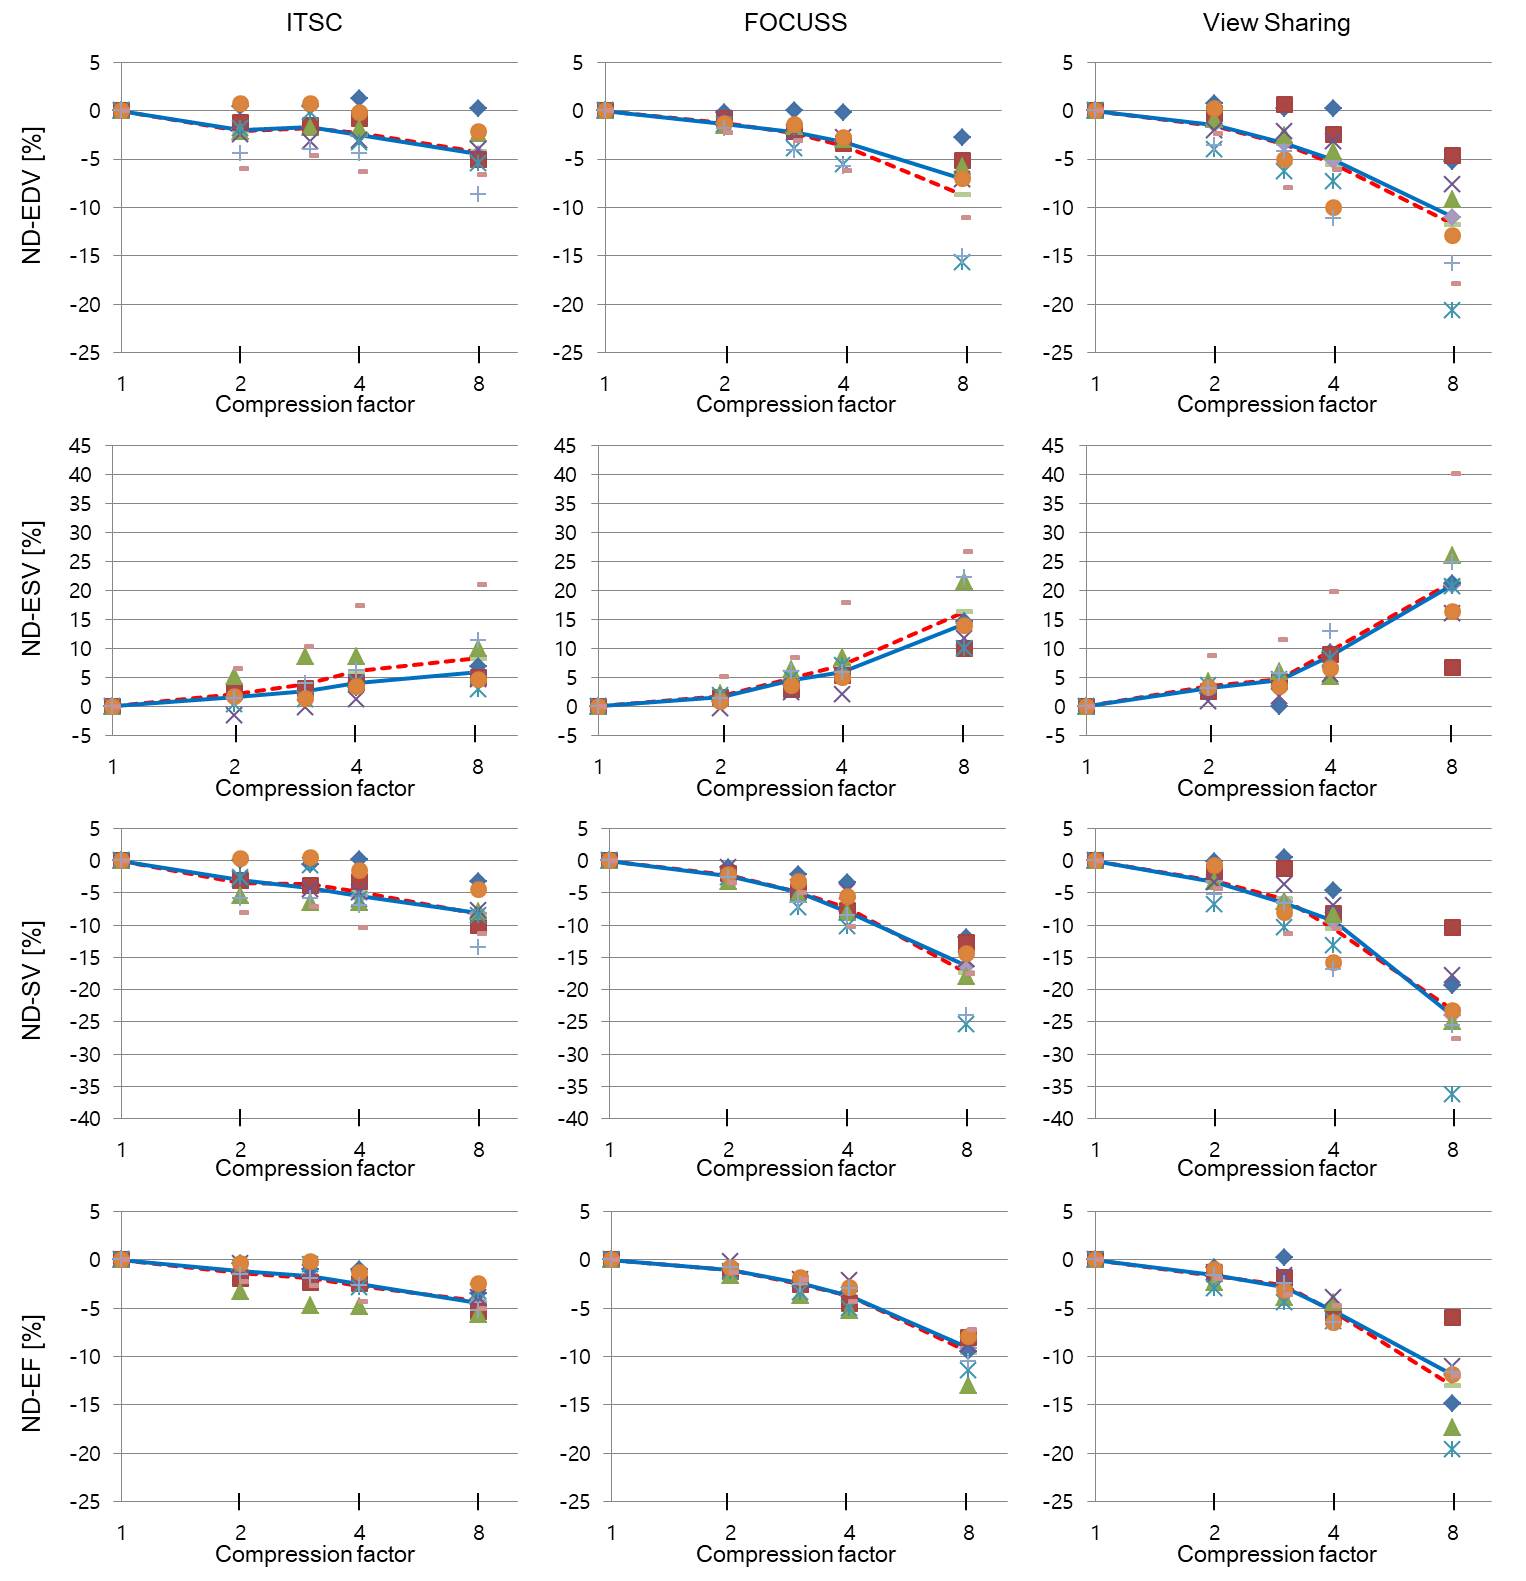
Assessments of EDV, ESV, stroke volume (SV), and ejection fraction (EF) were made for the subsampled data sets. The assessments without CS (CF = 1) were chosen as the reference. Normalized difference (ND) of a quantity is defined as the difference between the quantities assessed by CS-CINE and standard-CINE divided by the reference given by
$$ ND_{Q}=\frac{Q_{cs}-Q_{ref}}{Q_{ref}}\times100 $$
The ND for EDV, ESV, SV, and EF were plotted as a function of CF in Fig.2 for 8 volunteers. Average and median values of ND were also shown in broken and solid lines. As seen in Fig.2 average and median values of ND for EDV, SV, and EF are decreased as CF increases, while those of ESV are increased with increasing CF. Since SV is given by EDV-ESV, SV is decreased more rapidly as CF increases. EF is given by SV/EDV, and both SV and EDV are decreased, however, SV is more decreased than EDV, thus EF is decreased with increased CF. The trends are consistent regardless of the CS methods. As seen in Fig. 2, the median value of ND for EDV ranged from -1.4% to -7.1%, ESV +1.6% ~ +14.3%, SV -2.4% ~ -16.4%, and EF -1.1% ~ -9.2% for CF from 2 to 8 for ITSC and FOCUSS. The view sharing method shows much larger ND than the above methods. The average values of ND were mostly slightly larger than the median values. The p value for null hypothesis (the probability that the mean difference of ND between CS and standard methods are due to random sampling, not by a systematic reason or bias) were much less than 5%. Thus the null hypothesis should be rejected.
Conclusion
The biases in the assessment of LVF due to CS-CINE were investigated. Loss of temporal resolution by adopting data from nearby cardiac frames causes an underestimation of EDV and an overestimation of ESV, resulting in underestimations of SV and EF. The biases in LVF can be as large as -9% for EF, and -16% for SV, which could affect diagnosis.4,5 There exist physiological and experimental variations in the assessment of LVF, which could exceed the bias, however, the bias is not a random quantity; therefore a better estimation of LVF can be achieved by removing the bias.Acknowledgements
This work was supported by the National Research Foundation of Korea (NRF) grant funded by the Korea government (MSIP) (NRF-2015R1A2A2A03005089). The present research has also been conducted by the research grant of Kwangwoon University in 2017.References
- Jung H, Ye JC. Motion estimated and compensated compressed sensing dynamic magnetic resonance imaging: What we can learn from video compression techniques. Int J Imaging Syst Technol 2010;20(2):81-98.
- Park J, Hong H, Yang Y, Ahn C. Fast
cardiac CINE MRI by iterative truncation of small transformed coefficients.
Investigative Magnetic Resonance Imaging 2015;19(1):19-30.
- Pruessmann KP, Weiger M, Scheidegger MB, Boesiger P. SENSE: Sensitivity encoding for fast MRI. Magnetic resonance in medicine 1999;42(5):952-62.
- Lang RM, Bierig M, Devereux RB, Flachskampf FA, Foster E, Pellikka PA, Picard MH, Roman MJ, Seward J, Shanewise J. Recommendations for chamber quantification. European journal of echocardiography 2006;7(2):79-108.
- Lang RM, Badano LP, Mor-Avi V, Afilalo J, Armstrong A, Ernande L, Flachskampf FA, Foster E, Goldstein SA, Kuznetsova T. Recommendations for cardiac chamber quantification by echocardiography in adults: An update from the american society of echocardiography and the european association of cardiovascular imaging. European Heart Journal-Cardiovascular Imaging 2015;16(3):233-71.
Figures