2947
Correlation of Aortic Flow and Cardiac Function in Patients With Fabry DiseaseYi-Xian Li1, Bo-Yan Chuang1, Ming-Ting Wu2, and Hsu-Hsia Peng1
1Department of Biomedical Engineering and Environmental Sciences, National Tsing Hua University, Hsinchu, Taiwan, 2Department of Radiology, Kaohsiung Veterans General Hospital, Kaohsiung, Taiwan
Synopsis
We aim to explore the potential correlation of aortic flow and cardiac function in patients with Fabry disease (FD). The decreased total flow and increased maximum acceleration illustrated altered aortic hemodynamics. The left ventricular peak ejection rate (LVPER) negatively associated with the aortic total flow might be a mechanism to compensate the decreased aortic total flow in FD group. Besides, the positive correlation between LVPER and the systolic maximum acceleration described the interaction between cardiac function and aortic flow. In conclusion, the quantitative aortic flow-related parameters could help to elucidate altered aortic characteristics and the possible correlation with cardiac function.
Introduction
Fabry disease (FD) is an X-linked lysosomal storage disorder caused by deficient activity of α-galactosidase A (α-Gal A) and probably results in systemic symptoms [1]. Regarding cardiac manifestations, patients may present hypertrophic cardiomyopathy, myocardial fibrosis, angina pectoris and heart failure [1]. A previous study also reported functional cardiac manifestations in patients with FD [2]. The relation of morphological and functional abnormalities of heart in FD patients has been confirmed [2]. Although the gene disorder may also influence the characteristics of aortic wall, the change of aortic flow in FD is seldom discussed. In this study, we applied 2D phase-contrast MRI to compute the total flow, peak flow, systolic maximum acceleration and deceleration of the aorta. The purpose of this study was to explore the potential correlation of aortic flow-related parameters and routine cardiac function parameters in patients with FD. The correlation may provide an explanation to describe the changes of aortic characteristics.Methods
This study recruited 35 patients with FD (51 ± 12 years, male/female = 17/18) and 34 normal volunteers (47 ± 5 years, male/female = 18/16) without history of cardiovascular diseases. All images were acquired in a 3.0 Tesla MR scanner (Discovery MR750, GE Healthcare; Skyra, Siemens). The cine MRI with SSFP sequence was performed in the short-axis view in 14 of 35 FD patients (male/female = 5/9) for measuring left ventricular (LV) function parameters. 2D phase-contrast MRI was performed (TR/TE = 5.7/3.0 ms, pixel size = 1.17 × 1.17 mm2, slice thickness = 8 mm, flip angle = 20°, Venc through-plane = 1.5 m/s, 30 cardiac frames). Retrospective ECG and navigator echo were used to synchronize with the cardiac and respiratory motion. The computed aortic flow parameters included total flow, peak flow, maximum acceleration, and maximum decelerationResults
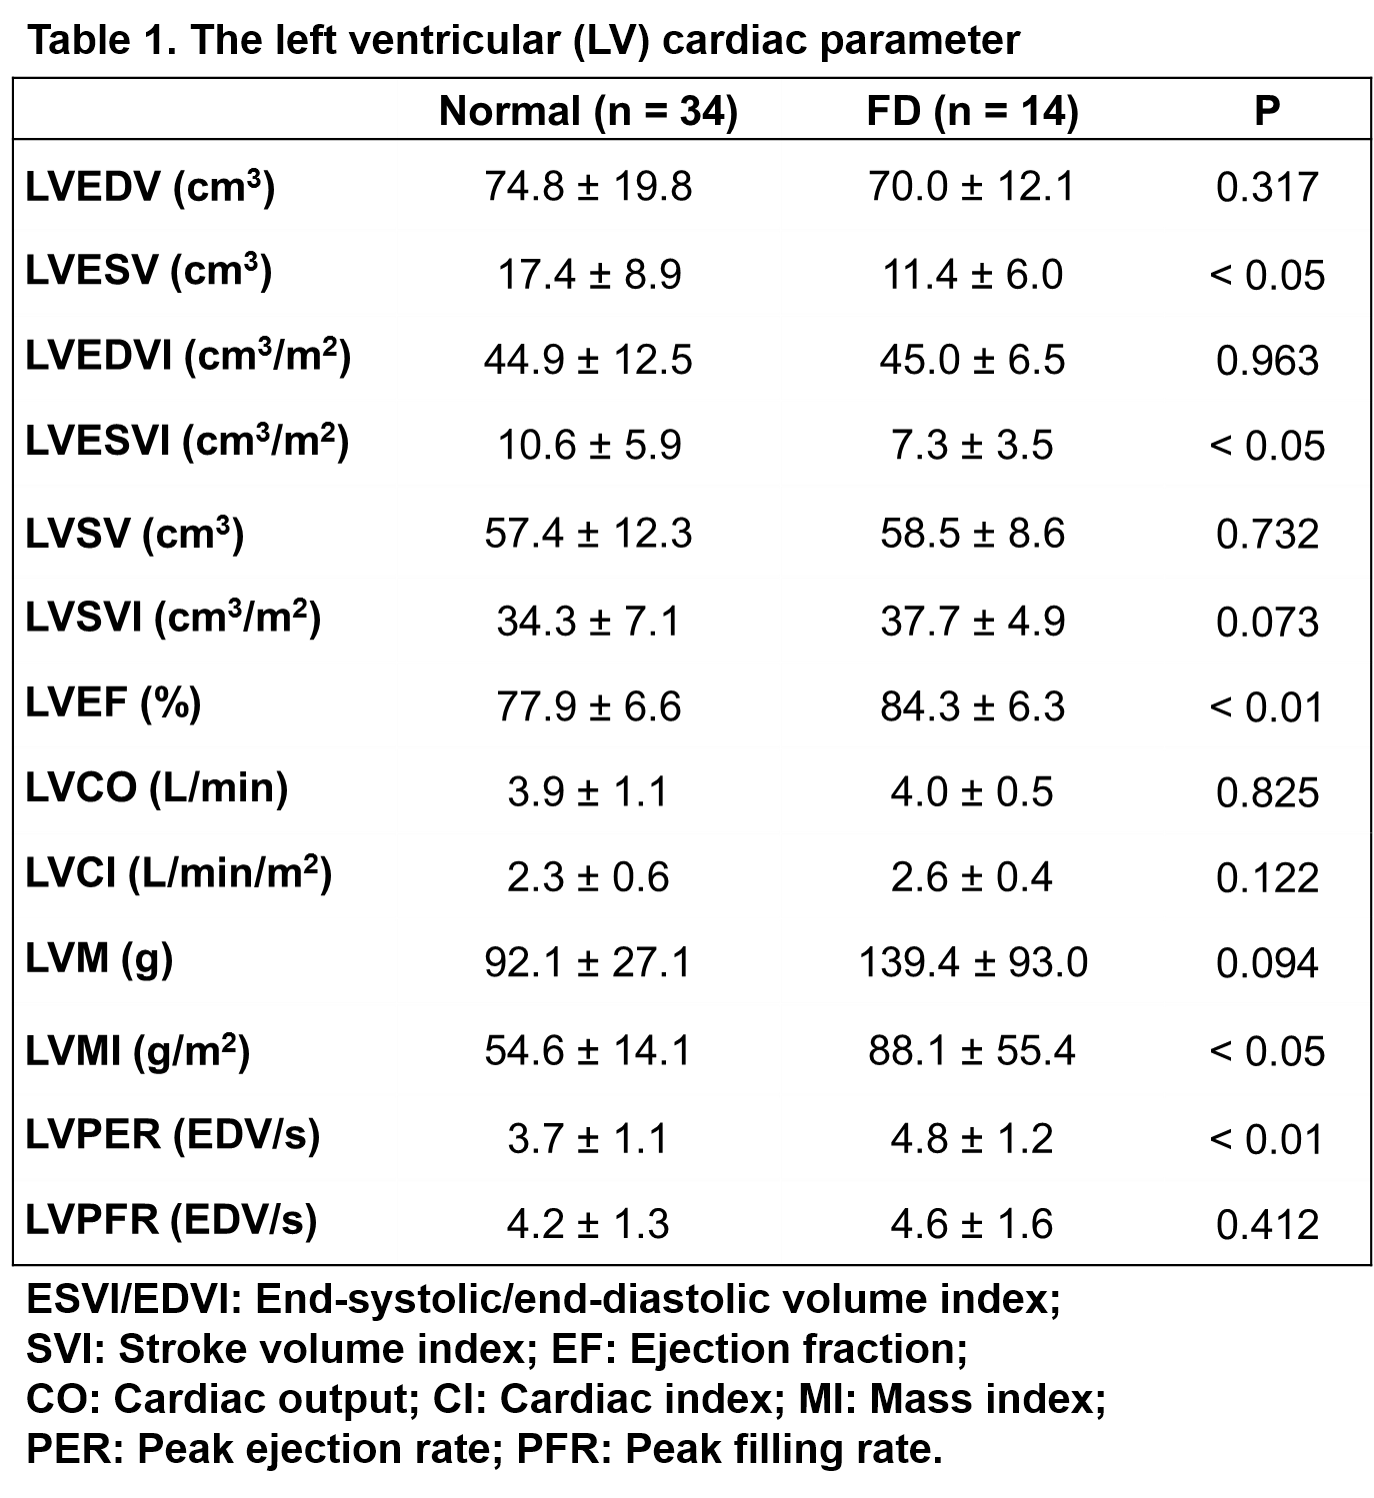
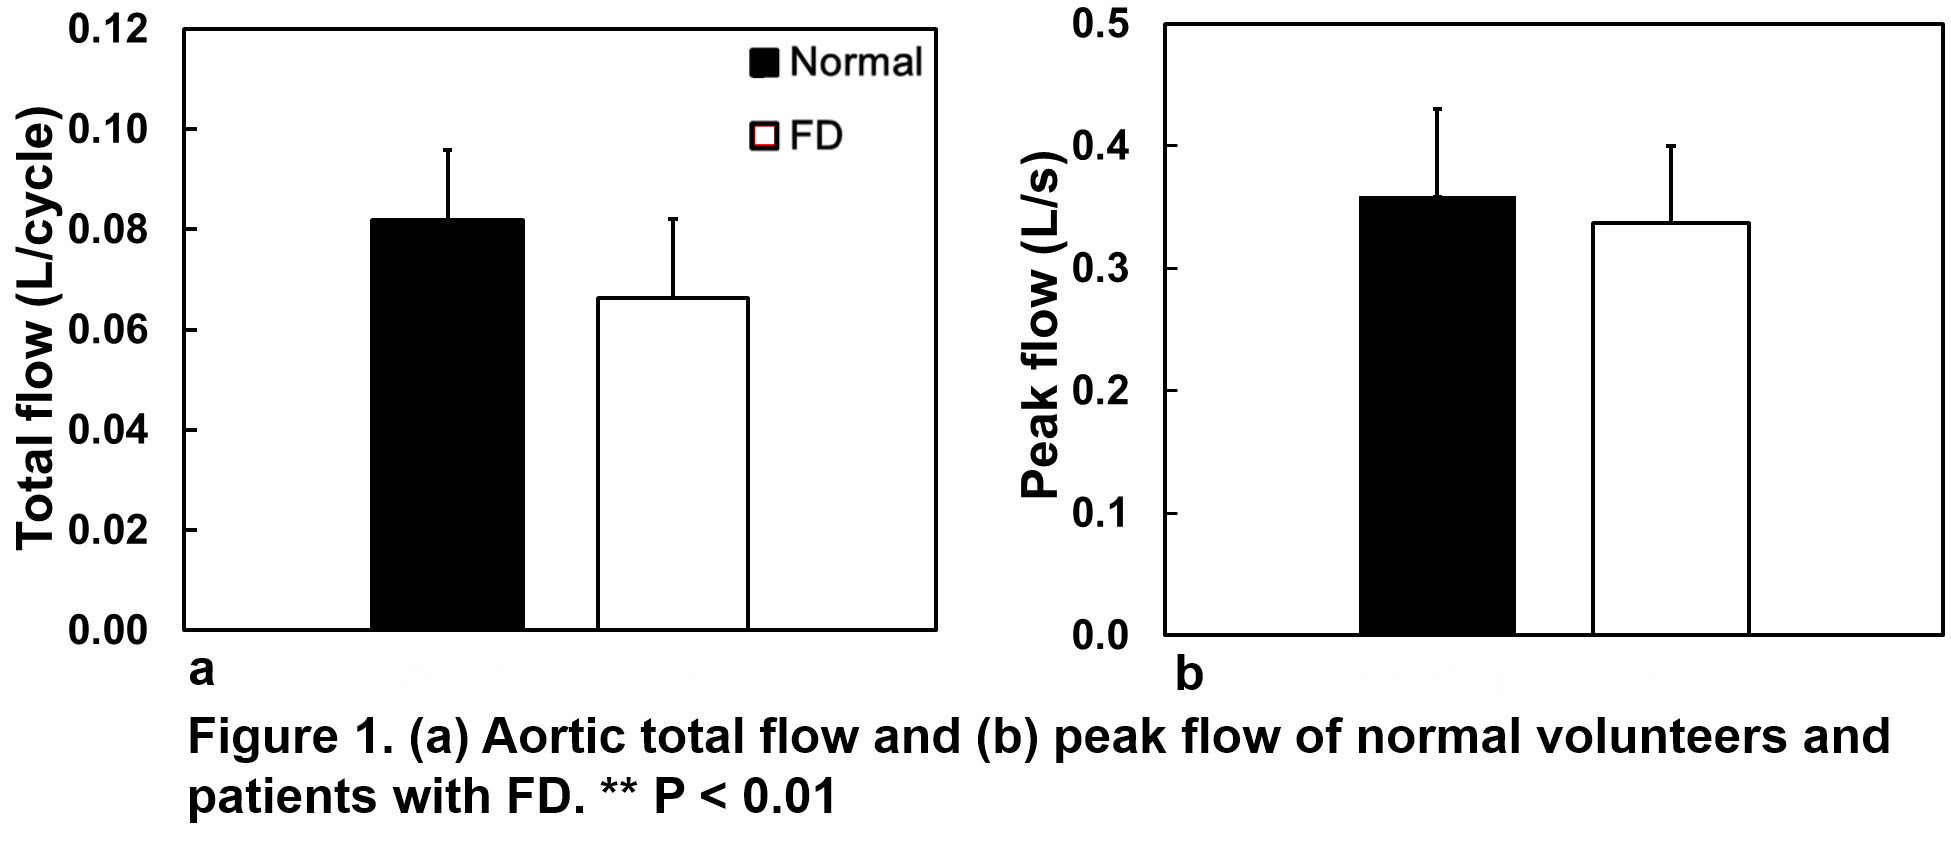
Table 1 summarizes the LV function parameters of normal and FD groups. Compared to normal volunteers, patients with FD demonstrated lower left ventricular end-systolic volume (LVESV) and left ventricular end-systolic volume index (LVESVI)(both P < 0.05) and higher left ventricular mass index (LVMI)(P < 0.05) and left ventricular peak ejection rate (LVPER)(P < 0.01). Compared to normal group, FD group presented significantly decreased aortic total flow (0.082 ± 0.014 L/cycle vs. 0.066 ± 0.016 L/cycle, P < 0.01) and comparable aortic peak flow (Figure 1). FD group demonstrated significantly increased systolic maximum acceleration (3.72 ± 0.93 L/s2 vs. 5.81 ± 2.45 L/s2, P < 0.01) and comparable systolic maximum deceleration (Figure 2). In Figures 3a and 3b, the aortic total flow in patients with FD showed strong positive correlation with LVSV (R = 0.604, P = 0.022) and negative correlation with LVPER (R = -0.579, P = 0.030). In Figure 3c and 3d, the systolic maximum acceleration strongly correlated with LVPER (R = 0.644, P = 0.013) while the systolic maximum deceleration exhibited significantly negative correlation with LVPFR (R = -0.726, P = 0.003).Discussions and Conclusions
In this study, we performed 2D phase-contrast MRI to quantify the aortic total flow, peak flow, systolic maximum acceleration and deceleration. The decreased total flow and increased maximum acceleration illustrated the alterations of aortic hemodynamics, revealing the impact of the gene disorders on the characteristics of the aorta. The index of LVPER can reflect the systolic cardiac function. A previous study reported that LVPER would increase during exercise and high LVPER would cause high cardiac loading [3]. In this study, we found a close correlation between cardiac function and aortic flow in patients with FD. Compared to normal volunteers, FD patients were with increased LVPER and decreased aortic total flow. We postulated that the LVPER negatively associated with the aortic total flow might be a compensatory mechanism to compensate for the decreased aortic total flow in FD group. Besides, the positive correlation between LVPER and the systolic maximum acceleration described the interaction between cardiac function and aortic flow. The close interaction between LV function and aortic flow implied that the abnormal aortic flow could reflect the altered characteristics of the aortic wall. In conclusion, the relationship between aortic flow and cardiac function was validated in the study. The compensatory mechanism of increased LVPER might have adverse impact on myocardium. The quantitative aortic flow-related parameters could provide helpful information to elucidate the changes of aortic characteristics and the possible correlation with cardiac function.Acknowledgements
No acknowledgement found.References
- Christine M. Eng, MD, et al. Fabry disease: Guidelines for the evaluation and management of multi-organ system involvement. Genet Med 2006; 8(9): 539-548.
- Frank Weidemann, et al. The variation of morphological and functional cardiac manifestation in Fabry disease: potential implications for the time course of the disease. European heart journal 2005; 26(12): 1221-1227.
- Stephen L. Bacharach, et al. Left-ventricular Peak Ejection Rate, Filling Rate, and Ejection Fraction-Frame Rate Requirements at Rest and Exercise: Concise Communication. J NuclMed 1979; 20: 189-19.
Figures
Table
1. The left ventricular (LV) cardiac parameter
Figure
1. Aortic total
flow
and peak
flow
of
normal volunteers and
patients
with FD.
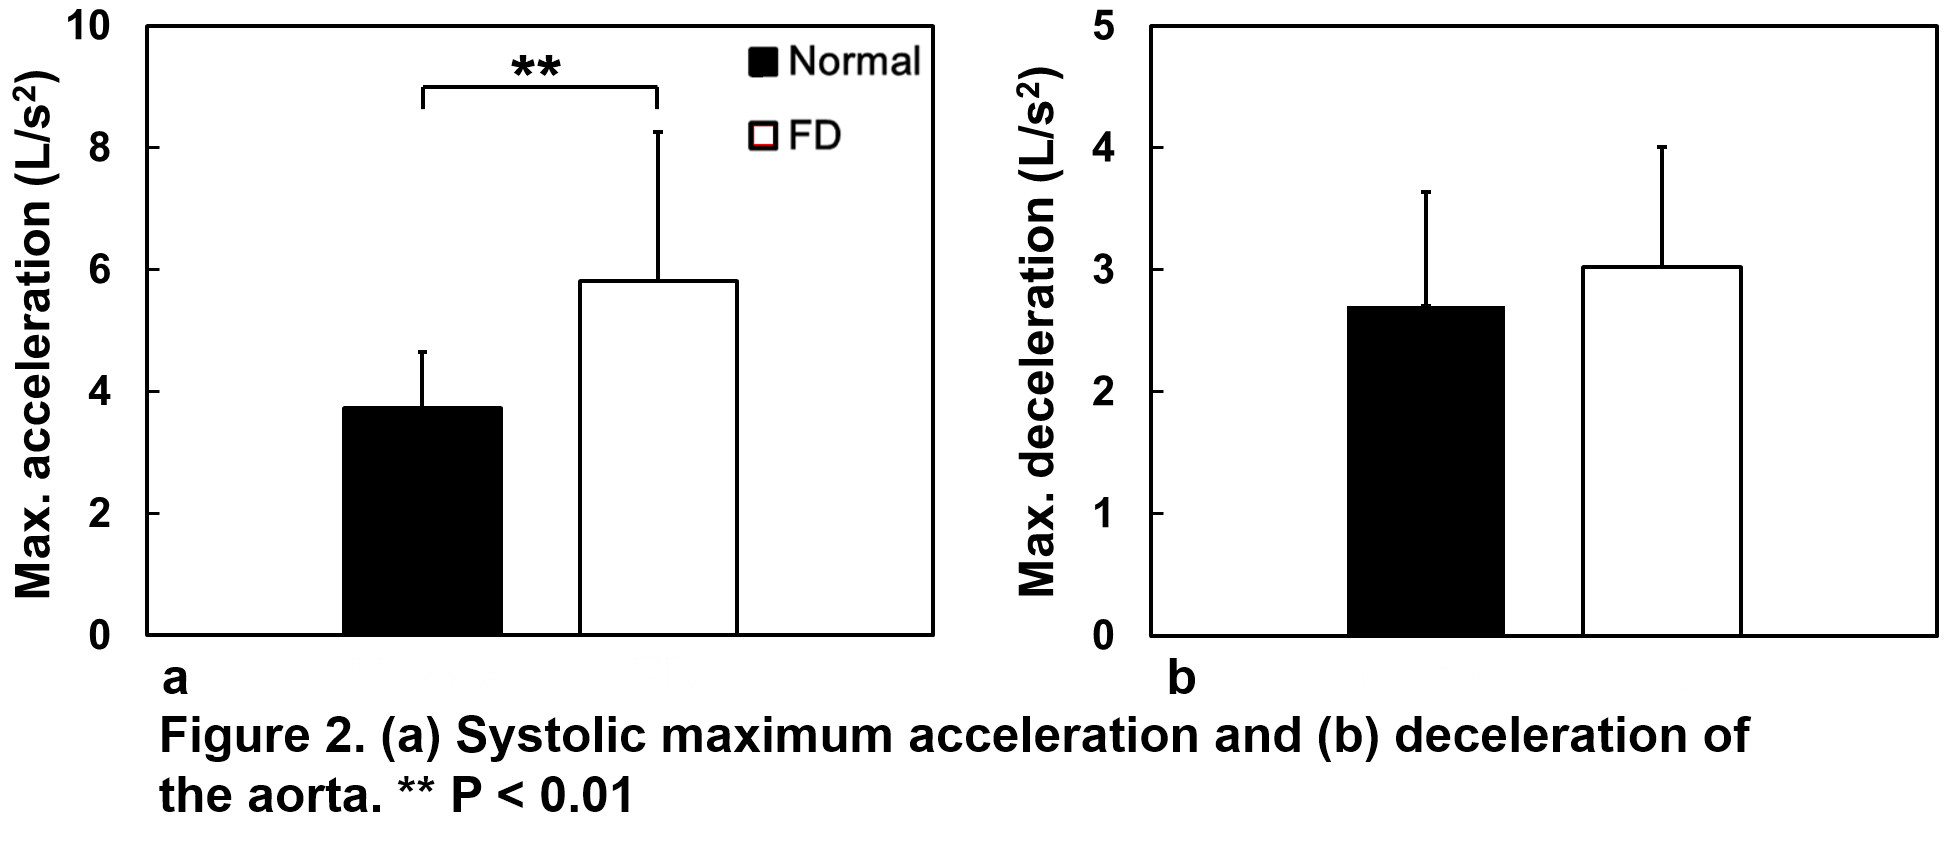
Figure 2. Systolic maximum acceleration and deceleration of the aorta.
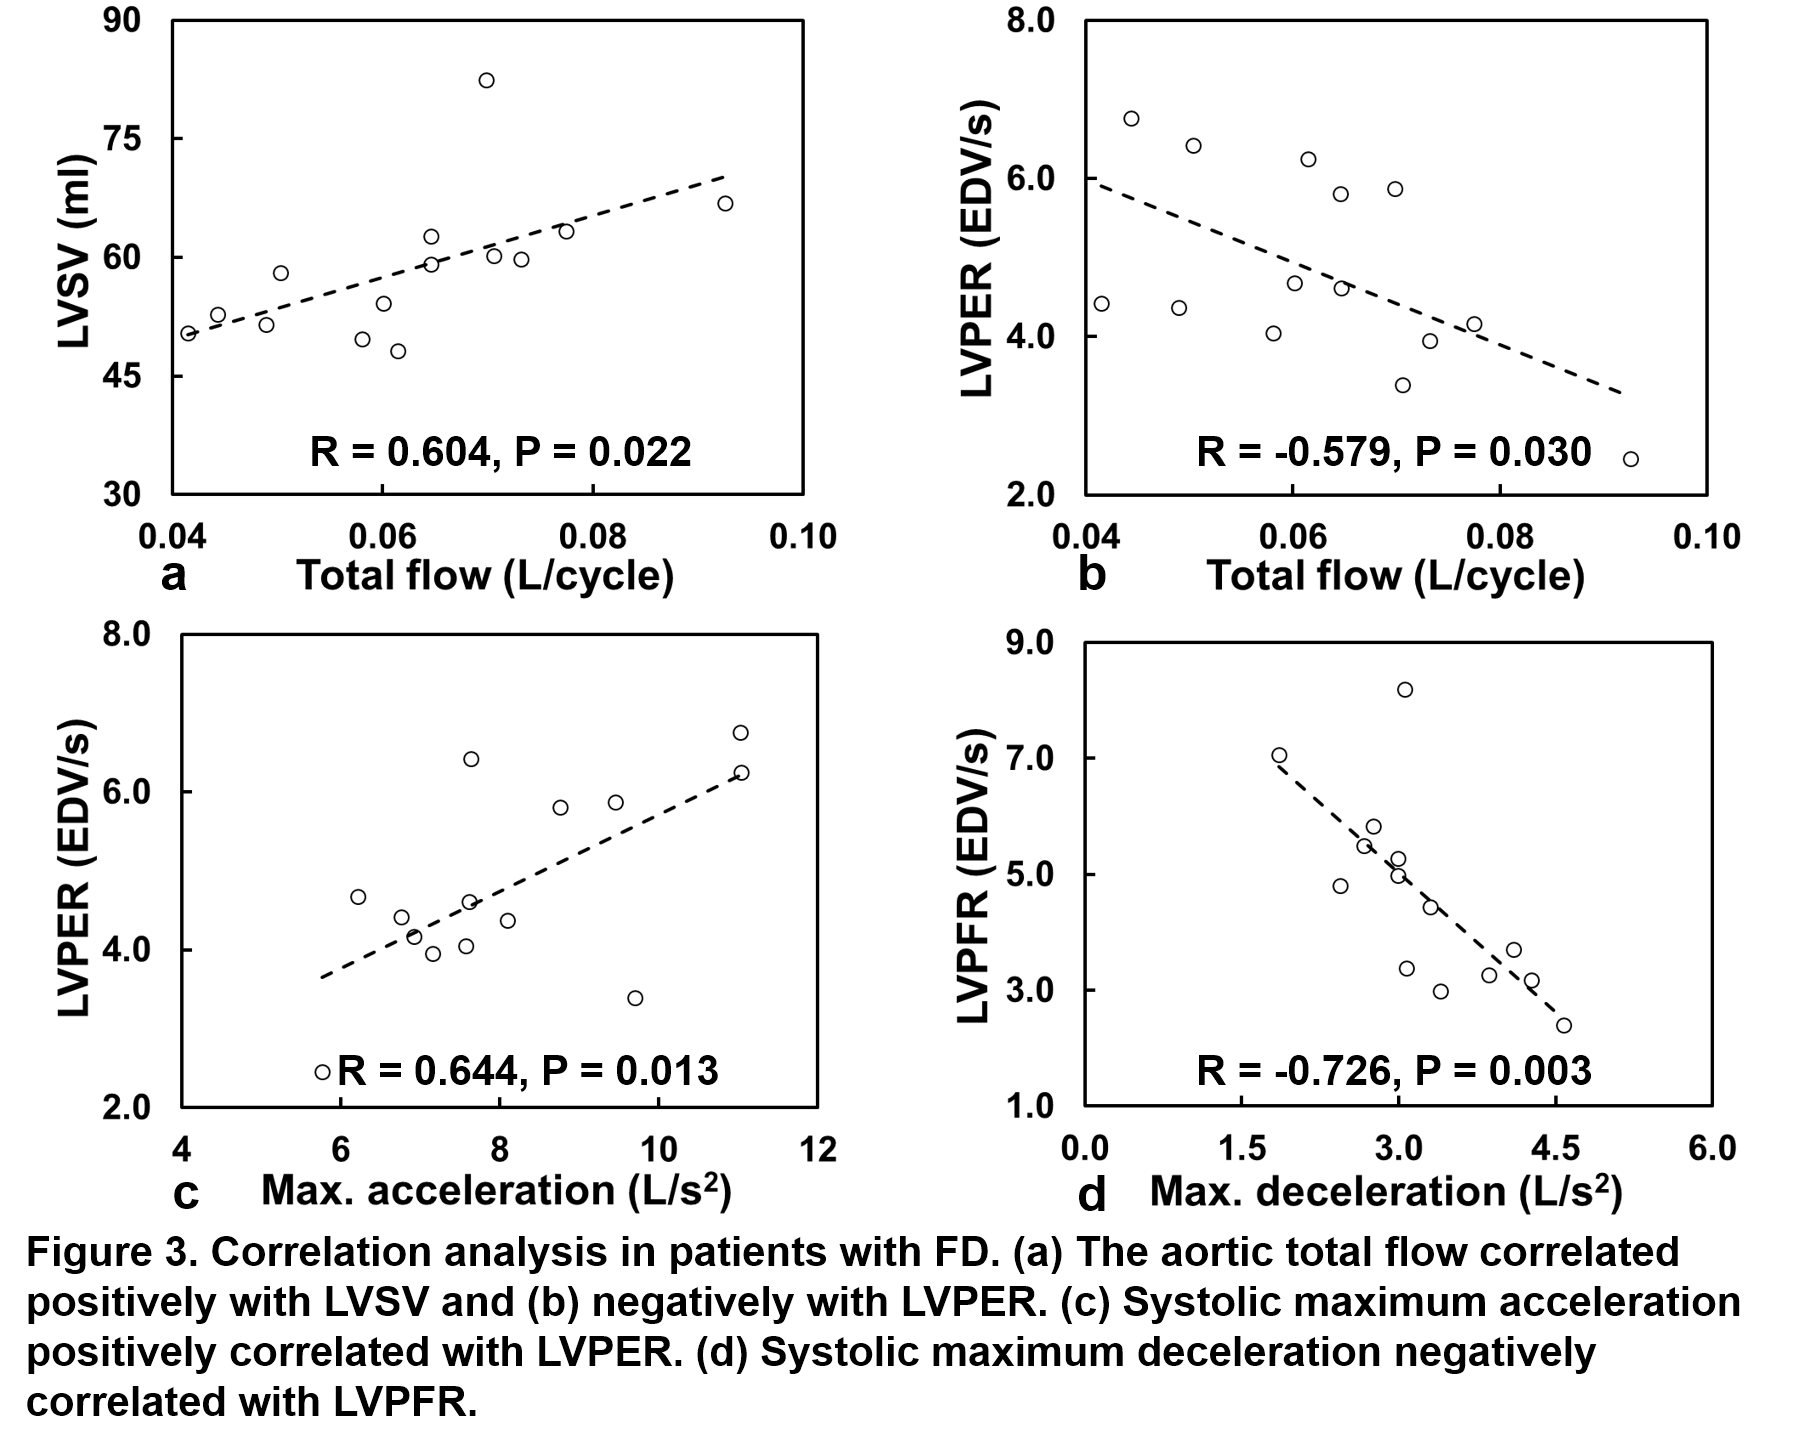
Figure 3. Correlation analysis in patients
with FD.