2946
Accurate MR-based Wall Shear Stress Measurements in Fully Developed Turbulent Flow Using the Clauser-plot Method1Radiology, Medical Physics, Medical Center - University of Freiburg, Faculty of Medicine, University of Freiburg, Freiburg, Germany, 2Institute for Fluid Mechanics and Aerodynamics, Department of Mechanical Engineering, Technische Universitaet Darmstadt, Darmstadt, Germany, 3Institute for Numerical Analysis and Scientific Computing, Department of Mathematics, Technische Universitaet Darmstadt, Darmstadt, Germany
Synopsis
Wall shear stress (WSS) quantifies the frictional force that flowing blood exerts on a vessel wall and can be estimated from MR-based flow measurements via numerical differentiation. Correct assessment of WSS remains difficult because of the limited spatial resolution, partial volume effects and the per-se unknown position of the wall. It has been shown that such WSS evaluations tend to underestimate. We investigate an alternative method to evaluate WSS using the Clauser-plot method – a graphical way to estimate the WSS in fully developed turbulent stationary flow. We briefly describe the Clauser-plot method and present experimental validation in a straight tube.
Introduction
Wall shear stress (WSS)
quantifies the frictional force that flowing blood exerts on a vessel wall. For an incompressible fluid, WSS is defined by:
$$\text{WSS}=\tau _w=\left.{\mu\left({\frac{{\partial u}}{{\partial r}}} \right)}\right|_{r = 0}\qquad\text{(1)}$$
with $$$\mu$$$: dynamic viscosity, $$$u$$$: velocity component parallel to the wall, $$$r$$$: normal distance from the wall. WSS can be estimated from MR-based flow measurements1 and has been suggested as a biomarker in cardio-vascular diseases2-4. However, correct assessment of WSS remains challenging due to the limited spatial resolution of MR flow data5,6 and the per-se unknown position of exact boundary of the vessel wall, especially when it is moving, e.g. in the pulsating aorta. Typically, MR-based WSS estimation is done via numerical differentiation according to $$$\text{(1)}$$$ after segmentation of the wall. It has been shown that MR-derived WSS tend to underestimate WSS mainly because of limited resolution and partial volume effects5,6. We investigate an alternative method for WSS assessment using the Clauser-plot method7 – a graphical method for estimating WSS in fully developed turbulent stationary flows where velocities cannot be sufficiently resolved in the wall's proximity. We briefly describe the Clauser-plot method and present experimental validation in a straight tube.
Theory
In the logarithmic region of the boundary layer8, the velocity profile $$$U(r)$$$ of fully developed turbulent stationary flow satisfies the logarithmic law:
$$\frac{{U(r)}}{{u_\tau
}}=\frac{1}{\kappa}\ln\frac{{ru_\tau}}{\nu}+B\qquad\text{(2)}$$
with $$$u_\tau=\sqrt{\frac{{\tau _w }}{\rho }}$$$: friction velocity, $$$\rho$$$: density, $$$\nu$$$: kinematic viscosity, constants9 $$$\kappa=0.41$$$ and $$$B=5.0$$$. Substituting the skin friction coefficient $$$C_f=2\left({\frac{{u_\tau}}{{U_\infty}}}\right)^2=2\frac{{\tau _w}}{{U_\infty^2\rho}}$$$ with the free stream velocity $$$U_{\infty}$$$ into $$$\text{(2)}$$$, the Clauser-plot equation is obtained10:
$$\frac{{U(r)}}{{U_\infty}} = \left[{\frac{1}{\kappa }\sqrt{\frac{{C_f }}{2}}}\right]\ln \left({\frac{{rU_\infty}}{\nu}}\right)+\left[{\frac{1}{\kappa}\sqrt{\frac{{C_f}}{2}}\ln\left({\sqrt{\frac{{C_f}}{2}}}\right)+B\sqrt{\frac{{C_f}}{2}}}\right]\qquad\text{(3)}$$
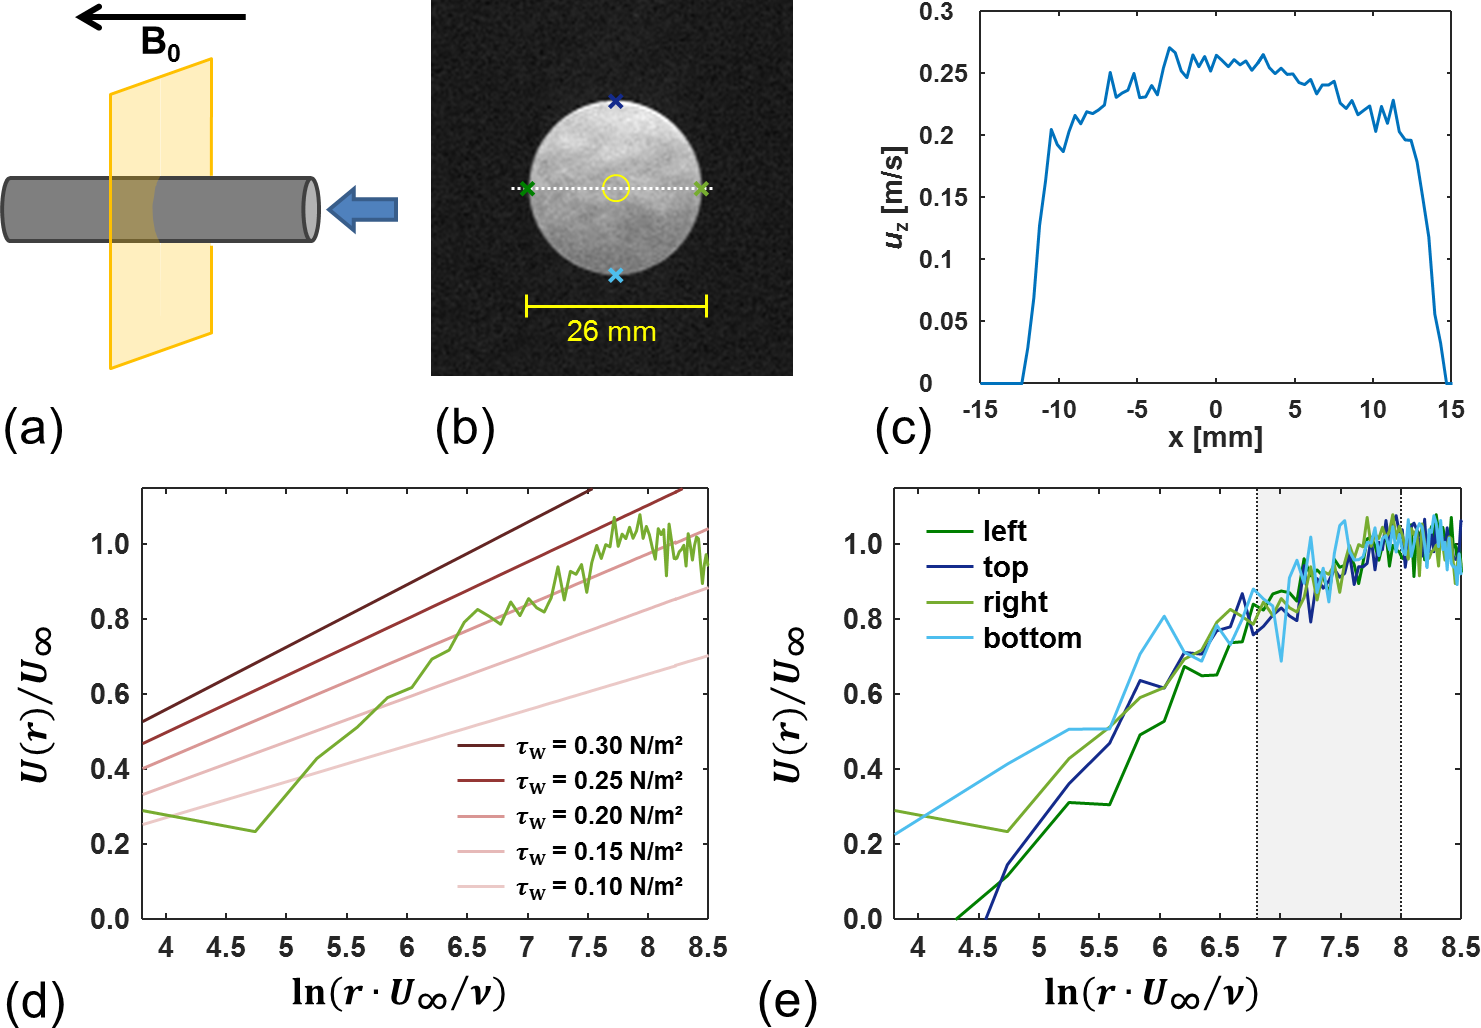
$$$U_\infty$$$ is known from the measurements, $$$\nu$$$, $$$\kappa$$$, and $$$B$$$ are known constants, so only $$$C_f$$$ is unknown. Plotting $$$\frac{{U(r)}}{{U_\infty}}$$$ against $$$\frac{{rU_\infty}}{\nu}$$$ in a semi-log representation for different values of $$$C_f$$$ yields a set of straight lines. By adding the measured data $$$\frac{{U_{\text{meas}}(r)}}{{U_{\infty,\text{meas}}}}$$$ to the same graph, an estimate of $$$C_f$$$, and finally $$$\tau_w$$$, is obtained by choosing the line which approximates the data best within the logarithmic region (Fig. 1d). Instead of a graphical inspection, we determine $$$C_f$$$ from a linear regression of the measured data within the logarithmic region.
Methods
Clauser-plot based WSS estimation was done for 2D phase-contrast (PC) velocity measurements in a 2m-long Plexiglas tube (inner diameter: 26 mm) placed along the center line of the 3T whole-body scanner (Prisma, Siemens, Germany) for different in-plane resolutions (range: 0.30-1.0 mm). A turbulent stationary flow pattern was supplied at a Reynolds number of $$$Re=5330$$$. 2D PC images with velocity encoding (venc = 0.25 m/s) along the through-plane direction were acquired (TR/TE = 18.6/5.4 ms, FOV = 96×96 mm2, slice thickness =3 mm, flip angle =7°) in a plane oriented perpendicular to the tube (Fig. 1a). For all data sets, the WSS was determined at four locations in the tube (Fig. 1b) via a linear regression of the measured data within the logarithmic flow region ($$$950\leq\frac{{rU_\infty }}{\nu}\leq4000$$$, Fig. 1e). For each data set, $$$U_{\infty}$$$ was estimated from the mean velocity within a small central region (Fig. 1b). The Clauser-plot derived WSS values were compared to the values determined with the in-house developed software flow-tool5.Results and Discussion
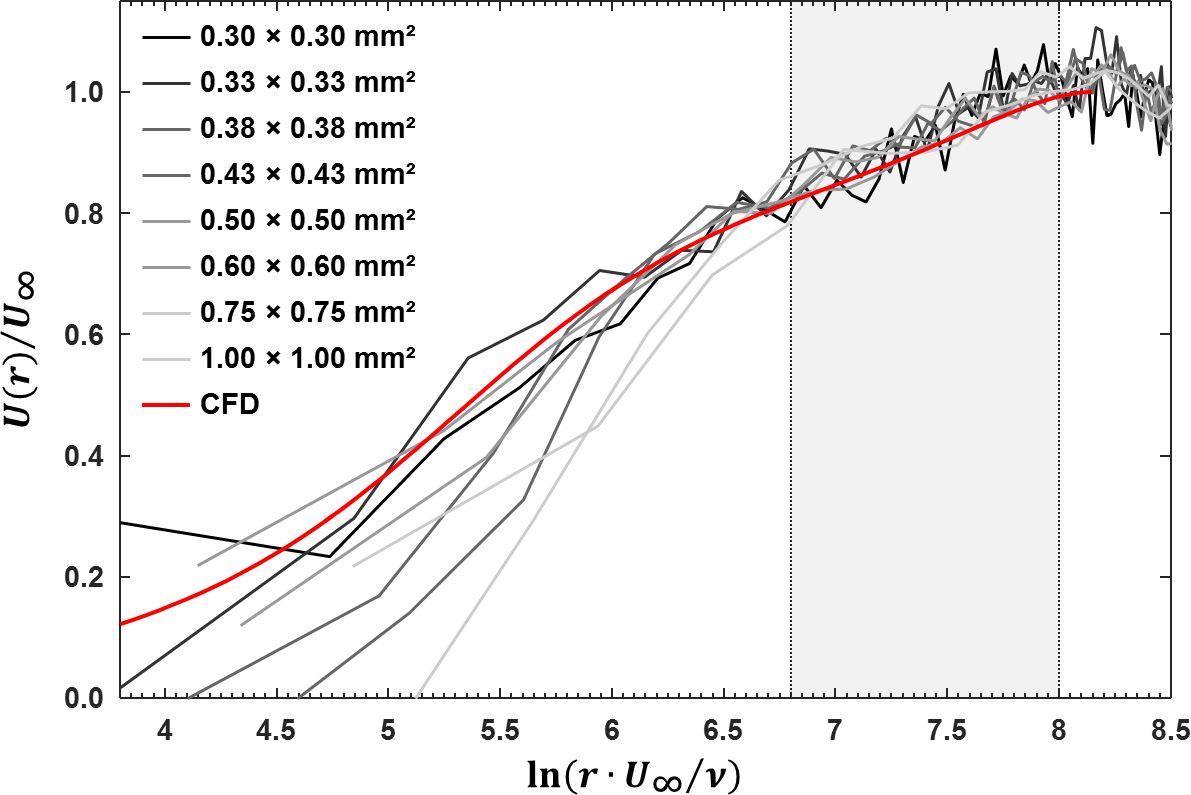
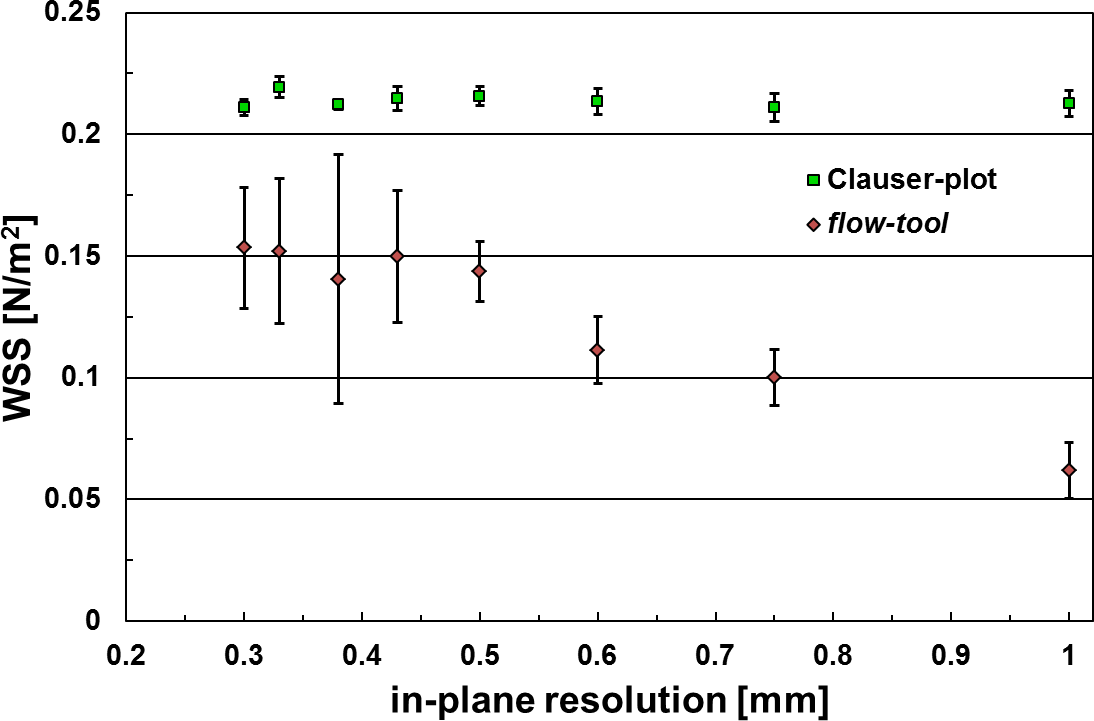
Figure 2 presents Clauser-plots for the data measured at the right boundary for different in-plane resolutions together with results from computional fluid dynamics (CFD) simulations11 showing good agreement within the logarithmic region. Deviations towards smaller values of $$$\text{ln}\left(\frac{rU_\infty}{\nu }\right)$$$ could be explained by noise and partial volume effects close to the boundary. Figure 3 compares WSS values from Clauser-plot and flow-tool. Clauser-plot derived values yield highly consistent results independent of the in-plane resolution and are in good agreement with the theoretical WSS obtained from the friction factor formula8 $$$\tau_w=\frac{1}{8}\lambda\,\rho\,u_{\text{mean}}^2=0.212\,\text{N/m}^2$$$ ($$$u_{\text{mean}}$$$: mean velocity over the tube’s cross-section, constant12 $$$\lambda=0.038$$$). In contrast, flow-tool based values underestimate WSS even for highest in-plane resolution and show a systematic increase from lower to higher in-plane resolution which is expected because of partial volume effects. The flow-tool currently requires manual segmentation of the wall which might cause an additional bias. This can be improved by an automatic segmentation strategy in experimental settings with defined stationary model systems.
Note that the applicability of the Clauser-plot method in-vivo is severely limited due to non-stationary and mostly non-turbulent nature of flow. Nevertheless, the Clauser-plot method yields correct WSS values almost independent of the spatial resolution and therefore renders a valuable approach to obtain accurate WSS measures in controllable flow settings. It might be an alternative tool for validating MR-based WSS measurements. Future work should investigate the application of the Clauser-plot method in 3D PC-MRI and its behavior in situations of reduced SNR e.g. due to undersampling.
Acknowledgements
Grant support by the Deutsche Forschungsgemeinschaft (DFG) under grant numbers DFG HE-1875/30-1, DFG TR-194/56-1, and DFG EG-331/1-1 is greatly acknowledged.References
[1] Markl M, Frydrychowicz A, Kozerke S, Hope M, Wieben O. 4D flow MRI. J Magn Reson Imaging. 2012; 36(5):1015-36.
[2] Barker AJ, Markl M, Bürk J, Lorenz R, Bock J, Bauer S, Schulz-Menger J, von Knobelsdorff-Brenkenhoff F. Bicuspid aortic valve is associated with altered wall shear stress in the ascending aorta. Circ Cardiovasc Imaging. 2012;5(4):457-66.
[3] Peiffer V, Sherwin SJ, Weinberg PD. Does low and oscillatory wall shear stress correlate spatially with early atherosclerosis? A systematic review. Cardiovasc Res. 2013;99(2):242-50.
[4] Geiger J, Arnold R, Herzer L, Hirtler D, Stankovic Z, Russe M, Langer M, Markl M. Aortic wall shear stress in Marfan syndrome. Magn Reson Med. 2013;70(4):1137-44.
[5] Stalder AF, Russe MF, Frydrychowicz A, Bock J, Hennig J, Markl M. Quantitative 2D and 3D phase contrast MRI: optimized analysis of blood flow and vessel wall parameters. Magn Reson Med. 2008;60(5):1218-31.
[6] Petersson S, Dyverfeldt P, Ebbers T. Assessment of the accuracy of MRI wall shear stress estimation using numerical simulations. J Magn Reson Imaging. 2012;36(1):128-38.
[7] Clauser FH. The turbulent boundary layer. Adv Appl Mech. 1956;4:1-5.
[8] Schlichting H, Gersten K. Boundary-layer theory. Springer-Verlag Berlin Heidelberg. 2017.
[9] Tropea C, Yarin A, Foss JF. Springer Handbook of Experimental Fluid Mechanics. Springer-Verlag Berlin Heidelberg. 2007.
[10] Wei T, Schmidt R, McMurtry P. Comment on the Clauser chart method for determining the friction velocity. Exp Fluids. 2005;38:695-699.
[11] El Khoury GK, Schlatter P, Noorani A, Fischer PF, Brethouwer G, Johansson AV. Direct numerical simulation of turbulent pipe flow at moderately high Reynolds numbers. Flow Turbulence Combust. 2013;91:475-495.
[12] Moody L. Friction factors for pipe flow. Transactions of the ASME. 1944;66(8):671-684.
Figures