2942
2D phase-contrast MRI as an integrative method for the evaluation of patients with chronic thromboembolic pulmonary hypertension before and after pulmonary endarterectomyChristoph P. Czerner1, Christian Schoenfeld1, Serghei Cebotari2, Julius Renne1, Till F. Kaireit1, Hinrich B. Winther1, Gesa H. Hauck1, Marius Hoeper3, Frank Wacker1, and Jens Vogel-Claussen1
1Institute for Diagnostic and Interventional Radiology, Hannover Medical School, Hannover, Germany, 2Department of Cardiothoracic, Transplantation and Vascular Surgery, Hannover Medical School, Hannover, Germany, 3Clinic for Pneumology, Hannover Medical School, Hannover, Germany
Synopsis
Pulmonary endarterectomy (PEA) is an established method for treatment of chronic thromboembolic pulmonary hypertension (CTEPH). MRI is currently proposed as novel tool for treatment monitoring. We evaluated 2D phase-contrast (PC) MRI of the main pulmonary artery as perioperative monitoring method in relation to cardiac and parenchymal perfusion MRI as well as to clinical parameters. 32 CTEPH patients who underwent MRI before and after PEA were analyzed. Results show improved postoperative pulmonary hemodynamics. 2D PC MRI data correlate well with cardiac as well as perfusion changes and clinical parameters which makes this method a simple tool for treatment monitoring after PEA.
Introduction
Chronic thromboembolic pulmonary hypertension (CTEPH) is a life-threatening disease that can be cured through pulmonary endarterectomy (PEA). MRI is a suitable method for monitoring of these patients1. Methods such as cardiac MRI, pulmonary arterial blood flow measurements using 2D phase-contrast (2D PC) MRI and time-resolved contrast-enhanced 3D-MRA-based pulmonary parenchymal perfusion assessment have already been positively evaluated1–3. The aim of this study was therefore to further evaluate 2D PC MRI as integrative method before and after PEA in relation to cardiac MRI and lung perfusion analysis as well as clinical outcome.Methods
Twelve women and twenty men with CTEPH (n=32), who received 1.5 Tesla MRI on average 7 days before (standard deviation (SD): 17 days) und 14 days after (SD: 7 days) PEA, were analyzed. 2D PC MRI measurements, acquired in the main pulmonary artery, were related to data from cardiac MRI, parenchymal perfusion and clinical parameters, such as six-minute walk distance (6MWD; measured before and on average 6 months after PEA) and mean pulmonary arterial pressure (mPAP; measured introperatively), using Spearman correlations. After normality testing via Shapiro-Wilk test, Wilcoxon signed-rank tests were applied for pairwise comparisons. P-values were adjusted family-wise.Results
2D PC MRI showed a significant increase of average (vavg; p=0.002) and maximum (vmax; p=0.008) mean velocity, acceleration time (p=0.03) and volume (p=0.005) as well as deceleration time (p=0.004). Maximum area of the pulmonary artery (p=0.002) and area change (p=0.02) decreased, whereas minimum area (p=0.23) and deceleration volume (p=0.29) did not change significantly. Cardiac MRI showed a significant increase of the right ventricular ejection fraction (RVEF; p=0.00001). Right ventricular mass (p=0.0001) as well as endsystolic (p=0.000006) and enddiastolic (p=0.0004) volume decreased. Perfusion analysis revealed an increased pulmonary blood flow (p=0.0004) while the pulmonary transit time (PTT; p=0.008) decreased. Post PEA mPAP decreased (p=0.00002) and patients achieved a higher 6MWD (p=0.003). Plots are shown in figure 1. The change of blood flow velocity in the main pulmonary artery correlated with the change of 6MWD (vavg: p=0.04, rho=0.58; vmax: p=0.03, rho=0,61), RVEF (vmax: p=0.01, rho=0.55) and PTT (vavg: p=0.04, rho=-0.51; vmax: p=0.01, rho=-0.56). The ratio of the deceleration volume correlated with the change of 6MWD (p=0.03, rho=0.60) and RVEF (p=0.003, rho=0.60). Also, the change of the minimum area of the main pulmonary artery correlated with the change of mPAP (p=0.02, rho=0.53).Discussion
The main finding of this study is that hemodynamic changes assessed with 2D PC MRI in the main pulmonary artery after PEA reflect changes of right heart function, pulmonary parenchymal perfusion and clinical parameters. Changes of pulmonary hemodynamics and clinical parameters were within the expected range1–3. Promising novel parameters are deceleration time and deceleration volume. Although the latter parameter did not change significantly, its ratio pre and post PEA correlates with the change of 6MWD and RVEF. vavg and especially vmax seem to be of most interest as their changes correlate with the changes of cardiac as well as perfusion and clinical parameters.Conclusion
2D PC MRI of the main pulmonary artery is a potential integrative method for peri- and postoperative monitoring of patients with CTEPH.Acknowledgements
No acknowledgement found.References
- Kreitner K-FJ, Ley S, Kauczor H-U, et al. Chronic thromboembolic pulmonary hypertension: pre- and postoperative assessment with breath-hold MR imaging techniques. Radiology 2004;232(2):535–43.
- Rolf A, Rixe J, Kim WK, et al. Pulmonary vascular remodeling before and after pulmonary endarterectomy in patients with chronic thromboembolic pulmonary hypertension: a cardiac magnetic resonance study. Int J Cardiovasc Imaging 2015;31(3):613–9.
- Schoenfeld C, Cebotari S, Hinrichs J, et al. MR Imaging-derived Regional Pulmonary Parenchymal Perfusion and Cardiac Function for Monitoring Patients with Chronic Thromboembolic Pulmonary Hypertension before and after Pulmonary Endarterectomy. Radiology 2016;279(3):925–34.
Figures
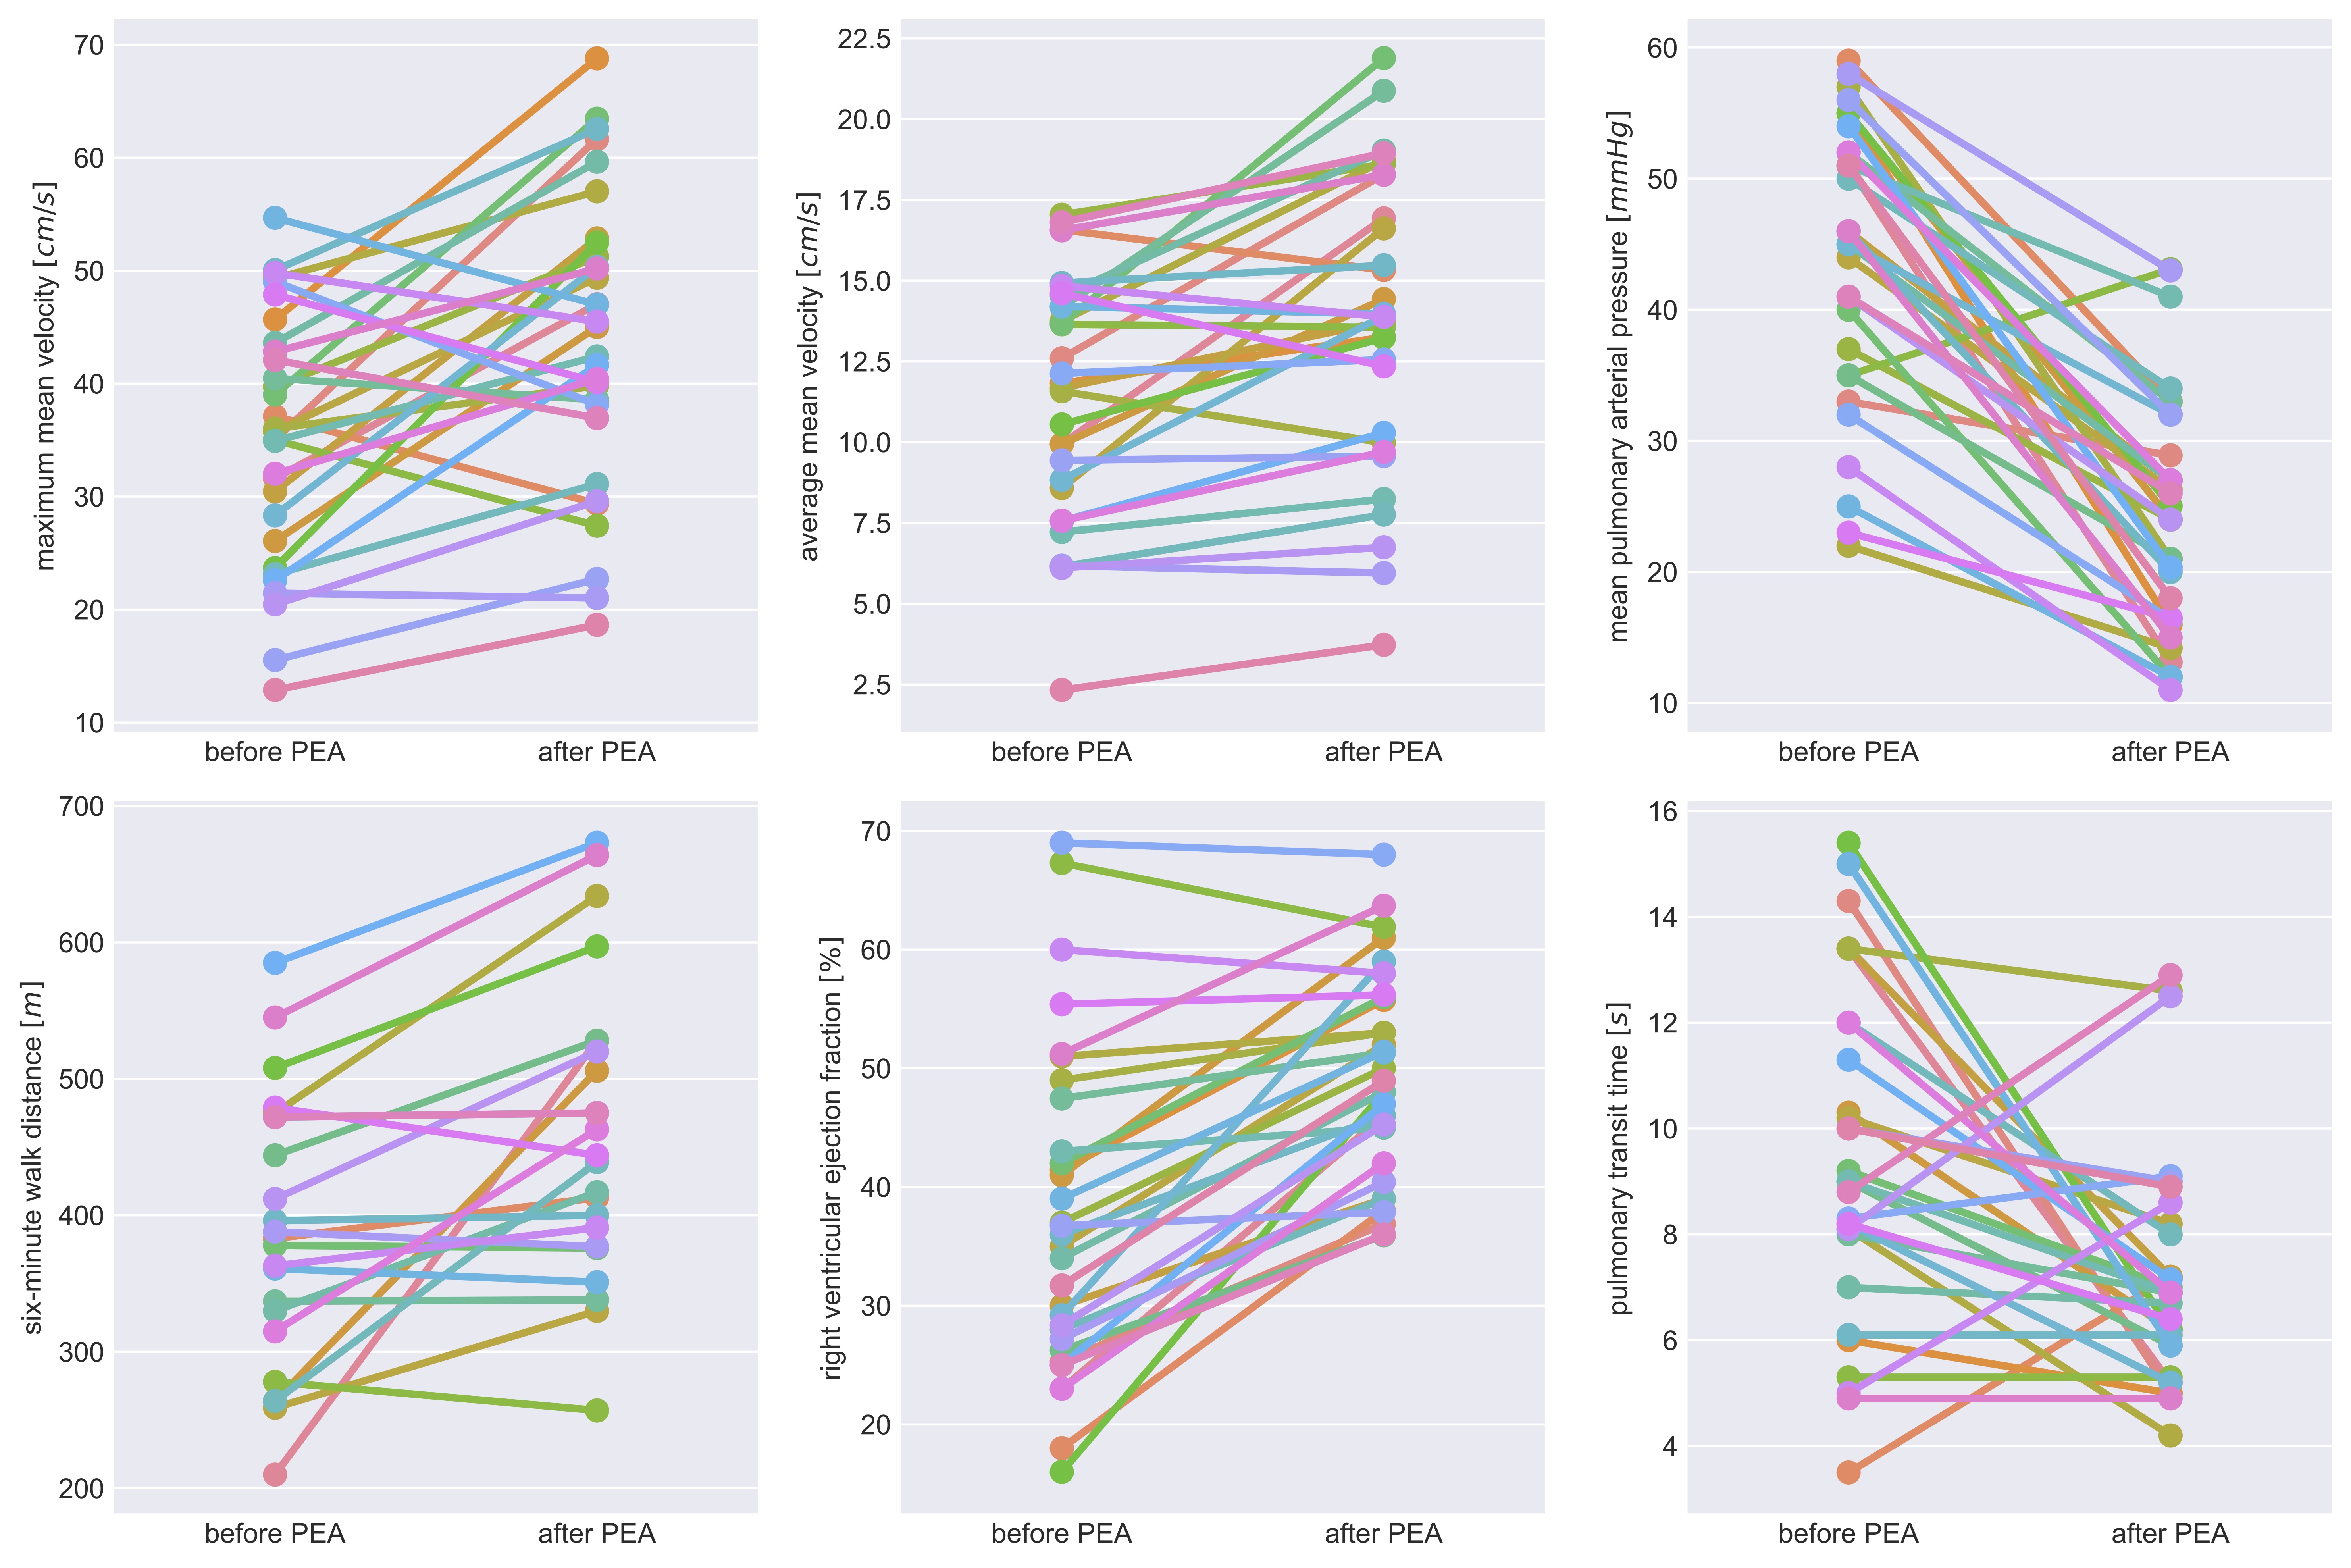
Figure 1: Graphs show maximum and average mean velocity, mean pulmonary arterial
pressure, six-minute walk distance, right ventricular ejection fraction and
pulmonary transit time for each patient before and after pulmonary
endarterectomy (PEA).