2937
Can cardiac 2D Phase-Contrast MRI velocity measurements be used to characterize left ventricle hemodynamics?1Clinical Imaging Research Centre, A*STAR, Singapore, Singapore, 2Cardiovascular Research Institute, National University Heart Centre, Singapore, Singapore, 3Department of Surgery, NUS, Singapore, Singapore
Synopsis
Phase-contrast MRI were proposed to estimate intracardiac pressure gradients, but it is still unclear if this acquisition can be reliably used in the assessment of hemodynamics of the left ventricle. In this study, we performed reproducibility and test-retest experiments to evaluate the clinical use of PC-MRI and concluded that pressure and velocity parameters measured from the inflow (from atrium to LV) seem to be reliably measured using PC-MRI but it was not the case for the outflow parameters. Moreover, test-retest experiment showed that individual parameters were not constant over time, which therefore questions the diagnostic value of PC-MRI pressure measurement.
Introduction
Non-invasive techniques for the
characterization of hemodynamics abnormalities of the left ventricle (LV) are
still needed. Methods using (2D+t) flow sequences to estimate intracardiac
pressure gradients were proposed, from Thompson and McVeigh1 who
validated the use of single-slice phase-contrast MRI (PC-MRI) against catheter
measurements to more recent approaches2, 3. In this study we investigated
if PC-MRI can indeed be reliably used in the assessment of hemodynamics of the LV,
through reproducibility and test-retest experiments.Methods
Image Acquisition: Ten healthy volunteers without known cardiovascular diseases were scanned on a Siemens Prisma 3T MRI (Siemens Healthineers, Erlangen, Germany) twice within 10 days. In-plane PC-MRI in the 3-chamber view (LVOT view) was acquired for the velocity measurements with a slice thickness of 5.5 mm, 40 frames through the cardiac cycle, and a typical VENC of 140 cm/s. Images were acquired during free breathing for higher image quality than breath-hold sequences (in our experience) and to remove any pressure variations introduced during breath holding, inadvertent Valsalva maneuver.
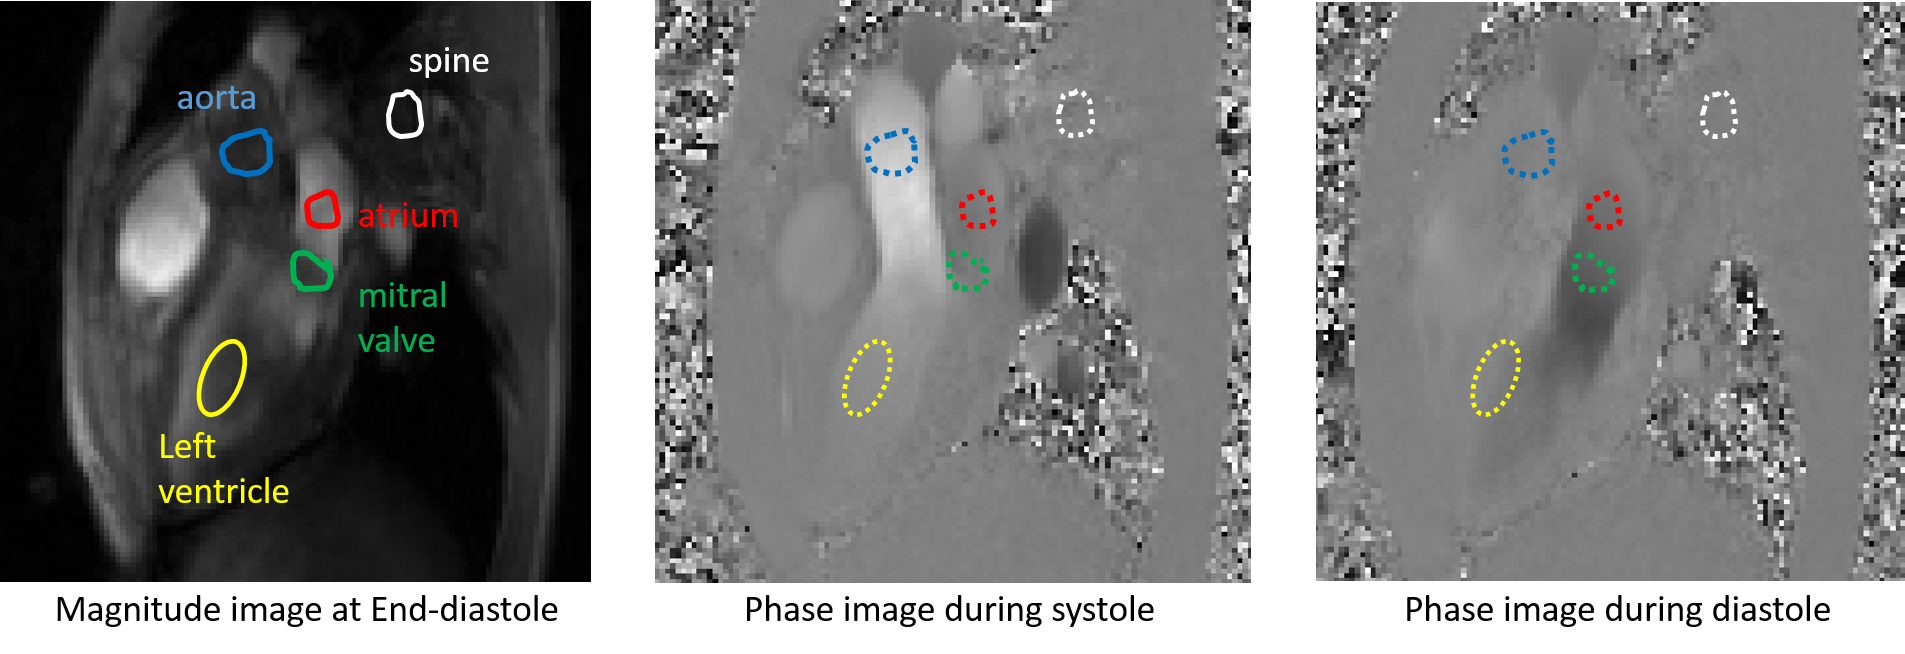
Image Analysis: We defined the paths using manually drawn circular regions of interests (see Figure 1) drawn on the magnitude image at end-diastole, but still falling within the correct area throughout the cardiac cycle. This approach reduced the influence of the chosen points1 while being applicable to clinical routine, since this does not require full cavity segmentation2.
Pressure differences computation:
Eddy currents were first corrected by subtracting the velocities
measured in the spine ROI, considered a stationary tissue. Navier-Stokes
equations, neglecting the external forces and viscosity terms1, were
then solved to compute the pressure gradient between the aorta and the LV
during ejection, and between the atrium and the LV during filling. Using the
centers of the ROIs to evaluate distances and the average of the velocities ($$$v_x,v_y$$$) or their partial derivatives
within the ROIs, the
pressure difference at each frame was obtained by (where index A refers to
Aorta or Atrium):
$$P_A - P_{LV}=\frac{(x_A-x_{LV})}{2}\left(\frac{\partial P}{\partial x}(LV)+\frac{\partial P}{\partial x}(A)\right)+\frac{(y_A-y_{LV})}{2}\left(\frac{\partial P}{\partial y}(LV)+\frac{\partial P}{\partial y}(A)\right) $$ with, for instance, the
derivative of the pressure with regard to x for the LV ROI:$$\frac{\partial P}{\partial x}(LV)=-\rho \frac{\partial v_x}{\partial t}(LV)-\rho \left[v_x(LV)\frac{\partial v_x}{\partial x}(LV)+v_y(LV)\frac{\partial v_x}{\partial y}(LV)\right]$$
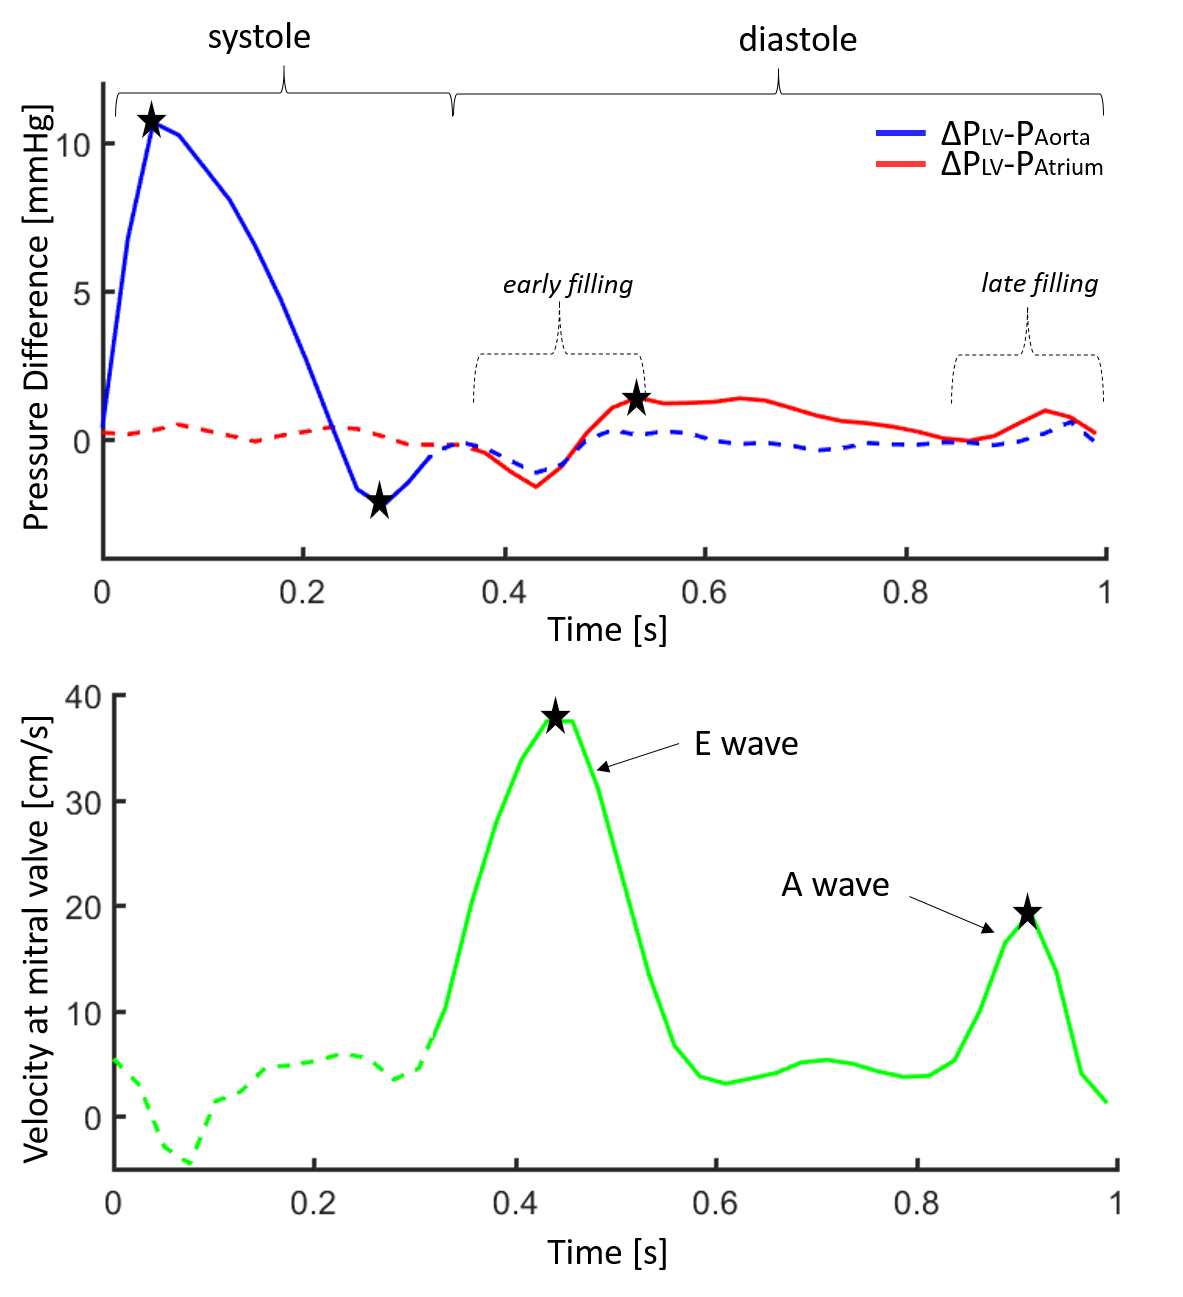
Typical pressure difference curves are shown Figure 2 (top) for a full cardiac cycle and are similar to published work1-3. Additionally, mitral valve velocity was measured in order to estimate the E and A wave amplitudes. A mitral valve ROI was defined (see Figure 1) and the velocities across this valve measured directly on the PC image and projected on the line defined by the LV and mitral valve ROIs. An example curve is presented Figure 2 (bottom) showing two distinct waves as expected3.
Statistical Analysis: For quantification, 5 landmarks were manually defined on the curves (Figure 2): from the pressure difference between LV and Aorta, the maximum and minimum peaks are recorded; from the pressure difference between LV and Atrium, the first positive peak is recorded; from the mitral valve velocity, the E and A wave amplitudes are recorded. Intra-observer variability of these parameters was measured by performing the same analysis twice 10 days apart by the same observer (definition of the ROIs and selection of the landmarks). Additionally, the variability in these measurements between two scans of the same volunteers (test-retest) was assessed. Bland-Altman coefficients of variation, Pearson’s correlation and Student’s t-test p-values were measured statistically using Matlab.
Results
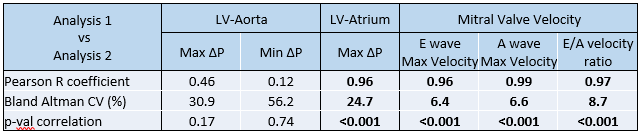
Intra-observer reproducibility: Table 1 reports the variability values for all studied parameters between the two analyses. Results show very good reproducibility for all inflow parameters (mitral valve velocity and pressure between LV and atrium) but unreliable measurements for outflow parameters (pressure between LV and AO).
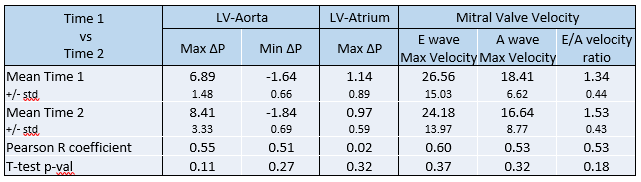
Test-retest: Table 2 reports the variability values for all studied parameters between the two scans. Poor to fair correlation is reported for all measurements, which are therefore not constant over time. However, there was no significant difference in t-test group-wise comparison between the two time points.
Discussion and Conclusion
Pressure and velocity parameters measured from the inflow (from atrium to LV) seem to be reliably measured using PC-MRI with the described method hence could potentially help in the characterization of filling abnormalities. This was not the case for the outflow parameters despite our best case scenario experiments (healthy controls, one observer) which suggests that outflow might be more turbulent than inflow. Test-retest experiment showed that individual parameters were not constant over time, even for healthy controls, which therefore questions the diagnostic value of PC-MRI pressure measurement. However, group-wise comparison might be useful since group statistics were conserved between the two scans. Comparison of these parameters with diastolic dysfunction patients should answer this open question.Acknowledgements
No acknowledgement found.References
1. Richard B. Thompson* and Elliot R. McVeigh, Fast Measurement of Intracardiac Pressure Differences With 2D Breath-Hold Phase-Contrast MRI, Magnetic Resonance in Medicine 49:1056–1066 (2003).
2. Eriksson, Jonatan, et al. "Spatial heterogeneity of four‐dimensional relative pressure fields in the human left ventricle." Magnetic resonance in medicine 74.6 (2015): 1716-1725.
3. Jain, Snigdha, et al. "MRI assessment of diastolic and systolic intraventricular pressure gradients in heart failure." Current heart failure reports 13.1 (2016): 37-46.
Figures