2935
Local Pulse Wave Velocity from 4D-Flow MR applied in Familial Hypercholesterolemia patients.1Biomedical Imaging Center, Pontificia Universidad Catolica de Chile, Santiago, Chile, 2Electrical Engineering, Pontificia Universidad Catolica de Chile, Santiago, Chile, 3Radiology, University of Texas Southwestern, Dallas, TX, United States, 4Biomedical Engineering, University of Texas Southwestern, Dallas, TX, United States, 5Institute for Biological and Medical Engineering, Pontificia Universidad Catolica de Chile, Santiago, Chile, 6Radiology, Pontificia Universidad Catolica de Chile, Santiago, Chile
Synopsis
We propose an improved methodology1 to automatically estimate local 3D Pulse Wave Velocity (PWV) measurements for quantifying local alterations due to aortic distensibility using 4D flow data. 18 volunteers and 25 patients with Familial Hypercholesterolemia (FH) were evaluated using the proposed method. The results show the prevalence of higher values of PWV in FH patients than volunteers, particularly in the ascending aorta (
Introduction
Hypercholesterolemia is the presence of abnormally high levels of cholesterol in the blood, and familial hypercholesterolemia (FH) is a genetic disorder that is passed down through the family2. Its effect on hemodynamics can produce several complications in the Cardiovascular (CV) system, and the evaluation of its consequences at early stages is therefore of utmost importance. One particular parameter that seems to be affected in this population is the aortic PWV. Traditional methods for measuring PWV usually obtain one averaged value along the aorta, by measuring visible time-shifts in waveforms between AAo and pDAo. In this work, we propose an improved methodology to recover continuous 3D PWV map using noninvasive 4D-Flow MRI applied to FH patients.Methods
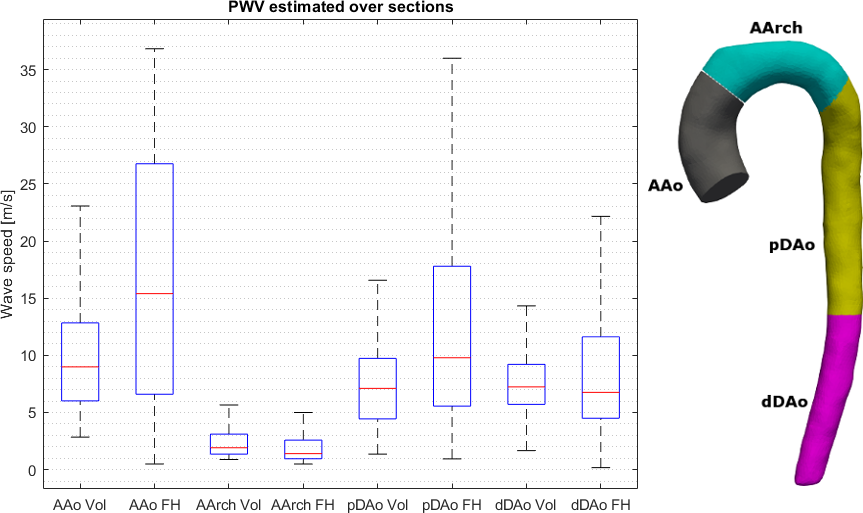
The aorta is segmented using PC-MRI data. Then, an Eikonal solver obtains the geodesic distance from the inlet automatically. An implicit algorithm3 calculates flow waveforms accurately over isosurfaces without manual interpolations over some arbitrary planes. The time interpolation for waveforms considers Fourier series, with $$$\Delta t_{interp}$$$ as time-step. The time-delay, i.e., the time required for a wave to travel a given distance, is obtained by cross-correlation. To improve the analysis, each waveform is perturbed with random noise of 5% with respect to the maximal amplitude, generating 10 new realizations for each waveform. Considering that the information travels at a finite speed, the cross-correlation, regarding all possible combinations, is evaluated only if the couple of waveforms are separated by, at least, a minimal reliable distance, estimated from the relation $$\Delta d \geq PWV_{max} \times \Delta t_{interp},$$ where $$$ PWV_{max}$$$ is the upper bound for PWV. To recover the areas neglected by this criteria, we consider three references for cross-correlations: at the inlet, in the middle and the outlet of the aorta. Finally, the application of a monotonically increasing filter to the time-delay curve convey an improved estimation of PWV for full aorta. The solution is extrapolated to 3D using the distance map. To compare different evaluations of PWV, we consider 100 equispaced isosurfaces over each segmented aorta, for a population of 18 healthy volunteers (30.40±6.32 yes, BMI 23.31±6.52, 10 men) and 25 patients with FH (14.6±3.3 yrs, BMI 23.4±6.7, 11 men). In those subjects, a 4D flow sequence with the following parameters was used: Reconstructed voxel size from 2 to 2,5 mm on each side, TR(ms)/TE(ms) = 4.8/2.7. The PWV values were divided into four sections of the Aorta, and the t-test student found significative differences in groups AAo and pDAo (p=0.0032 and p=0.0011, resp.) and do not reject the test for AArch and dDAo groups (p=0.644 and p=0.075, resp.)Results
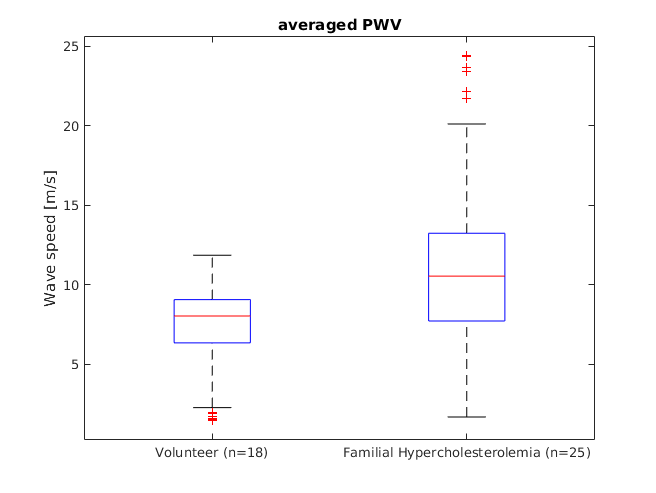
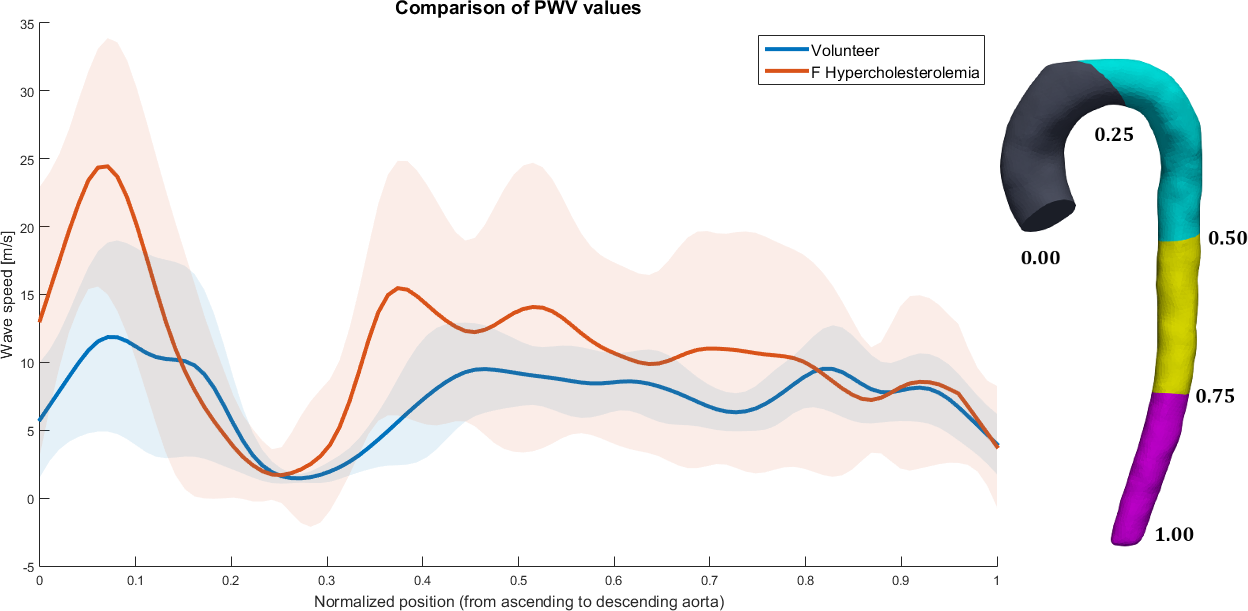
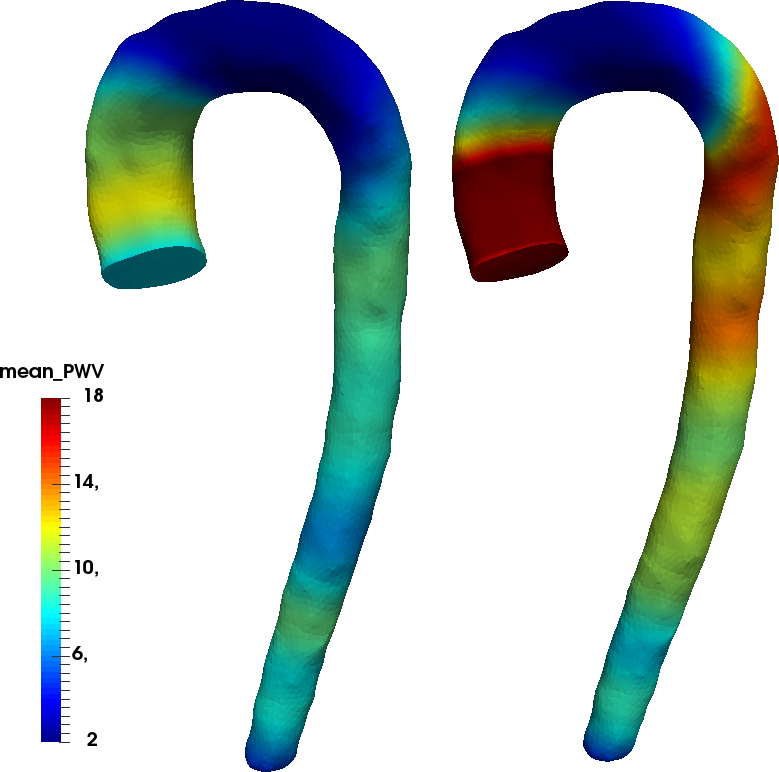
In figure 1, the averaged value of the PWV along the aorta is shown, similarly as in4, evidencing a mean increased by 31% for FH patients in comparison to normal. In FH the mean PWV is 10.5 [m/s] contrasted with 8.05 [m/s] in volunteers. Figure 2 shows the evaluation of continuous mean-value of PWV along the aorta and its standard deviation using our method. The three-dimensional representation of the results shown in figure 2 is presented in figure 3, marking regions with different PWV values in the AAo and pDAo, while the AArch and dDAo show similar ones. In figure 4, we show the mean value of PWV in four sections of the aorta. We observed a local PWV increase in patients compared to volunteers, confirming the results shown in figure 3.Discussion and Conclusion
We propose and apply a novel methodology to estimate continuous values of PWV in volunteers and FH patients. The main advantage of the method is that allows detecting local changes in PWV along the aorta, in contrast to traditional methods, which obtain an averaged value of PWV in the entire aorta. Applying the method to FH patients, we found increased values of PWV in comparison to volunteers. Our method was able to show that mayor increments of PWV were located in AAo and pDAo sections. Special attention has to be paid to turbulences that may deteriorate the performance of the method, making necessary the application of additional perturbations and monotonic filters. The presented method is fast and non-invasive, demonstrating an excellent agreement with expected values (in the range of 2-15 [m/s] for volunteers and higher for patients), providing interesting information about the aorta distensibility.Acknowledgements
We would like to acknowledge to CONICYT-PIA-Anillo ACT1416, CONICYT FONDEF/I Concurso IDeA en dos etapas ID15|10284 and FONDECYT #1141036 grants. JS acknowledge FONDECYT Postdoctorado 2017 grant #3170737.References
1. Mura J, Sotelo J, Montalba C, Ruijsink B, Nordsletten D, Razavi R, Irarrazaval P, Tejos C, Andia M, Uribe S, “An automatic method to estimate 3D Pulse Wave Velocity from 4D-flow MRI data”. ISMRM annual meeting 2017, poster no.2826, Honolulu, USA.
2. Durrington P, “Dyslipidaemia.” The Lancet 2003;362:717-731.
3. Zahedi S, Tornberg AT, “Delta function approximations in level set methods by distance function extension.” J. Comput. Phys. 2010;229:2199-2219.
4. Markl M, Wallis W, Brendecke S, Simon J, Frydrychowicz A, Harloff A, “Estimation of global aortic pulse wave velocity by flow-sensitive 4D MRI.” Magn Reson Med 2010;63:1575-1582.
Figures