2934
A Comparison of PC-MRI Eddy Current Correction Methods in the Presence of Noise1Bioengineering, UCLA, Los Angeles, CA, United States, 2Radiological Sciences, UCLA, Los Angeles, CA, United States
Synopsis
Eddy current induced phase errors lead to PC-MRI velocity errors that must be corrected. Static tissue fitting is commonly implemented to correct these phase errors. The aim of this work was to quantitatively compare corrections made using local and global static tissue fitting techniques over a wide range of SNR. Average correction differences between local and global strategies in static tissue were on the order of 0.9 cm/s for low SNR protocols and 0.1 cm/s for high SNR protocols. Local correction introduced phase error in ~5% ROIs (always when SNR<30). Local correction is therefore suitable for higher SNR PC-MRI acquisitions.
Introduction
Despite advances in gradient hardware1,2, eddy current induced phase errors remain a problem for quantitation in PC-MRI. Eddy current induced phase errors lead to velocity errors (veddy) observed to be as large as 10% - 25% in certain applications3. The goal of static tissue correction is to mitigate the impact of eddy current induced phase errors. Studies have shown reduction of velocity bias in background tissue on the order of 60% for local static tissue corrections and 50% for global static corrections, with no statistical difference found between the two schemes3. It is hypothesized that local correction strategies are less robust to noise influences, as these strategies utilize phase estimates from a significantly smaller subset of static pixels to generate a polynomial fit describing eddy current error. The performance differences between local and global correction strategies have yet to be thoroughly characterized for a wide range of SNR, and is therefore an aim of this work.Methods
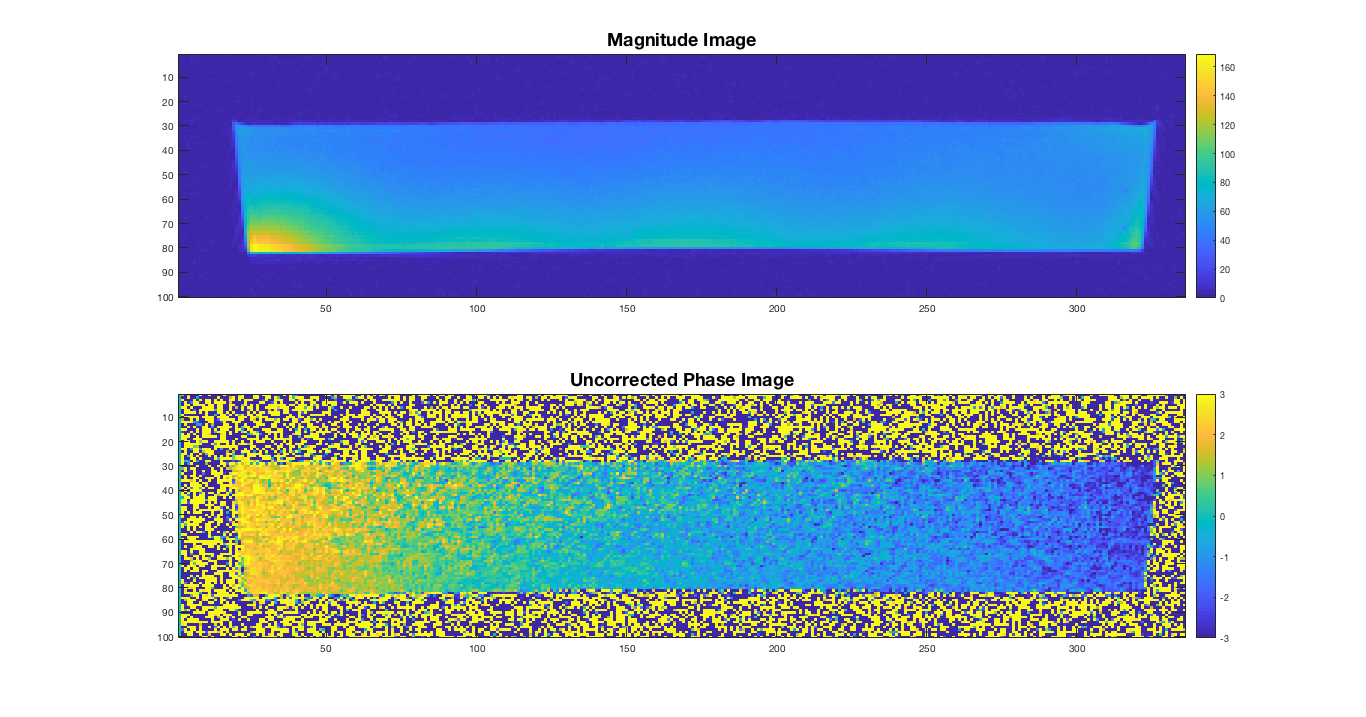
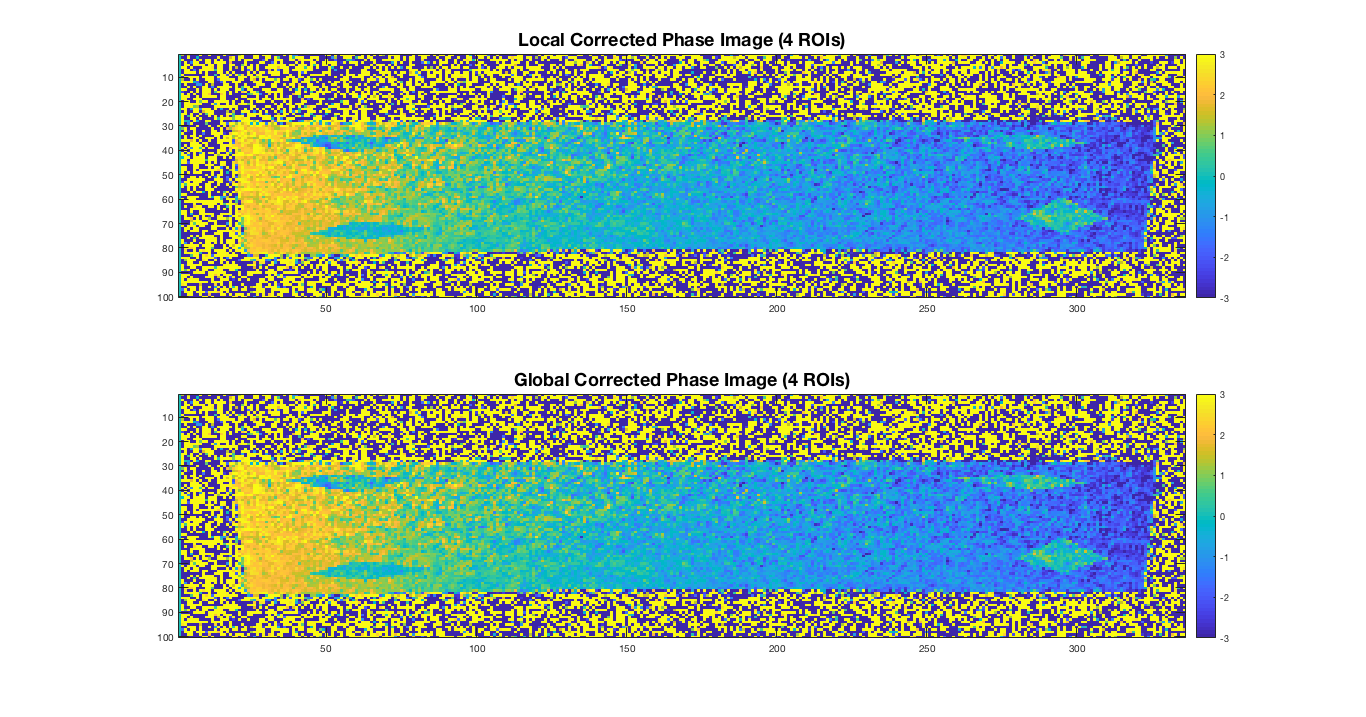
An adult torso sized phantom was filled with a polyacrylic acid gel slurry to minimize motion during the imaging experiment. Axial slices were acquired at 3.0T (Siemens, Prisma) using a 3D velocity encoding protocol with the following acquisition parameters: VENC=80 cm/s, 6° flip angle, TE=3.37 ms, TR=5.16 ms, 1355 Hz/pixel bandwidth, 133x450 mm FOV, 1.78x1.78 mm2/pixel resolution. This is a deliberately low SNR acquisition, and the number of averages was increased incrementally from 1 to 64 for subsequent acquisitions to obtain higher SNR datasets. ROIs of varying shape and size were established within static tissue in axial slices, and this process was repeated for datasets with varying number of averages (i.e. SNR). The same 24 ROIs are prescribed across different SNR datasets, to obtain a total of 144 ROIs. 7 of 144 ROIs were discarded as they displayed non-significant phase offset prior to correction, resulting in a total of 137 ROIs analyzed. Local correction utilized phase estimates from a 3-pixel width annulus surrounding ROIs to generate a polynomial fit describing eddy current phase error, similar to previous studies3. Global correction utilized phase estimates from all static pixels within the FOV, excluding ROI pixels, to develop a polynomial fit. Corrected phase estimates were obtained within ROIs upon subtraction of polynomial offset estimates on a pixel basis. Local and global polynomial fits were second order in x and y, and were generated using least-squares methods. Local and global corrections were separately applied to all established ROIs. Successful eddy current correction of static ROIs results in a mean velocity value that is significantly closer to zero baseline following correction. Corrections that result in a ROI mean velocity that is farther away from zero baseline are considered unsuccessful, as they introduce phase error. The magnitude of the difference between local and global corrected mean velocities was calculated and averaged for all ROIs pertaining to a single dataset. SNR levels were calculated for each dataset by dividing the mean signal within the static phantom by the standard deviation of background noise.Results
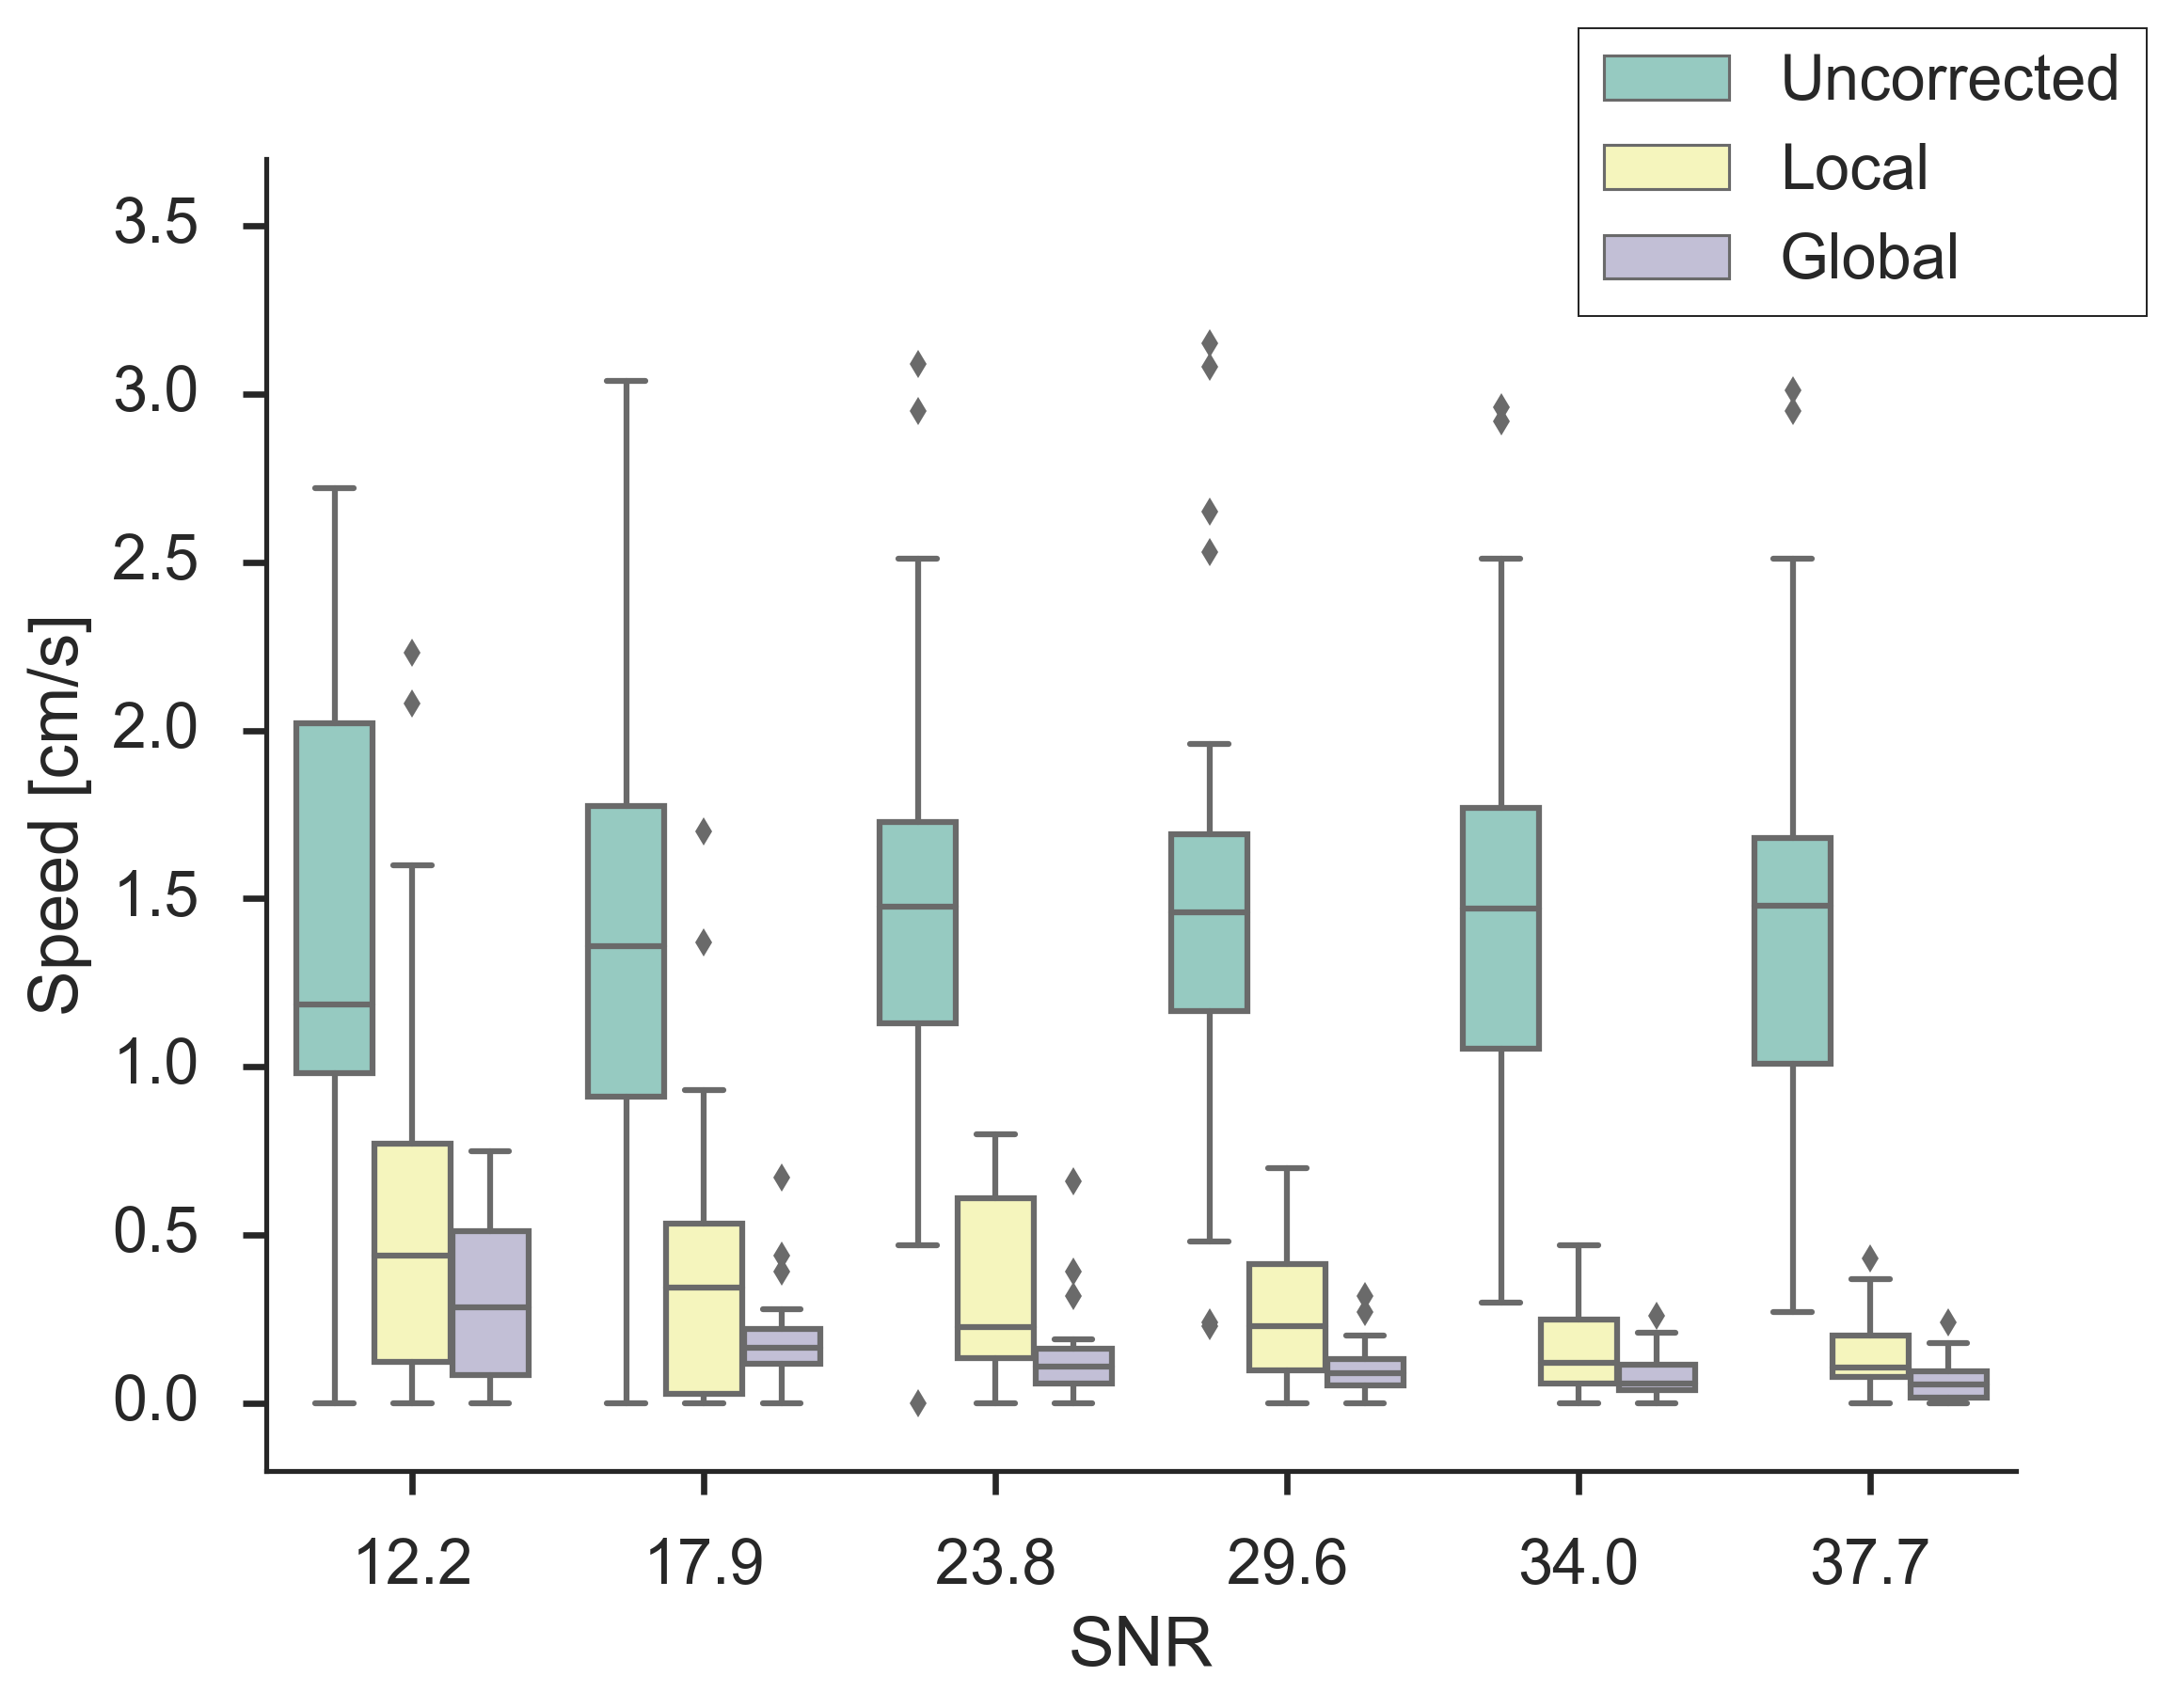
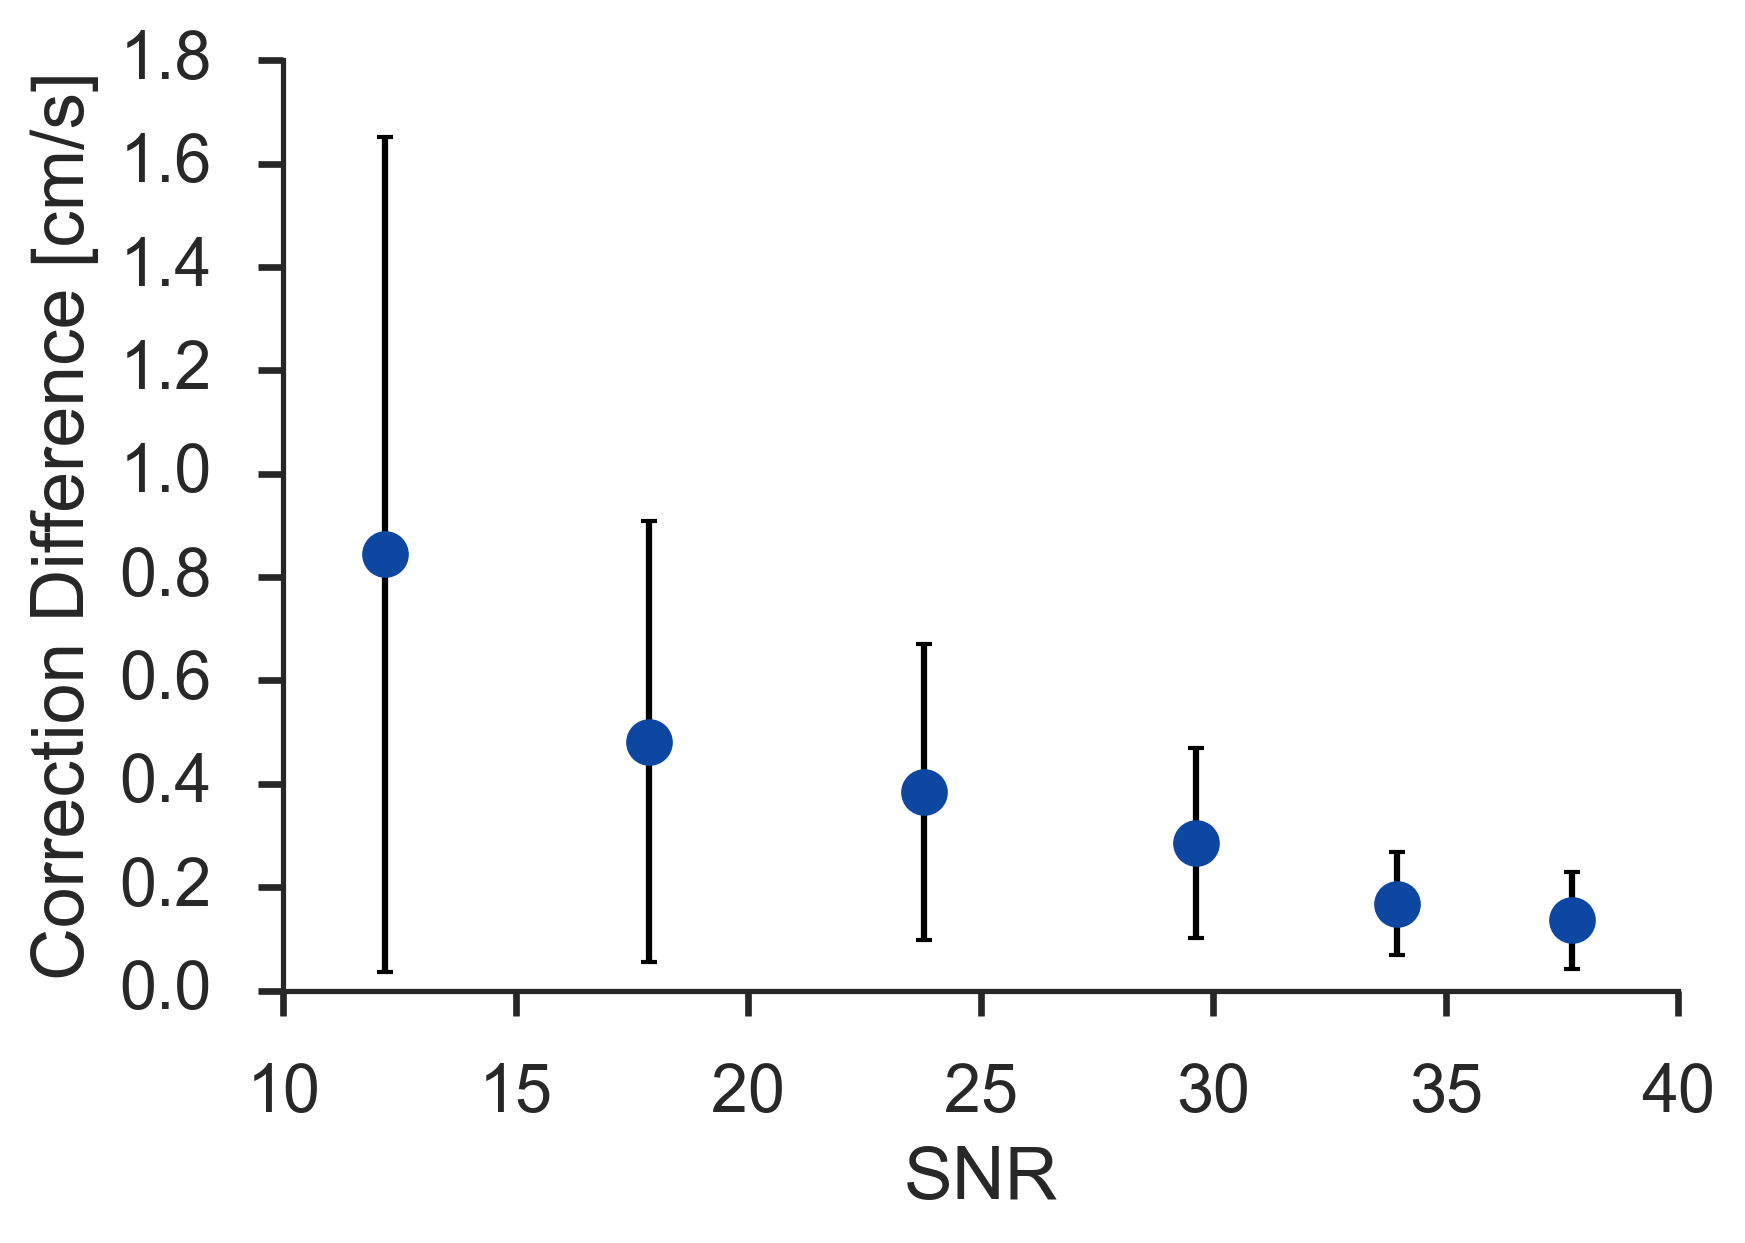
137 of 137 established ROIs displayed mean velocity values that were significantly closer to zero baseline following global corrections. 130 of 137 established ROIs displayed mean velocity values that were significantly closer to zero baseline following local corrections, while 7 were further from zero, indicating that additional error was introduced. These errors were all introduced during correction in datasets with an average SNR below 30. Of the 48 ROIs established in datasets with average SNR above 30, global fitting provided a closer correction to zero baseline in 35 of 48 ROIs and local fitting provided a closer correction to zero baseline in 13 of 48 ROIs. The resulting average correction difference vs. SNR plot (Fig 4) shows that there is more disagreement between correction methods as SNR decreases. Correction differences as large as 0.9 cm/s were observed between the two strategies for the lowest SNR protocols.Discussion
Local static tissue fitting techniques were seen to occasionally introduce phase error when average SNR of the implemented protocol fell below 30. As average SNR continued to decrease below 30, local fitting techniques began to introduce error with increased occurrence. Global fitting techniques showed no instances of introducing phase error across all average SNR levels. This study indicates that local fitting strategies may only be suitable above a certain SNR, and warrants further investigation. For datasets with average SNR above 30, performance difference between the two fitting strategies is highly ROI dependent.Acknowledgements
No acknowledgement found.References
1. Bernstein et al. Handbook of MRI pulse sequences: Ch 10. 2004.
2. Kozerke et al. Analysis and correction of background velocity offsets in phase-contrast flow measurements using magnetic field monitoring. Mag Resonance Med. 2012.
3. MacDonald et al. Phase error correction in time-averaged 3D phase contrast MRI of cerebral vasculature. PLOS One. 2016.
Figures