2933
Measuring cardiac output and leg blood flow with phase-contrast MRI during supine cycling exercise.1Flow, Maxima Medical Center, Eindhoven, Netherlands, 2Medical University Center Groningen, Groningen, Netherlands
Synopsis
Patients with chronic heart failure suffer from diminished leg blood flow (LBF). Question remains to what extent the distribution or the cardiac output (CO) is responsible. This study investigates whether CO and LBF could be measured reliably using phase contrast MRI during supine exercise. 10 healthy subjects performed a supine exercise test in the MRI at two days at different exercise intensities. Comparison between both days showed promising reproducibility of measuring CO and LBF during supine cycling in the MRI although LBF measurements proved more challenging.
Introduction
Patients with chronic heart failure suffer from exercise intolerance. Exercise performance is (partly) limited because of reduced leg blood flow (LBF)1-5. LBF is depended on cardiac output (CO) and the distribution factor (DF), that is: the fraction of the CO that is distributed to the legs. Question remains to what extent the DF or CO is causing the reduced LBF. Current measurements were set up to investigate whether CO (blood flow in ascending aorta) and LBF (blood flow in the abdominal aorta, distal from the arteries to the upper body and vital organs) could be measured reliably using phase contrast MRI (PC-MRI) while subjects performed supine cycling exercise inside an MR environment.Methods
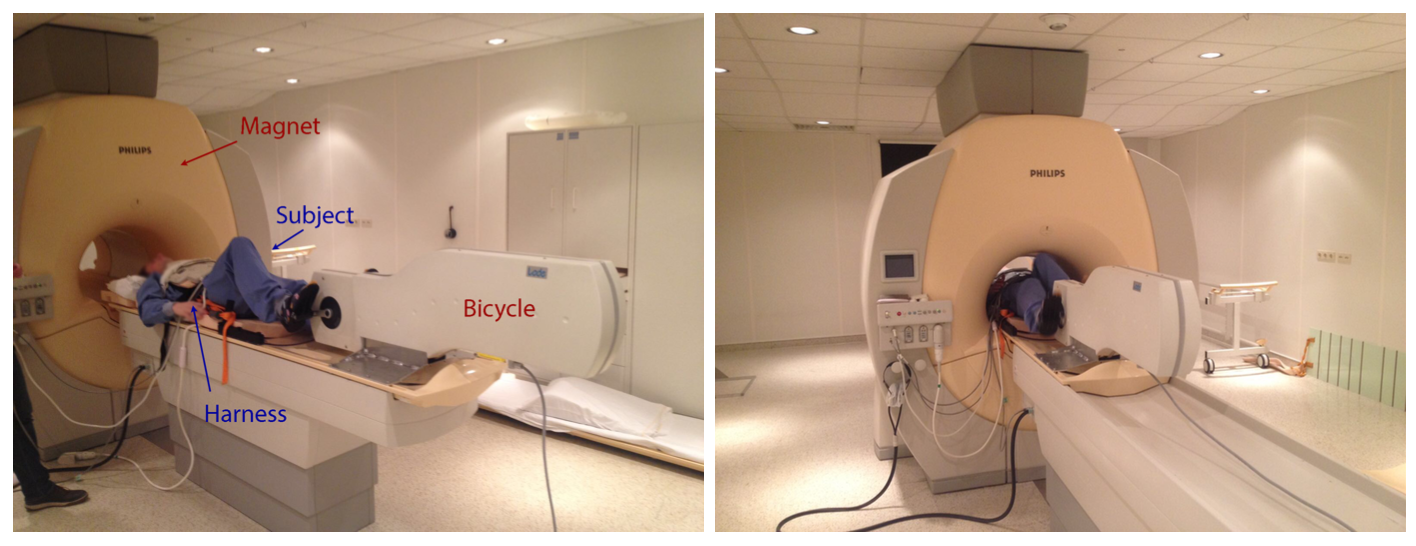
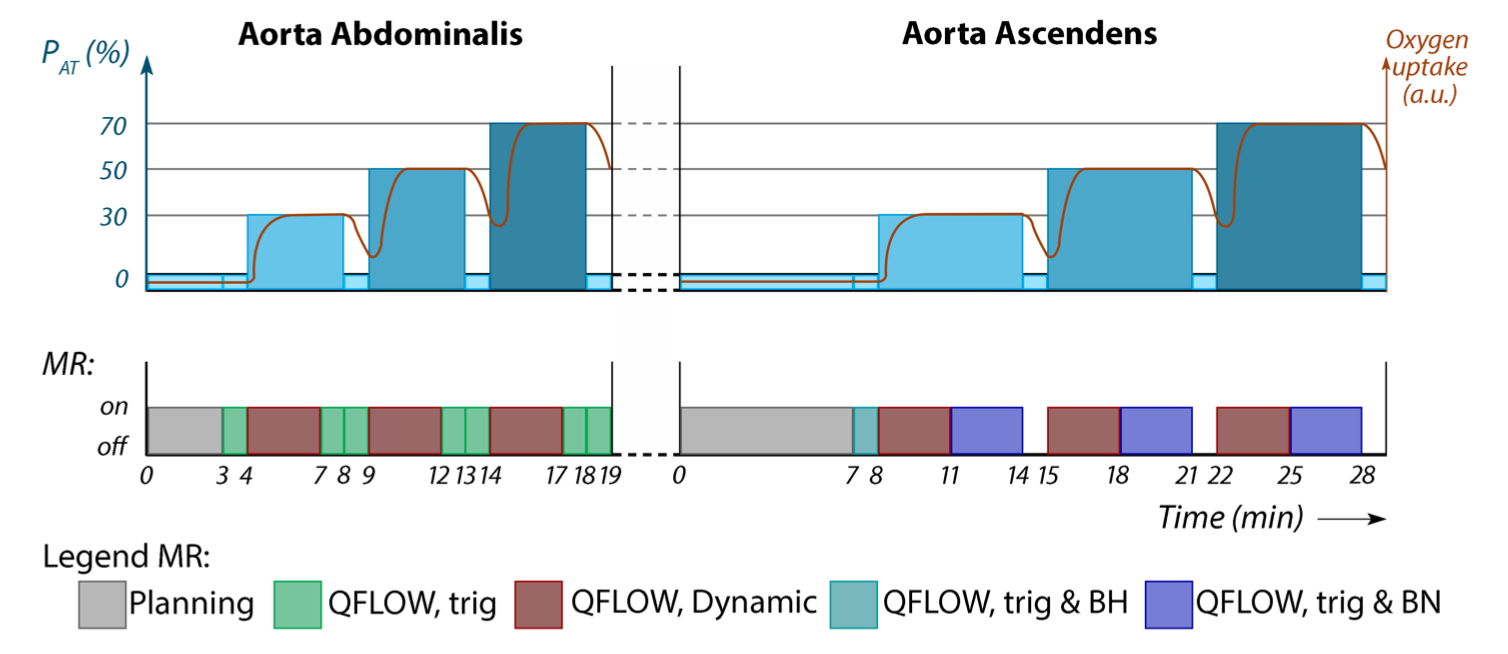
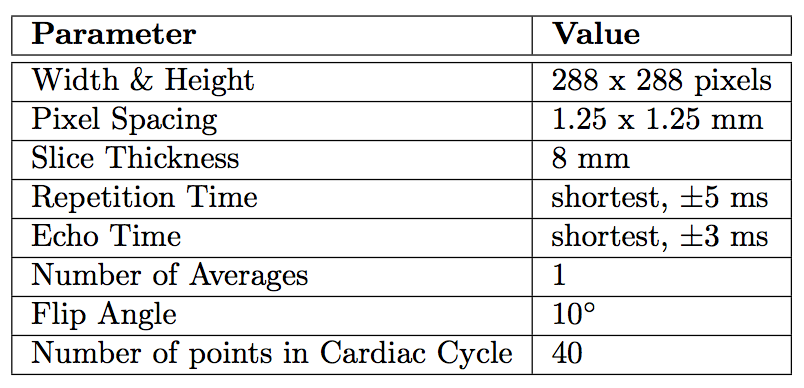
10 healthy subjects performed a similar exercise protocol (figure 1) in the MRI (Philips Achieva 3T, Eindhoven, The Netherlands) on a supine cycling ergometer (Lode, Groningen, The Netherland) at two days, with a minimal resting period of one day. Prior, subject performed a maximal cardio-pulmonary exercise test (CPET) on a stationary bike (Lode, Groningen, The Netherlands). During this CPET the workload at anaerobic threshold (PAT) was assessed to determine intensities for exercise in the MRI. Exercise protocol is depicted in figure 2. After a measurement at rest, three exercise intensities where performed at respectively 30%, 50%, and 70% of PAT, with 1 minute rest in between. Measurement of blood flow was performed after cycling three minutes at each intensity, to ensure steady state exercise. Cardiac triggering for both CO and LBF was performed using a peripheral pulse unit (PPU). A breathing navigator was used to ensure measurement of blood flow at the same level in the ascending aorta. Velocity encoding was adjusted for every exercise intensity and entity that was measured (see table 1 for the MRI settings). Data acquisition was stored in DICOM-format for offline analysis using matlab (Mathworks, Matlab R2014a). The differences in blood flow between both days per exercise intensity are expressed in percentages. Reproducibility in blood flow where considered good when difference was <10%, reasonable when between 10-20%, moderate when between 20-30% and bad when >30%.Results
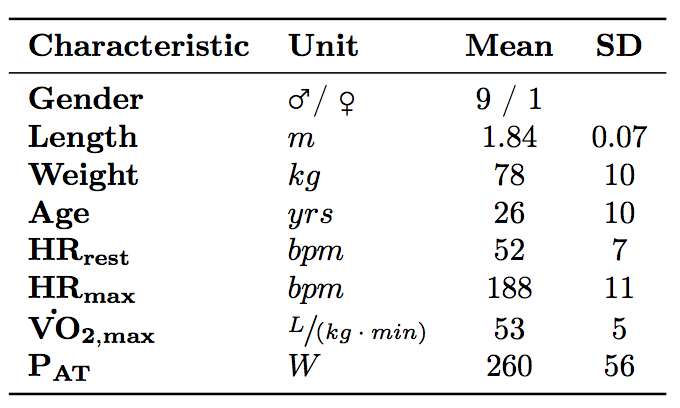
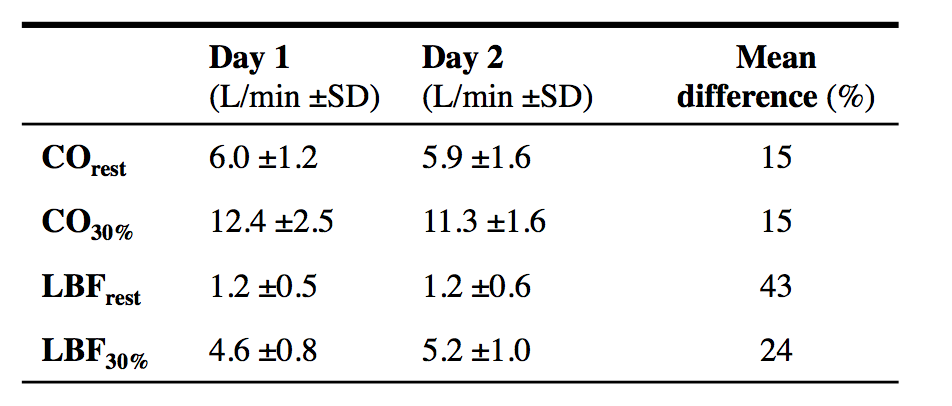
All 10 subjects completed both the exercise tests (see table 2 for basic characteristics). However, due to technical issues (e.g. PPU triggering) at heart rates of 30%, 50%, and 70% PAT, measurements of respectively 1, 4, and 7 subjects was not achieved. Therefore only the results of the measurements during rest and 30% PAT is presented. Table 3 shows general results. Mean difference of CO during rest and 30% PAT between day 1 and 2 was for both intensities 15%. 5 out of 10 subjects had a good reproducibility, 3 where reasonable, 1 was moderate and 1 had a bad reproducibility. At 30% PAT, 5 are reviewed as good, 3 as reasonable and 2 as bad. Mean difference of LBF during rest and 30% PAT was respectively 43% and 24%. Of the LBF in rest there was 1 reviewed as good, 2 as reasonable, 3 as moderate and 4 as bad. During LBF measurement at 30% PAT there was 1 subject rated as good reproducibility, 2 as reasonable, 3 as moderate and 3 as bad.Discussion
The aim of this project was to investigate reproducibility of measuring LBF and CO during exercise. CO measurements during rest and 30% PAT had reasonable reproducibility, especially when taking into account the physiological daily CO fluctuations of about 15% in rest6. The measurements with a bad reproducibility where due to movement artifacts. The LBF measurements showed less reproducibility although it improved at 30% PAT. It is likely that the daily fluctuation of LBF is larger since it is more sensitive to factors as physical activity prior to the test. Furthermore, the blood flow in rest is much less and so more sensitive to absolute measurement errors. This also explains the improvement of reproducibility during the 30% PAT where the difference in LBF as compared to CO diminishes. The movement artifacts of the LBF were bigger as compared to CO measurement, partly due to physical constraints of the MRI bore.
Future research will aim at 1) reducing motion artifacts by synchronizing data acquisition to peddle position, 2) improving measurements at higher intensity rates, and 3) focus on dynamic measurements when heart rate hasn’t reached steady state yet.
Conclusion
This study shows promising reproducibility of measuring CO and LBF during supine cycling in the MRI although LBF measurements proved more challenging. Future improvements are anticipated by using wider MRI bore and improved cardiac triggering which should eventually lead to medical applications.Acknowledgements
References
1. Esposito, F., Mathieu-Costello, O., Shabetai, R., Wagner, P. D. & Richardson, R. S. Limited maximal exercise capacity in patients with chronic heart failure: partitioning the contributors. J. Am. Coll. Cardiol. 55, 1945–54 (2010).
2. Kemps, H. M. C., Prompers, JJ., Wessels, B., De Vries, W.R., Zonderland, M.L., Thijssen, E.J.M., Nicolay, K., Schep, G., & Doevendans, P.A.F.M. Skeletal muscle metabolic recovery following submaximal exercise in chronic heart failure is limited more by O 2 delivery than O 2 utilization. Clin. Sci. 118, 203–210 (2010).
3. Miyazaki, A., Adachi H., Oshima, S., Taniguchi, K., Hasegawa, A. & Kurabayashi, M. Blood flow redistribution during exercise contributes to exercise tolerance in patients with chronic heart failure. Circ. J. 71, 465–470 (2007).
4. Poole, D. C., Hirai, D. M., Copp, S. W. & Musch, T. I. Muscle oxygen transport and utilization in heart failure: implications for exercise (in)tolerance. Am. J. Physiol. Heart Circ. Physiol. 302, H1050–63 (2012).
5. Sullivan, M. J., Knight, J. D., Higginbotham, M. B. & Cobb, F. R. Relation between central and peripheral hemodynamics during exercise in patients with chronic heart failure. Muscle blood flow is reduced with maintenance of arterial perfusion pressure. Circulation 80, 769–781 (1989).
6. Grollman, A. Variation in the cardiac output of man VIII, the constancy of the Cardiac Output form Day to Day throughout the Year. Journal of Clinical Investigation, vol. 8, pp. 25-32 (1929).
Figures