2932
Wall shear stress analysis after anatomically pre-shaped 90°- and straight ascending aortic grafts: A comparison between prostheses and age-matched volunteers using 4D Flow MRI1Department of Radiology and Nuclear Medicine, University Hospital Schleswig-Holstein, Campus Lübeck, Lübeck, Germany, 2Department of Cardiac and Cardiothoracic Vascular Surgery, University Hospital Schleswig-Holstein, Campus Lübeck, Lübeck, Germany, 3Fraunhofer MEVIS, Bremen, Germany
Synopsis
Patients with aortic prostheses following aneurysm/dissection repair demonstrate an increased number of secondary aortic flow patterns. These may result in elevated forces acting on the vessel wall and thus preterm degenerative changes. Anatomically pre-shaped 90°-prostheses promise more physiological flow patterns and wall shear stress (WSS). The aim of this study was to compare WSS of patients with straight prostheses (n=8), 90°-prostheses (n=9) and healthy volunteers (n=12) based on 4D Flow MRI. Results revealed a tendency towards decreased WSS in regions distal to the 90°-prostheses, whereas in comparison to healthy volunteers, WSS values in patients with both prostheses were significantly increased.
Purpose:
Patients with aneurysms or dissections of the ascending aorta are routinely treated by implantation of a straight aortic prosthesis. Anatomical changes in straight prostheses are known to result in disturbed flow characteristics [1,2] and increased numbers of secondary flow patterns [3]. It appears straightforward that these flow patterns result in elevated mechanical stress of the vessel wall. The wall shear stress (WSS) can be derived from 4D Flow MRI. Changes in WSS have been shown to be associated with the induction of vessel wall degeneration, aneurysm growth [4] and may have an impact on post-procedural development of aneurysms. To avoid unwanted flow and WSS changes induced by altered geometry [3], physiologically pre-shaped 90°-prostheses have been introduced [5]. These prostheses promise to overcome geometry-induced shortcomings of straight prostheses by more optimal or near-physiological flow patterns. Hence, the aim of this study was to compare differences of various WSS aspects between both the straight and the physiologically pre-shaped 90°-prostheses and age-matched volunteers.Methods:
MRI scans: 9 patients with 90°-prostheses (“Pat90”,8m,age 62±9y.), 8 patients with straight prostheses (“Pat0”,8m,59±9y.) and 12 age-matched volunteers (“Vol”,2m,age 55±6y.) were examined after IRB approval and written informed consent. A 4D Flow MRI sequence with adaptive respiratory gating and retrospective ECG-triggering was used with identical imaging protocols on either a 3T Ingenia or 3T Achieva MRI-Scanner (Philips, The Best, Netherlands) with a 20-channel body coil. Typical imaging parameters were Venc=180-200cm/s; TR/TE 3.6/2.3ms, parallel imaging (SENSE). Data was acquired with an isotropic resolution of 2.4mm, reconstructed to 2mm and 20 time frames per RR-interval. Depending on each individual’s heart rate an effective temporal resolution of 34-61ms was achieved. Imaging parameters were in concordance with the consensus paper of Dyverfeldt et al. [6].
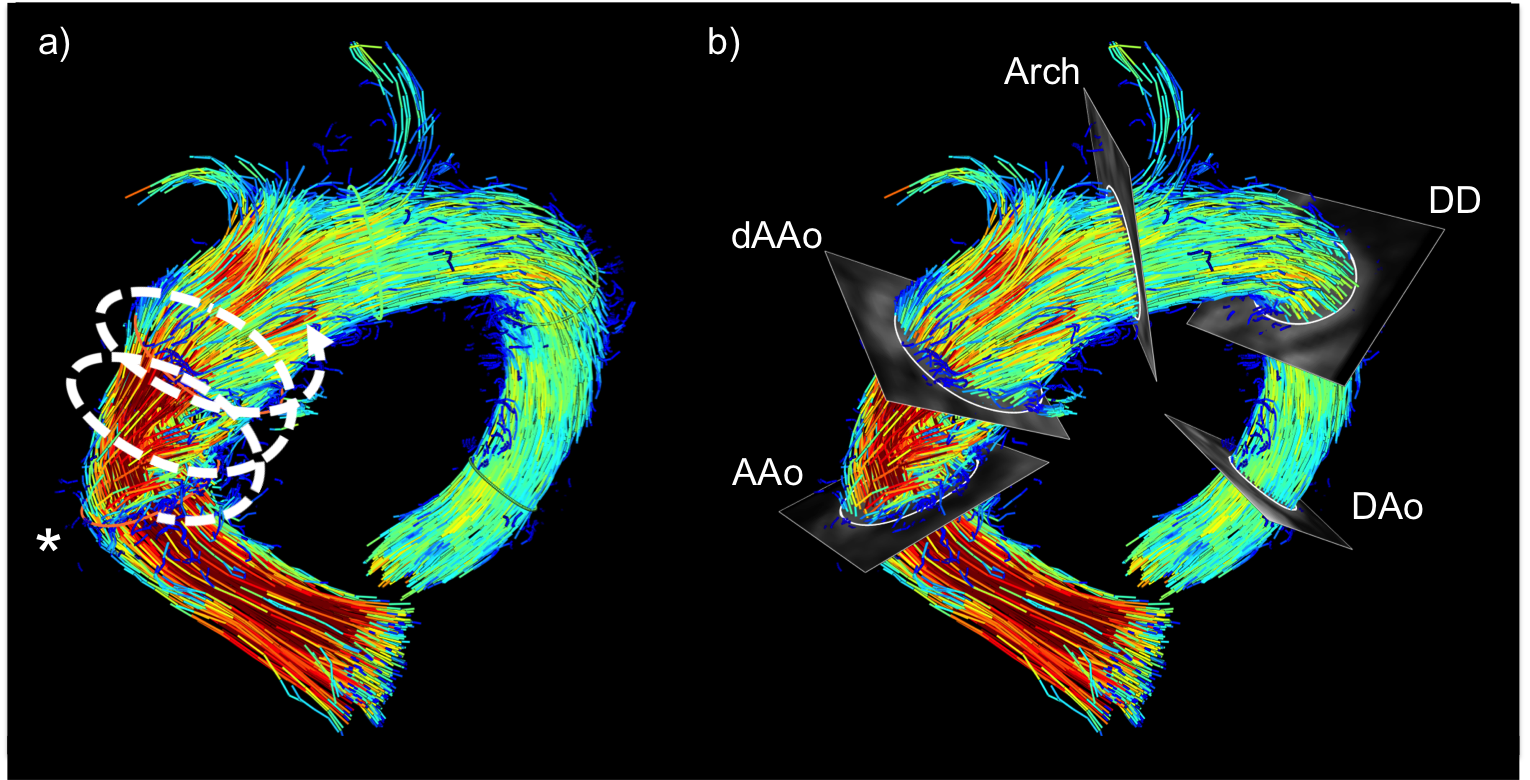
Data processing and analysis: WSS analysis was performed using GTFlow (v2.1.15; GyroTools LLC, CH). Five analysis planes orthogonal to the vessel course were manually placed at reproducible anatomical landmarks (Fig. 1). Vessel-contours were manually segmented and automatically divided into eight segments. WSS was derived as previously described [7]. The following WSS parameters were collected: The temporal maximum WSS per plane spatially averaged over all segments (max.WSSavg); the minimum and maximum WSS per segment and time were recorded as min. and max.WSSseg, respectively; the WSS-gradient (WSSGrad) was calculated as max.WSSseg–min.WSSseg.
Statistical analysis: All data are given as mean±standard deviation. WSS-parameters are recorded in N/m2 units. Statistical analysis included Mann-Whitney-U-test with p<0.05 indicating statistical significance.
Results:
Table 1 summarizes the results of the WSS-analysis per analysis plane. WSS per plane was similar in the proximal aorta and graft while the max.WSSavg per plane distal to the graft was decreased comparing patients with prosthesis and age-matched controls. Conversely, the max.WSSseg revealed an opposite behavior with increased values in the proximal aorta and graft of patients that decreased distal to the prosthesis (for all, p=n.s.). Similarly, there was a tendency towards a lower WSSGrad downstream the 90°-prosthesis in the aortic arch (Pat90: 1,80±0,75; Pat0 straight: 2,11±0,76; Vol: 2,10±0,31, p=n.s.) and the ductus diverticulum (Pat90: 1,61±0,64; Pat0: 1,97±0,34; Vol: 2,09±0,39, p=n.s.) in comparison to patients with straight prostheses and volunteers. Both prostheses revealed an increased WSSGrad in comparison to volunteers in the proximal ascending Aorta (Pat. 90°: 1,44±0,56; Pat. straight: 1,38±0,47; Vol: 0,73±0,29; p<0.05 for each) and the distal prosthesis (Pat. 90°: 1,66±0,89; Pat. straight: 1,66±0,55; Vol: 0,82±0,67; p<0.05 for each). Differences between straight and 90°-prostheses did not reach statistical significance.Discussion and Conclusion:
In our data, reduced WSS-values distal to the graft and similar to increased per-plane and segmental WSS values are contrasted by markedly increased WSSGrad results in vessel sections adjacent to the 90°-prostheses. On one hand, WSSGrad changes may indicate a reduction of potentially harmful flow and resulting WSS differences inducing preterm degenerative changes distal to the 90°-prostheses. On the other hand, knowing that there should be a decrease in secondary flow patterns in the pre-shaped grafts, WSSGrad may be a more sensitive marker of WSS changes. However, the reasons for WSSGrad also being reduced in comparison between patients with 90°-prostheses and healthy volunteers need to be further investigated. As opposed by the WSS magnitude and its maximum, there is sparsity regarding the relevance of WSSGrad. Our finding implies that it may be a parameter worth additional research. Our data further confirm altered hemodynamic conditions in patients with artificial aortic prostheses and the applicability of WSS to quantify these differences. However, to further assess correlation with clinical outcome higher patient numbers in longitudinal studies need to be examined.Acknowledgements
The authors express their gratitude toward Mrs. Martina Schroeder for her skillful assistance and Dr Gerard Crelier for his continuous support.References
1) Markl M, Draney MT, Miller DC, et al. Time-resolved three-dimensional magnetic resonance velocity mapping of aortic flow in healthy volunteers and patients after valve-sparing aortic root replacement. J Thorac Cardiovasc Surg 2005;130(2):456-463.
2) Francois CJ, Markl M, Schiebler ML, et al. Four-dimensional, flow-sensitive magnetic resonance imaging of blood flow patterns in thoracic aortic dissections. J Thorac Cardiovasc Surg 2013;145(5):1359-1366.
3) Oechtering TH, Haegele J, Hunold P, et al. 4D Flow MRI: Analysis of Aortic Hemodynamics after Valve-Sparing Aortic Root Replacement with an Anatomically Shaped Sinus Prosthesis. ISMRM 2015 #2725
4) Fillinger MF, Marra SP, Raghavan ML, Kennedy FE. Prediction of rupture risk in abdominal aortic aneurysm during observation: wall stress versus diameter. J Vasc Surg 2003;37(4):724-732.
5) Misfeld M, Scharfschwerdt M, Sievers HH. A novel, form-stable, anatomically curved vascular prosthesis for replacement of the thoracic aorta. Ann Thorac Surg 2004;78(3):1060-1063; discussion 1063.
6) Dyverfeldt P, Bissell M, Barker AJ, et al. 4D flow cardiovascular magnetic resonance consensus statement. J Cardiovasc Magn Reson 2015;17:72.
7) Stalder AF, Russe MF, Frydrychowicz A, Bock J, Hennig J, Markl M. Quantitative 2D and 3D phase contrast MRI: optimized analysis of blood flow and vessel wall parameters. Magn Reson Med 2008;60(5):1218-1231.
Figures