2928
4D Flow MRI-Based Aortic Pulse Wave Velocity: Systematic Analysis of the Impact of Temporal Resolution on Estimation in Patients with Aortic Atherosclerosis and Age-matched ControlsKelly Jarvis1, Alireza Vali1, Shyam Prabhakaran2, Jeremy D. Collins1, and Michael Markl1
1Radiology, Northwestern University, Chicago, IL, United States, 2Neurology, Northwestern University, Chicago, IL, United States
Synopsis
Elevated pulse wave velocity (PWV) is a measure of aortic stiffness and an indicator of cardiovascular disease. Pulse waves propagate quickly along the aorta and high-temporal resolution measurement of velocity data with full spatial coverage is needed to improve the precision of PWV estimation. This study used high-temporal resolution 4D flow MRI to assess PWV and investigate the impact of temporal resolution on PWV estimation methods (i.e. time-to-foot and cross-correlation) in patients with known atherosclerosis. The findings suggest that using cross-correlation to estimate the time-delay between flow waveforms is optimal, particularly at inferior temporal resolutions.
Introduction
Aortic pulse wave velocity (PWV) is a direct surrogate measure for aortic stiffness, which occurs with age and atherosclerosis and is a risk factor for stroke1. Aortic PWV is typically obtained non-invasively using 2D cine phase contrast (PC-MRI) to acquire unidirectional through-plane velocity encoded images at locations along the aorta. PWV is then estimated by calculating the timing difference between changes in flow waveforms at locations with known inter-plane distance. However, precision is limited by spatial coverage and acquisition of 2D PC-MRI in 2 subsequent breath-holds which may introduce differences in waveform timing and thus cause errors in PWV estimation. 4D flow MRI (i.e. 3D time resolved 3-directional velocity encoding) is a promising alternative to acquire PWV with full volumetric coverage2,3 but may be limited by temporal resolution (TR) (i.e. typically 40 ms) for characterization of pulse waves due their rapid travel times (e.g. 30-60 ms from the ascending to descending aorta). Advanced k-t GRAPPA acceleration techniques enable 4D flow MRI with improved TR (e.g. 20 ms) in a reasonable scan time (e.g. 10 minutes). The purpose of this study was to systematically evaluate 1) the feasibility of high-TR 4D flow MRI to reliably assess PWV and 2) investigate the impact of TR on PWV estimation algorithms for assessment of aortic stiffness in patients with known atherosclerosis and age-matched controls.Methods
Non-contrast free-breathing k-t GRAPPA accelerated 4D flow MRI (spatial resolution=3-3.5 x 2.3-2.6 x 2.6-3 mm3, TR=19.6 ms, venc=150 cm/s, acceleration R=5, 1.5T MAGNETOM Aera: Siemens Healthcare, Erlangen, Germany) was performed in n=11 (age=66±7 [53-80]) stroke patients with proven aortic atherosclerotic plaques and n=16 age-matched (age=67±7 [54-78]) controls. A time-averaged 3D phase contrast MR angiogram (PC-MRA) was calculated from 4D flow MRI and the aortic volume was manually segmented to mask velocity data. Methods were developed for the automatic quantification of global aortic PWV by the techniques of time-to-foot (TTF)2,3 and cross-correlation (Xcor)2-4 (Figure 1). Planes were placed along an aortic 3D centerline every 4 mm. Flow waveforms were determined based on 4D flow MRI velocity data and linearly interpolated to 1 ms intervals. The time-delay for each waveform was estimated by TTF (i.e. applies linear fit to upstroke and reports x-intercept) and Xcor (i.e. each downstream waveform is compared to the first by applying a time-shift until maximum cross-correlation is reached). Utilizing time-delay and distance along the centerline for all plane locations, global aortic PWV was calculated using linear regression (i.e. PWV=1/slope) and root mean square error (RMSE) recorded as a measure of fit. To simulate the impact of TR on PWV estimation, 4D flow velocity data was linearly downsampled to TR=30, 40, 50, 60 and 70 ms and PWV was quantified.Results
PWV results for high-TR and temporally downsampled data are shown for an example patient (Figure 2). Results for all subjects are plotted, along with RMSE (Figure 3). RMSE was significantly worse for TTF compared to Xcor for all TRs (paired Wilcoxon sign rank test, p<0.001). No significant differences in PWV were found between patients and controls. Significant outliers (i.e. PWV<0 or >20 m/s) occurred in patients and controls using TTF at TR≥50 ms and using Xcor at TR=70 ms. Bland-Altman analysis results comparing PWV methods at different TRs are shown (Figure 4, Table 1). Using TTF compared to Xcor showed an acceptable bias <1 m/s (i.e. 10% of PWV=10 m/s) for TR=20 to 40 m/s but limits of agreement exceeded ±1 m/s for all tested TRs. When compared to Xcor results at high-TR, PWV estimations by Xcor showed an acceptable bias for TR=30 to 60 ms but limits of agreement exceeded ±1 m/s for TR=50 to 70 ms.Conclusions
For patients with aortic atherosclerosis and age-matched controls, PWV measurement by high-TR 4D flow MRI is feasible and improves variability in results compared to simulated data with inferior resolution. At high-TR, the TTF algorithm does not systematically over- or underestimate PWV compared to the Xcor algorithm but there is sizable variation between methods. The TTF algorithm shows variability beyond 10% when employed at inferior TRs. The Xcor algorithm, which utilizes the entire flow waveform while TTF only uses the upstroke, remains stable at TR=30 ms and 40 ms. A limitation of the present study is the lack of a reference standard for estimating PWV in vivo; as such, techniques with the least RMSE were considered optimal. The Xcor method is potentially optimal, particularly at typical 4D flow MRI TRs of 40 ms, and future work will focus on the development of related algorithms.Acknowledgements
Grant support by NIH, NHLBI T32 HL134633 and R21 HL132357References
- Pereira T, Correia C, Cardoso J. Novel Methods for Pulse Wave Velocity Measurement. J Med Biol Eng 2015;35(5):555-565.
- Markl M, Wallis W, Brendecke S, Simon J, Frydrychowicz A, Harloff A. Estimation of global aortic pulse wave velocity by flow-sensitive 4D MRI. Magn Reson Med 2010;63(6):1575-82.
- Wentland AL, Wieben O, Francois CJ, Boncyk C, Munoz Del Rio A, Johnson KM, Grist TM, Frydrychowicz A. Aortic pulse wave velocity measurements with undersampled 4D flow-sensitive MRI: comparison with 2D and algorithm determination. J Magn Reson Imaging 2013;37(4):853-9.
- Fielden SW, Fornwalt BK, Jerosch-Herold M, Eisner RL, Stillman AE, Oshinski JN. A new method for the determination of aortic pulse wave velocity using cross-correlation on 2D PCMR velocity data. J Magn Reson Imaging 2008;27(6):1382-7.
Figures
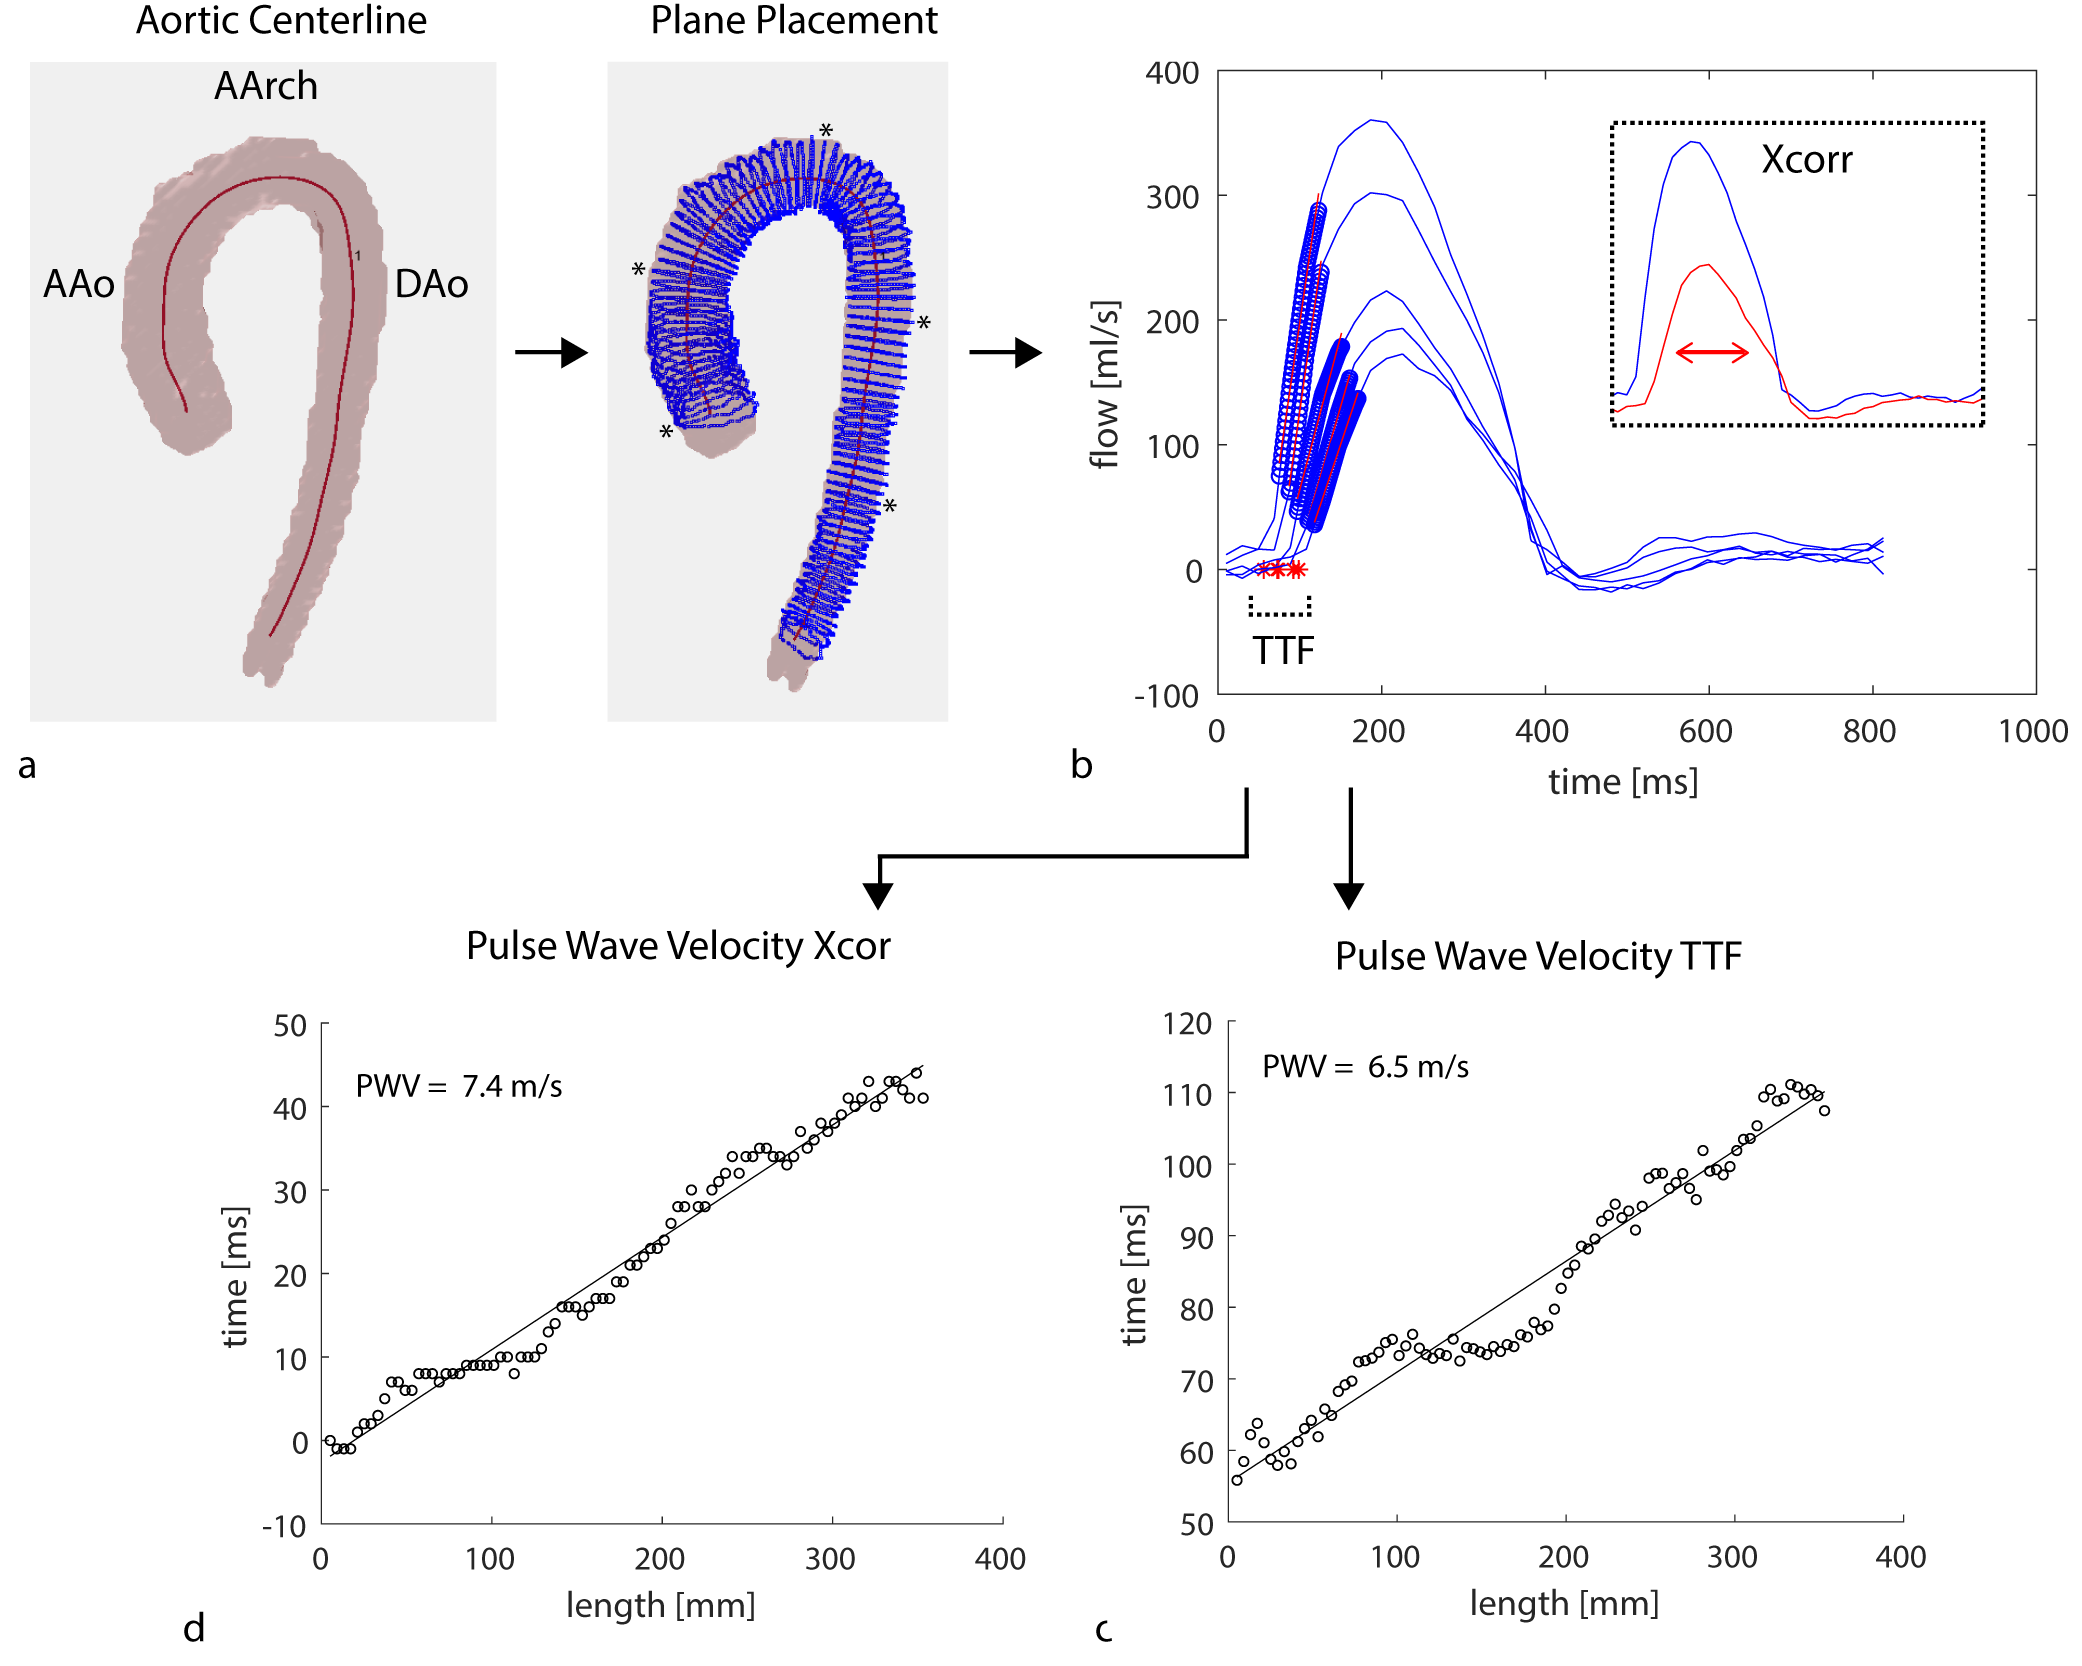
Figure 1: Automatic estimation
of PWV. A-B) Planes were placed along the aortic centerline and flow waveforms
generated. Only waveforms at a few locations (*) are shown to simplify the figure.
TTF was determined as x-intercept (red stars) of line of fit (red lines) for
upstroke of each flow waveform. Data points in upstroke are identified by blue
circles. C) TTF vs. distance along the centerline was plotted for all planes and
PWV was determined as 1/slope of the line of fit. D) Time delays between each
plane and first plane were obtained using Xcor and plotted similarly.
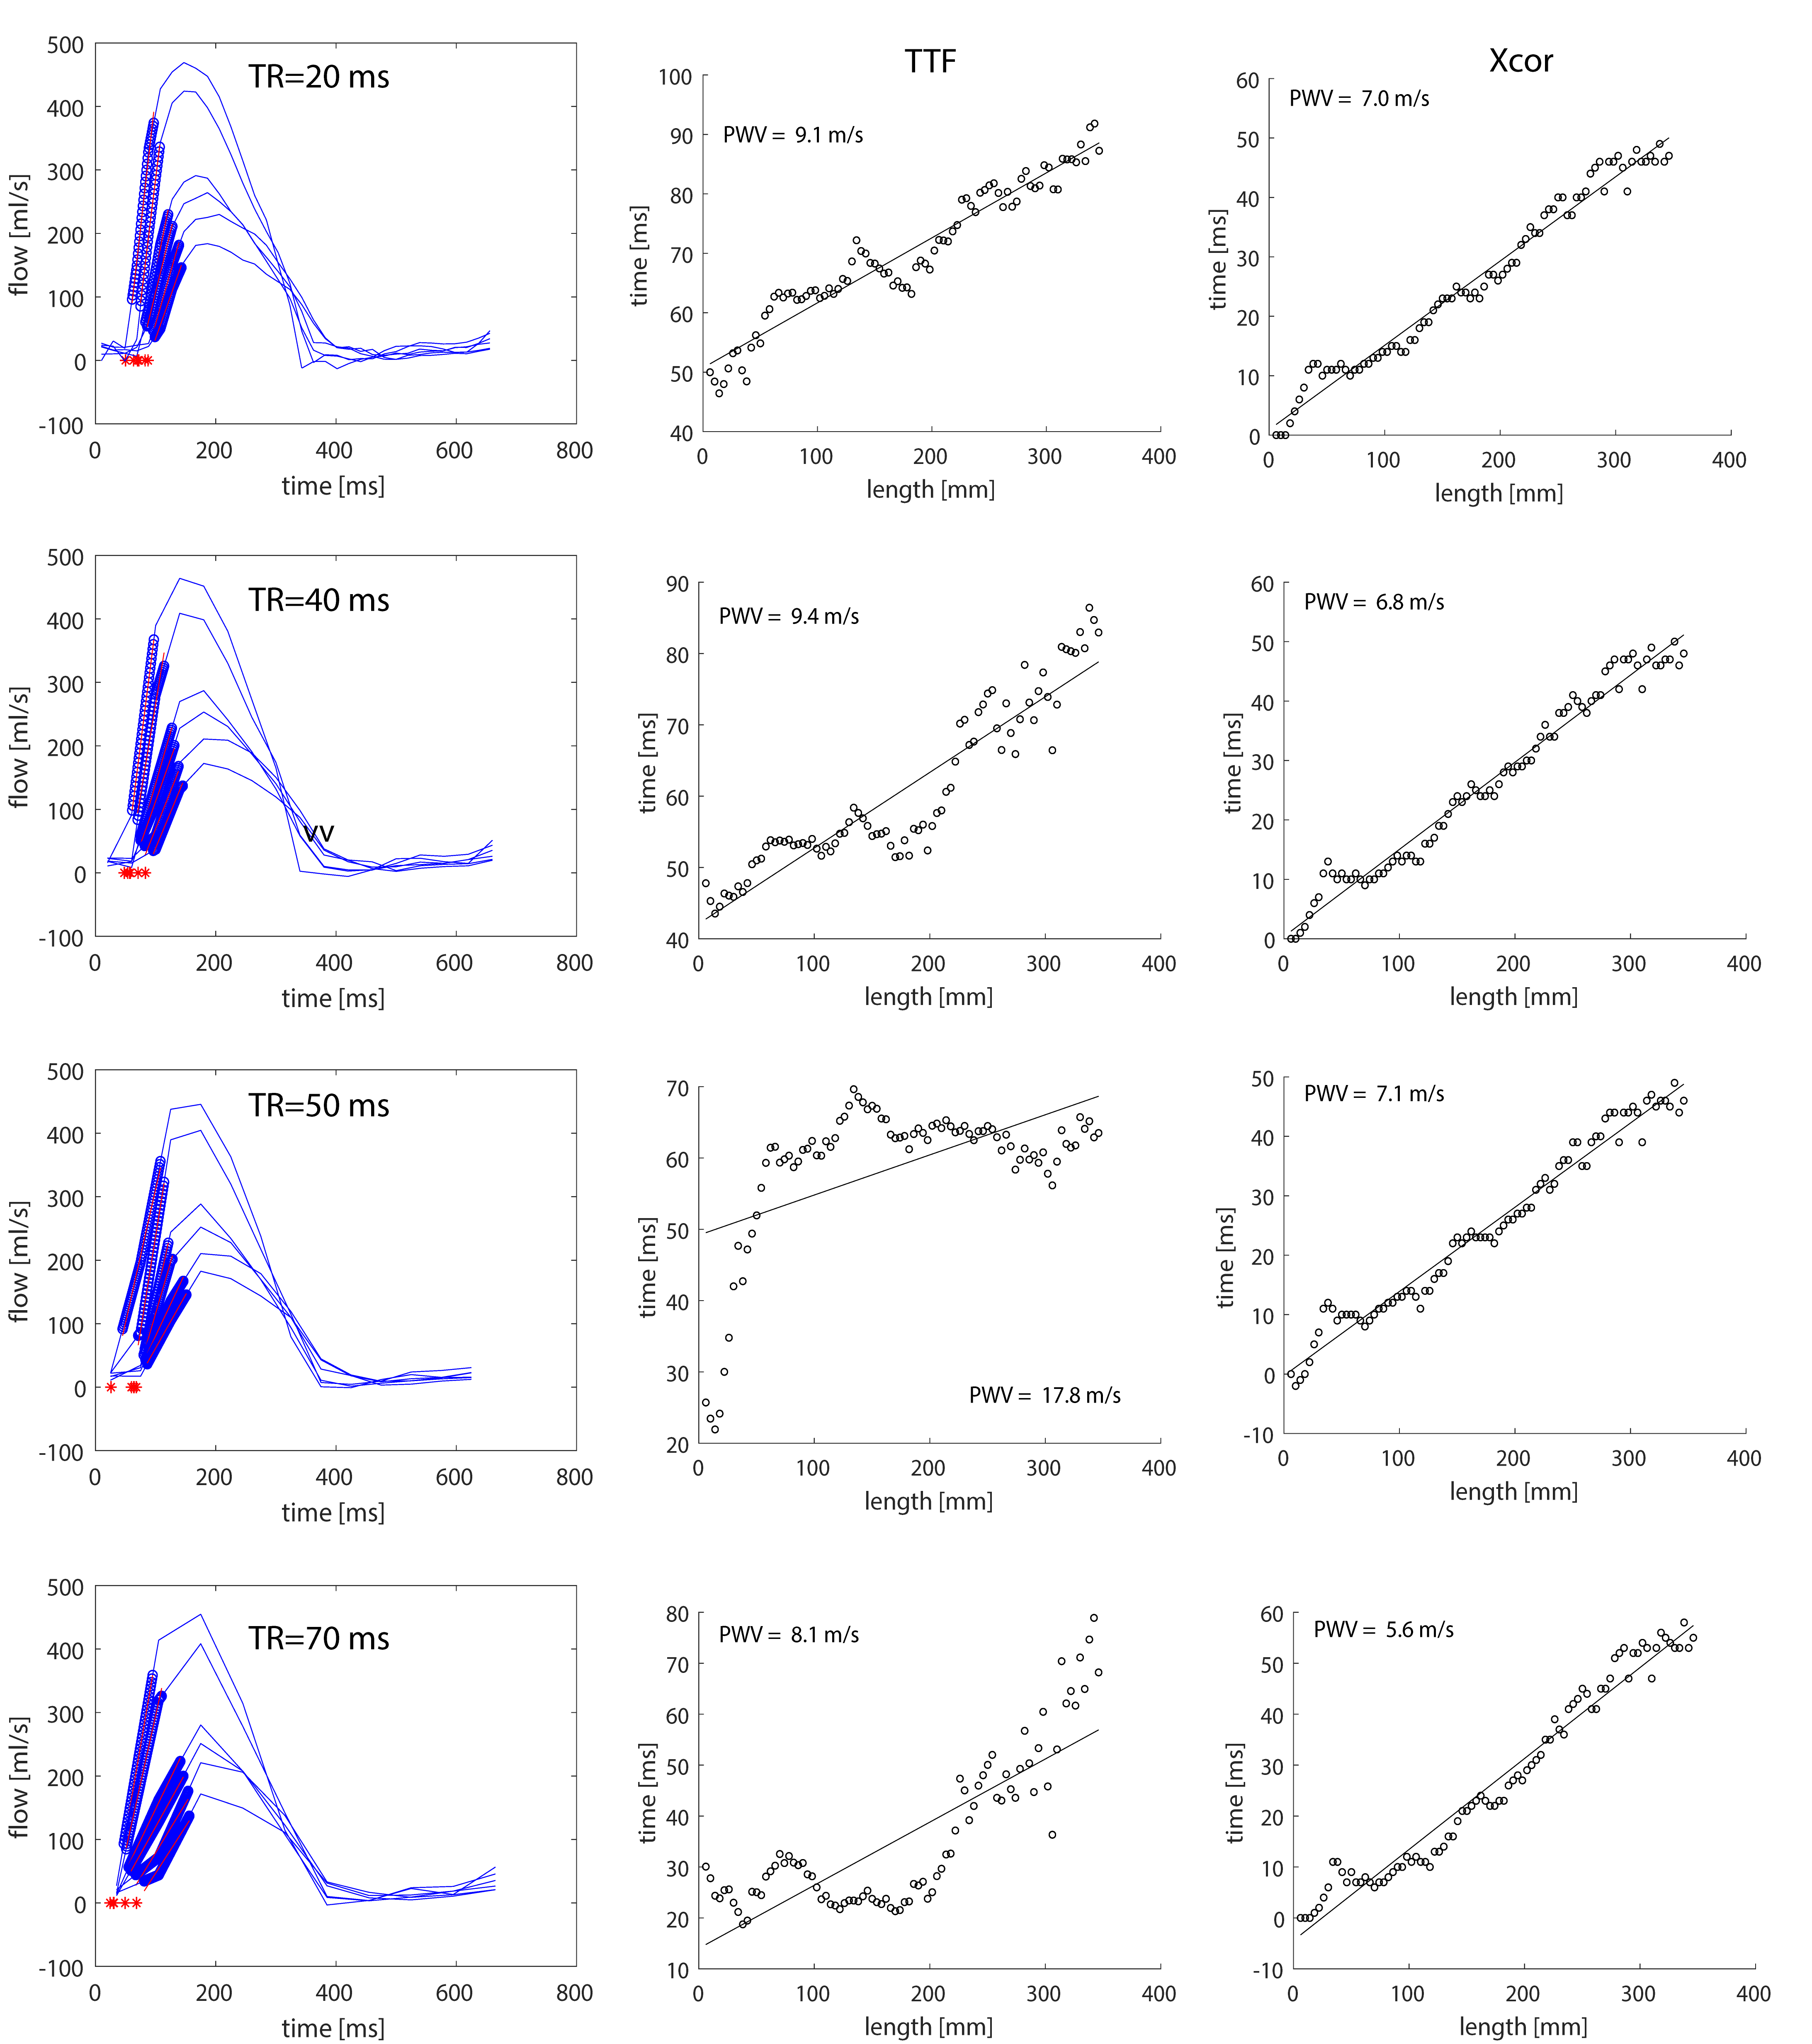
Figure
2: PWV results from the acquired high-TR and temporally downsampled 4D flow MRI
data in a 70 year old patient. Results from the acquired high-TR 4D flow MRI are
shown for flow waveforms (top left), TTF (top middle) and Xcor (top right).
Moving down the rows, the PWV results are shown as 4D flow MRI was temporally
downsampled to 40, 50 and 70 ms. An increase in variation for the TTF results
can be appreciated at TR=50 ms and 70 ms. Xcor results remained stable at TR ≤ 50
ms but showed a low value at TR=70 ms.
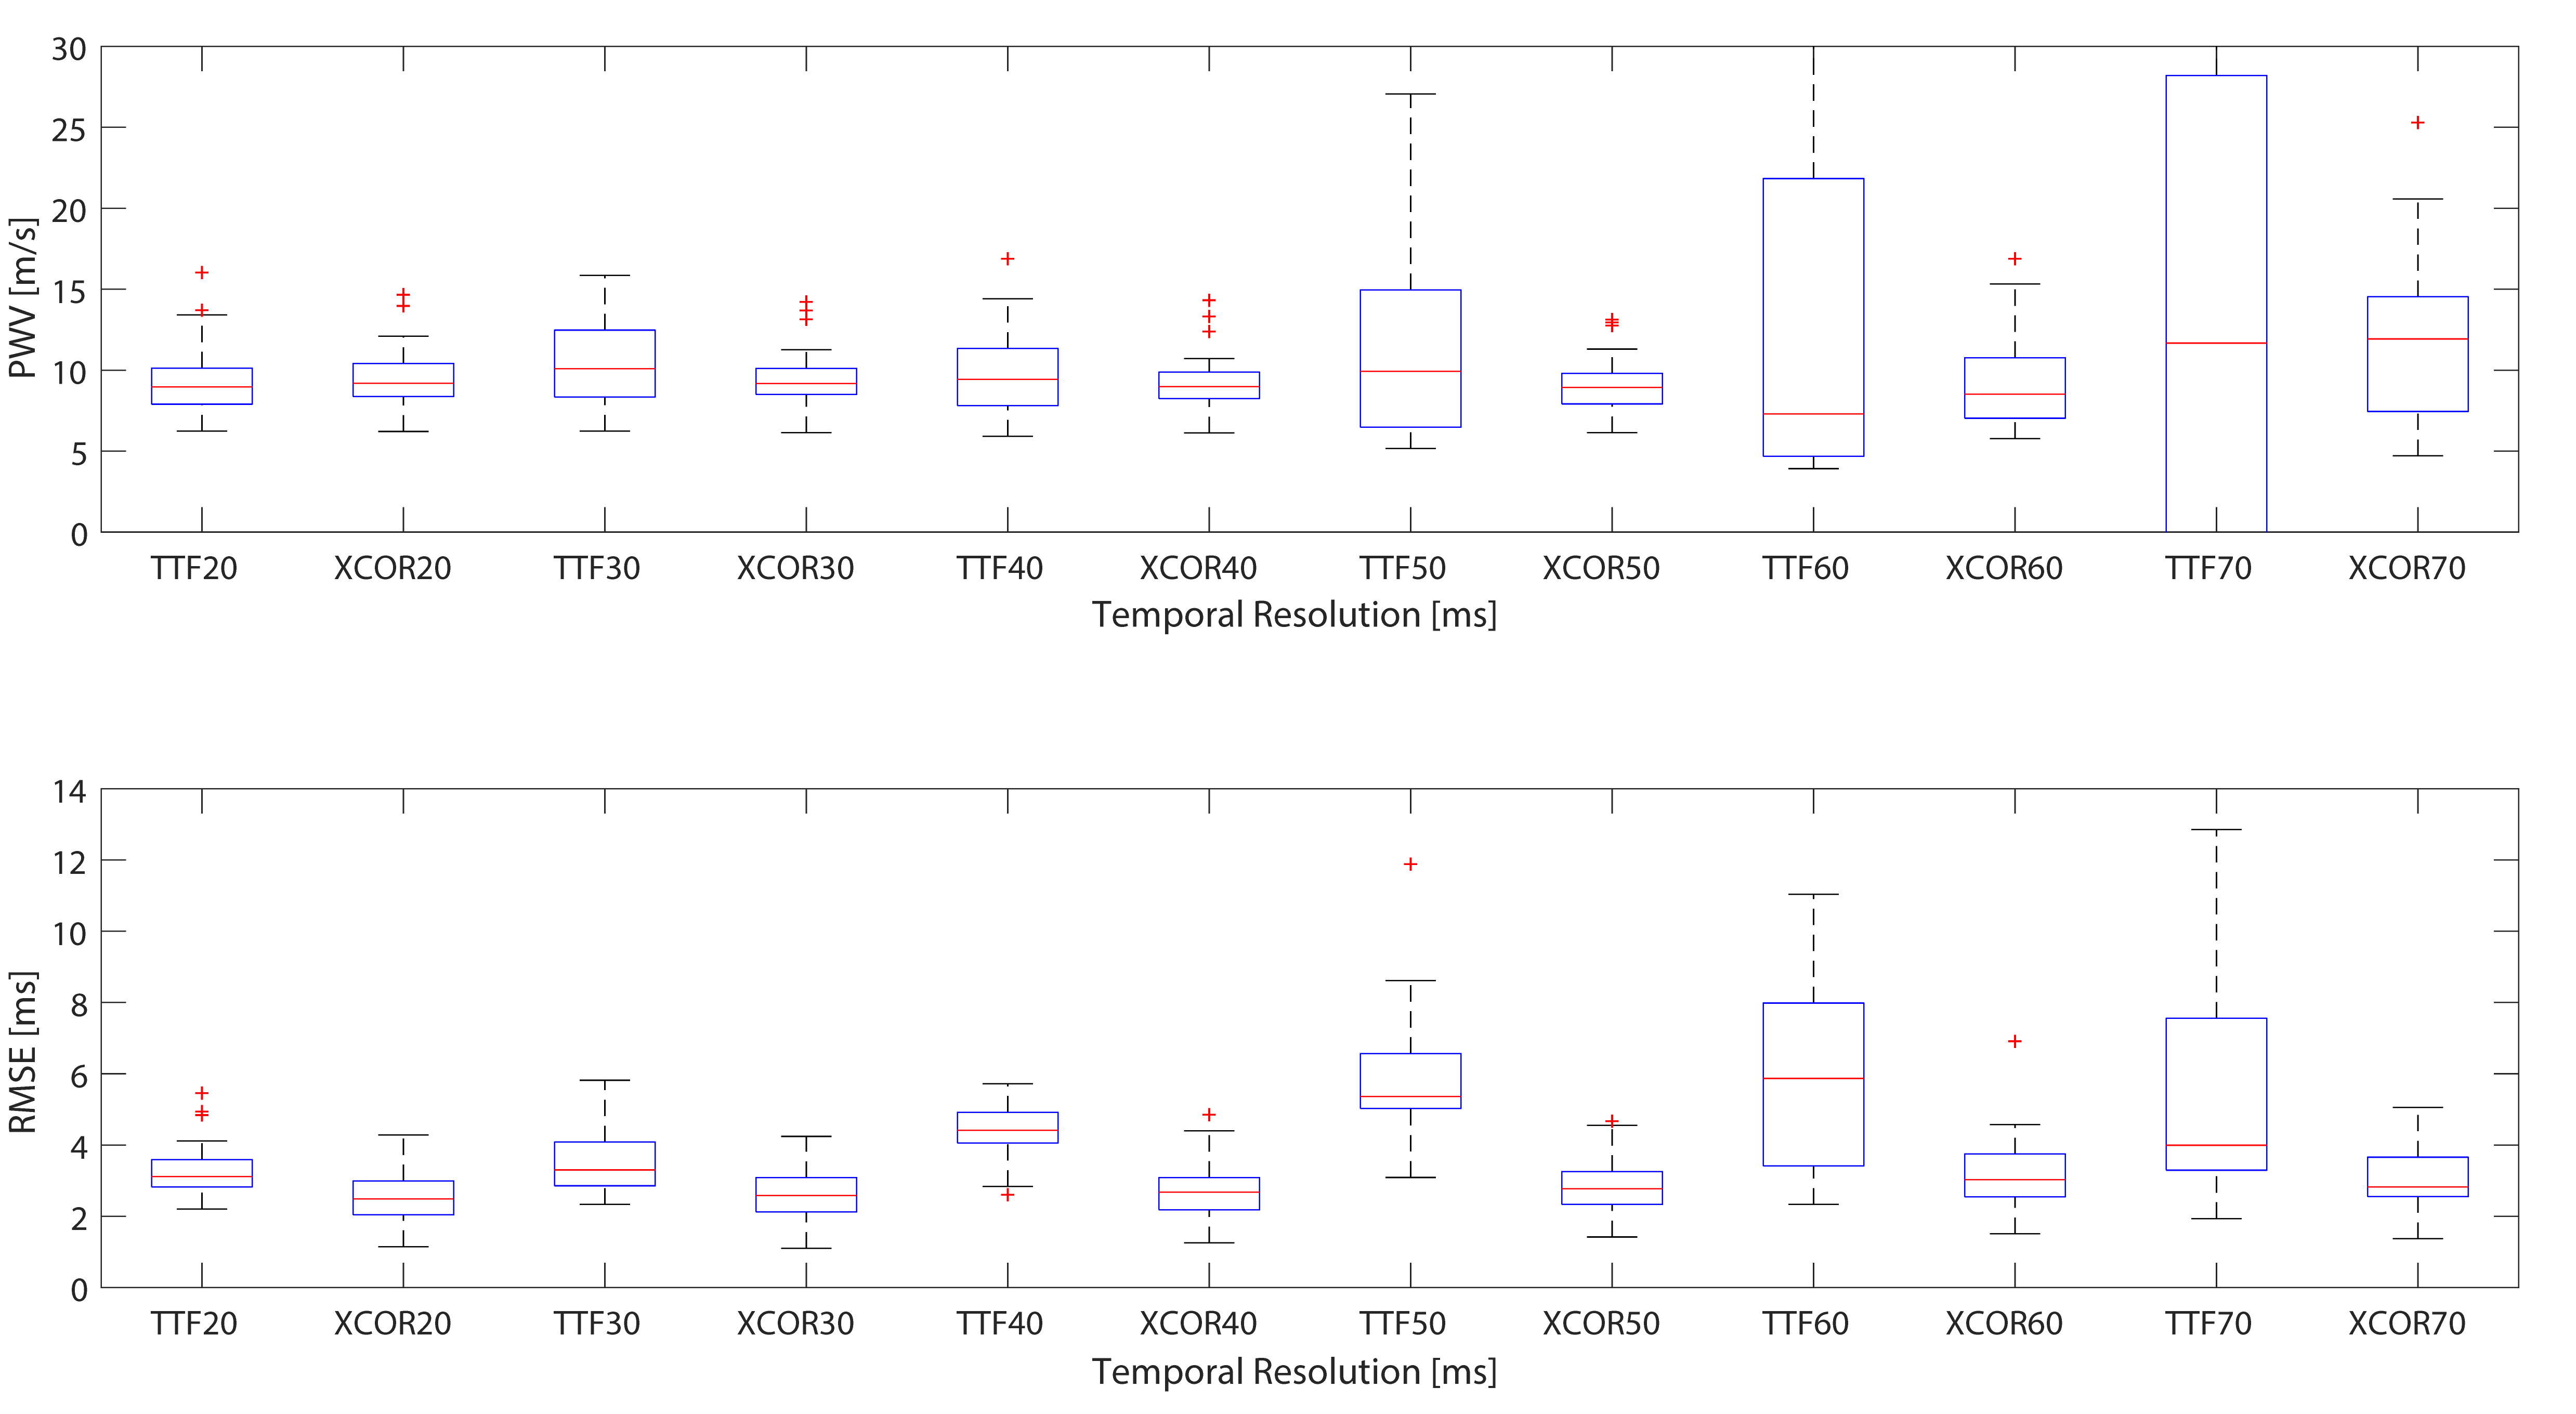
Figure 3: Box plots of PWV measurements and RMSE calculated
using TTF and Xcor methods at different TRs (20 to 70 ms). Estimation of PWV by
TTF at TR=60 ms and 70 ms ranged [-100 m/s to 614 m/s] and [-13662 m/s to 231
m/s] respectively, and are beyond the y-axis scale.
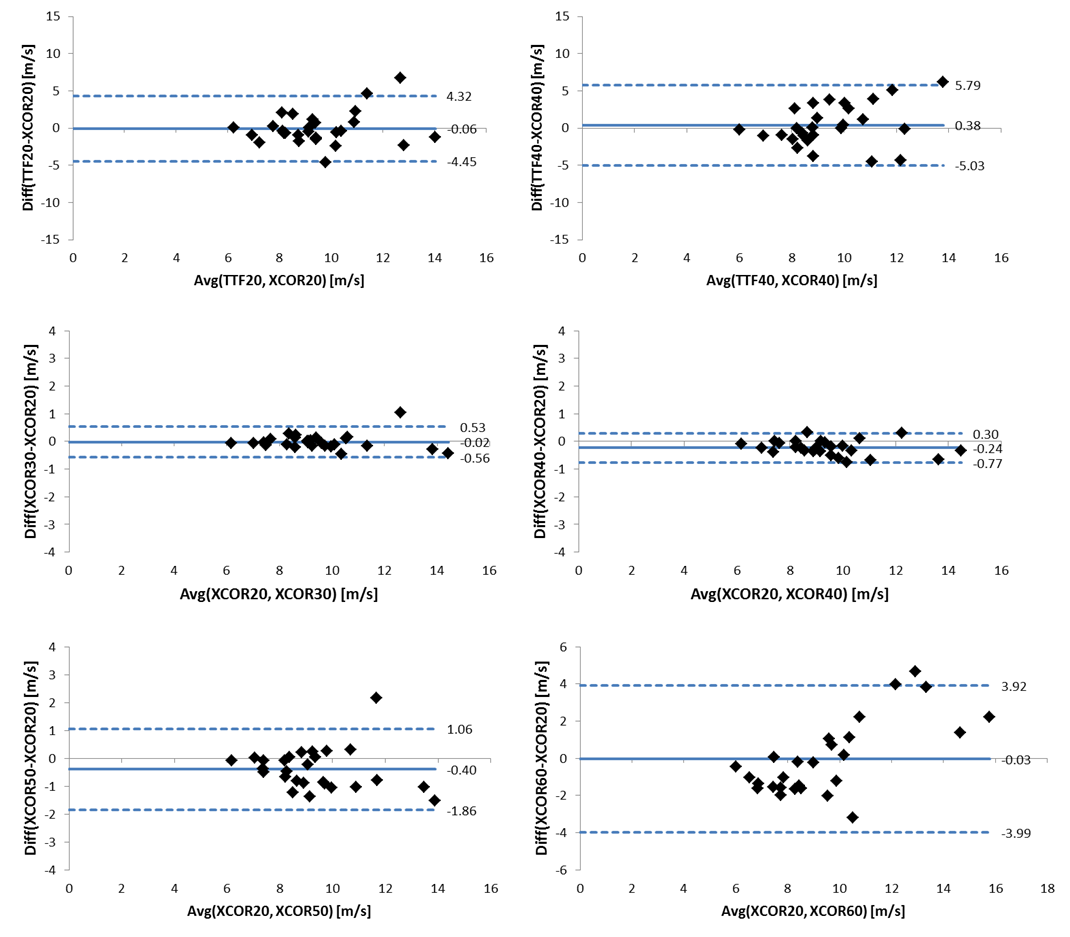
Figure 4: Bland-Altman plots comparing the PWV techniques of
TTF and Xcor at different TRs. Top: Xcor and TTF are compared at TR=20ms and 40
ms. Middle and Bottom: using Xcor to assess PWV with data at the acquired high-TR=20
ms is compared to using Xcor with downsampled data.
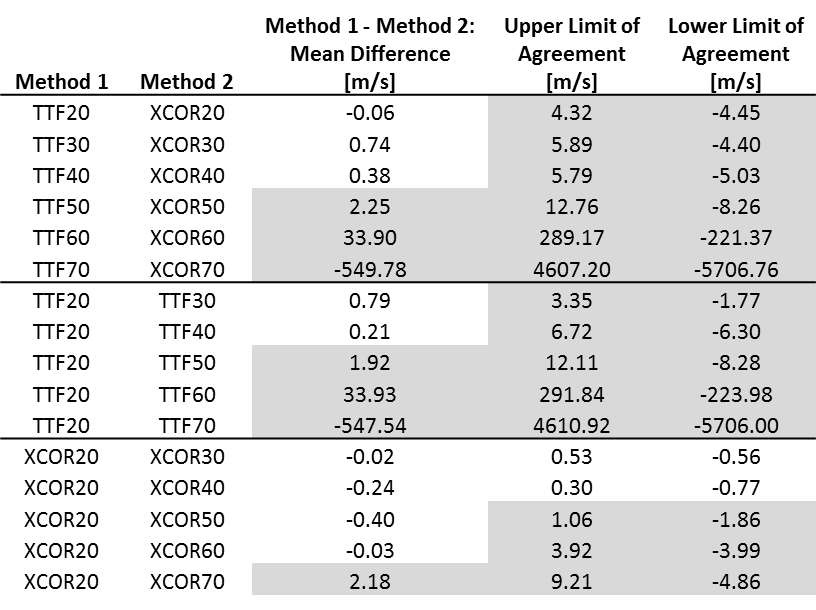
Table 1: Bland-Altman results for comparing the PWV
techniques of TTF and Xcor at different TRs. Top: TTF and Xcor methods were
compared for the acquired high-TR (i.e. 20 ms) and for each downsampled TR
(i.e. 30 to 70 ms). Middle: PWV by TTF at the acquired high-TR was compared to
PWV by TTF at all downsampled TRs. Bottom: PWV by Xcor at the acquired high-TR
was compared to PWV by Xcor at all downsampled TRs. Numbers shaded gray exceed
the acceptable range (i.e. ±1 m/s).