2927
4D flow MRI Investigation of link between Aortic Stiffness and Embolic Pathway of Aortic Flow Reversal in Patients with Cryptogenic StrokeKelly Jarvis1, Alireza Vali1, Shyam Prabhakaran2, Jeremy D. Collins1, and Michael Markl1
1Radiology, Northwestern University, Chicago, IL, United States, 2Neurology, Northwestern University, Chicago, IL, United States
Synopsis
Reverse aortic flow causing plaque embolization from the descending aorta (DAo) has been identified as a new source of stroke but the underlying cause of flow reversal is unclear. There is evidence that aortic stiffness can cause flow reversal but no study has investigated this relationship in detail. This study used high-temporal resolution 4D flow MRI to evaluate aortic stiffness and regional aortic flow reversal in patients with cryptogenic stroke. Elevated PWV was associated with reverse flow in areas of the aortic arch and DAo providing evidence for aortic stiffness and flow reversal as a potential embolic mechanism.
Introduction
Even after extensive evaluation, the cause of stroke remains undetermined (i.e. cryptogenic) in 20-30% of patients leading to a high risk for recurrent stroke1,2. Atherosclerotic plaques in the ascending aorta (AAo) have been associated with embolic stroke. Plaques in the descending aorta (DAo) have not been previously considered because these require reverse (upward) flow to reach the supra-aortic branches leading directly to the brain. Recent evidence suggests stiffening of the aortic vessel wall, which occurs with age and atherosclerosis, leads to aortic flow reversal3. However, no prior studies provide a comprehensive assessment of both aortic stiffness (i.e. measured by pulse wave velocity, PWV) and reverse flow. 4D flow MRI (3D time-resolved 3-directional velocity encoding) offers assessment of both aortic PWV4,5 and reverse flow6,7 along the entire aorta based on a single scan. Prior 4D flow MRI studies have evaluated these mechanisms separately and were additionally limited by temporal resolution and pathline analysis. This study used optimized k-t accelerated 4D flow MRI with high-temporal resolution coupled with multi-plane PWV assessment and regional (voxel-by-voxel) visualization and quantification of reverse flow. We hypothesized that elevated PWV would be associated with regions of reverse aortic flow.Methods
Non-contrast free-breathing 4D flow MRI (spatial resolution=3-3.5 x 2.3-2.6 x 2.6-3 mm3, temporal resolution=19.6 ms, venc=150 cm/s, k-t GRAPPA acceleration R=5, 1.5T MAGNETOM Aera: Siemens Healthcare, Erlangen, Germany) was performed in 11 cryptogenic stroke patients with DAo plaques and 16 age-matched controls. Cardiac function was assessed using standard cine-MRI. Patients were evaluated for aortic regurgitation by Doppler echo. The 4D flow MRI data analysis workflow is illustrated in Figure 1. A 3D phase contrast MR angiogram (PC-MRA) was generated from 4D flow MRI to depict vessels. Next, the aortic volume was separated from the 3D PC-MRA by manual segmentation and used to mask the 4D velocity data. For global aortic PWV quantification, a 3D aortic centerline was calculated and analysis planes placed every 4 mm (Figure 1a). Flow waveforms were generated for each location and linearly interpolated to 1 ms intervals. Global aortic PWV was estimated using cross-correlation (Xcor)4,5,8 to determine the time-delay between locations along the aorta (Figure 1b-c). For reverse flow analysis, the 4D velocity data was regridded to isotropic 1 mm3 voxels using spline interpolation. Each voxel in the aortic volume was analyzed to determine the direction of forward and reverse flow as defined by the aortic centerline. For every voxel inside the aorta segmentation, reverse and forward flow were summed up over the cardiac cycle and reverse flow fraction, $$$RFF=(Reverse Flow)/(Forward Flow)$$$, was calculated9. The lowest 1% of forward flow data was not included in the RFF calculation to reduce RFF noise, followed by a 3D median 3-by-3-by-3 filter (also applied to forward and reverse flow). To collapse the data into a 2D image, mean intensity projection maps of forward flow, reverse flow, and RFF were generated (Figure 1d-f). Regions of interest (n=6) were identified in the outer curvature (AAo1, aortic arch: AArch1, DAo1) and inner curvature (AAo2, AArch2, DAo2) of the aorta and mean forward flow, reverse flow and RFF were calculated.Results
Subject demographics are shown (Table 1). Mild aortic regurgitation was reported for one patient. Patients had elevated forward flow compared to controls in the ascending aorta (AAo1: p=0.03) (Table 2). Results in 2 example patients and one control are shown (Figure 2). For patients, age showed a trend with PWV (R2=0.33, p=0.06) and was significantly correlated with RFF (AAo1: R2=0.65, p=<0.01; AAo2: R2=0.58, p<0.01; AArch1: R2=0.38, p=0.04). For controls, age was significantly associated with PWV (R2=0.66, p<0.001), reverse flow (DAo1: R2=0.28, p=0.03) and RFF (DAo1: R2=0.31, p=0.02; DAo2: R2=0.25, p<0.05). For patients, PWV was significantly correlated with reverse flow (AArch1: R2=0.57, p<0.01; DAo1: R2=0.40, p=0.04) (Figure 3) and RFF (AAo1: R2=0.61, p<0.01; AAo2: R2=0.54, p=0.01; AArch1: R2=0.82, p<0.001; DAo1: R2=0.60, p<0.01) (Figure 4). For controls, PWV was also significantly correlated with reverse flow (DAo1: R2=0.34, p=0.02) and RFF (DAo1: R2=0.27, p=0.04).Conclusions
Associations between PWV and reverse flow in areas of the aortic arch and DAo support our hypothesis linking aortic stiffness and aortic flow reversal as a potential thromboembolic mechanism in cryptogenic stroke. This work suggests that medical de-stiffening therapies (e.g. ACE-inhibitors) in a subset of stroke patients with plaques in the descending thoracic aorta may be able to reduce the rate of recurrent stroke by reducing regional flow reversal. Future work will focus on studying the progression of aortic stiffness over time and associated changes in aortic flow and remodeling of the vessel wall.Acknowledgements
Grant support by NIH, NHLBI T32 HL134633 and R21 HL132357References
- Guercini F, Acciarresi M, Agnelli G, Paciaroni M. Cryptogenic stroke: time to determine etiology. J Thromb Haemost 2008;6(4):549-54.
- Bang OY, Lee PH, Joo SY, Lee JS, Joo IS, Huh K. Frequency and mechanisms of stroke recurrence after cryptogenic stroke. Ann Neurol 2003;54(2):227-34.
- Hashimoto J, Ito S. Aortic stiffness determines diastolic blood flow reversal in the descending thoracic aorta: potential implication for retrograde embolic stroke in hypertension. Hypertension 2013;62(3):542-9.
- Markl M, Wallis W, Brendecke S, Simon J, Frydrychowicz A, Harloff A. Estimation of global aortic pulse wave velocity by flow-sensitive 4D MRI. Magn Reson Med 2010;63(6):1575-82.
- Wentland AL, Wieben O, Francois CJ, Boncyk C, Munoz Del Rio A, Johnson KM, Grist TM, Frydrychowicz A. Aortic pulse wave velocity measurements with undersampled 4D flow-sensitive MRI: comparison with 2D and algorithm determination. J Magn Reson Imaging 2013;37(4):853-9.
- Markl M, Semaan E, Stromberg L, Carr J, Prabhakaran S, Collins J. Importance of variants in cerebrovascular anatomy for potential retrograde embolization in cryptogenic stroke. Eur Radiol 2017.
- Wehrum T, Dragonu I, Strecker C, Schuchardt F, Hennemuth A, Drexl J, Reinhard T, Bohringer D, Vach W, Hennig J, Harloff A. Aortic atheroma as a source of stroke - assessment of embolization risk using 3D CMR in stroke patients and controls. J Cardiovasc Magn Reson 2017;19(1):67.
- Fielden SW, Fornwalt BK, Jerosch-Herold M, Eisner RL, Stillman AE, Oshinski JN. A new method for the determination of aortic pulse wave velocity using cross-correlation on 2D PCMR velocity data. J Magn Reson Imaging 2008;27(6):1382-7.
- Shen X, Schnell S, Barker AJ, Suwa K, Tashakkor L, Jarvis K, Carr JC, Collins JD, Prabhakaran S, Markl M. Voxel-by-voxel 4D flow MRI-based assessment of regional reverse flow in the aorta. J Magn Reson Imaging 2017.
Figures
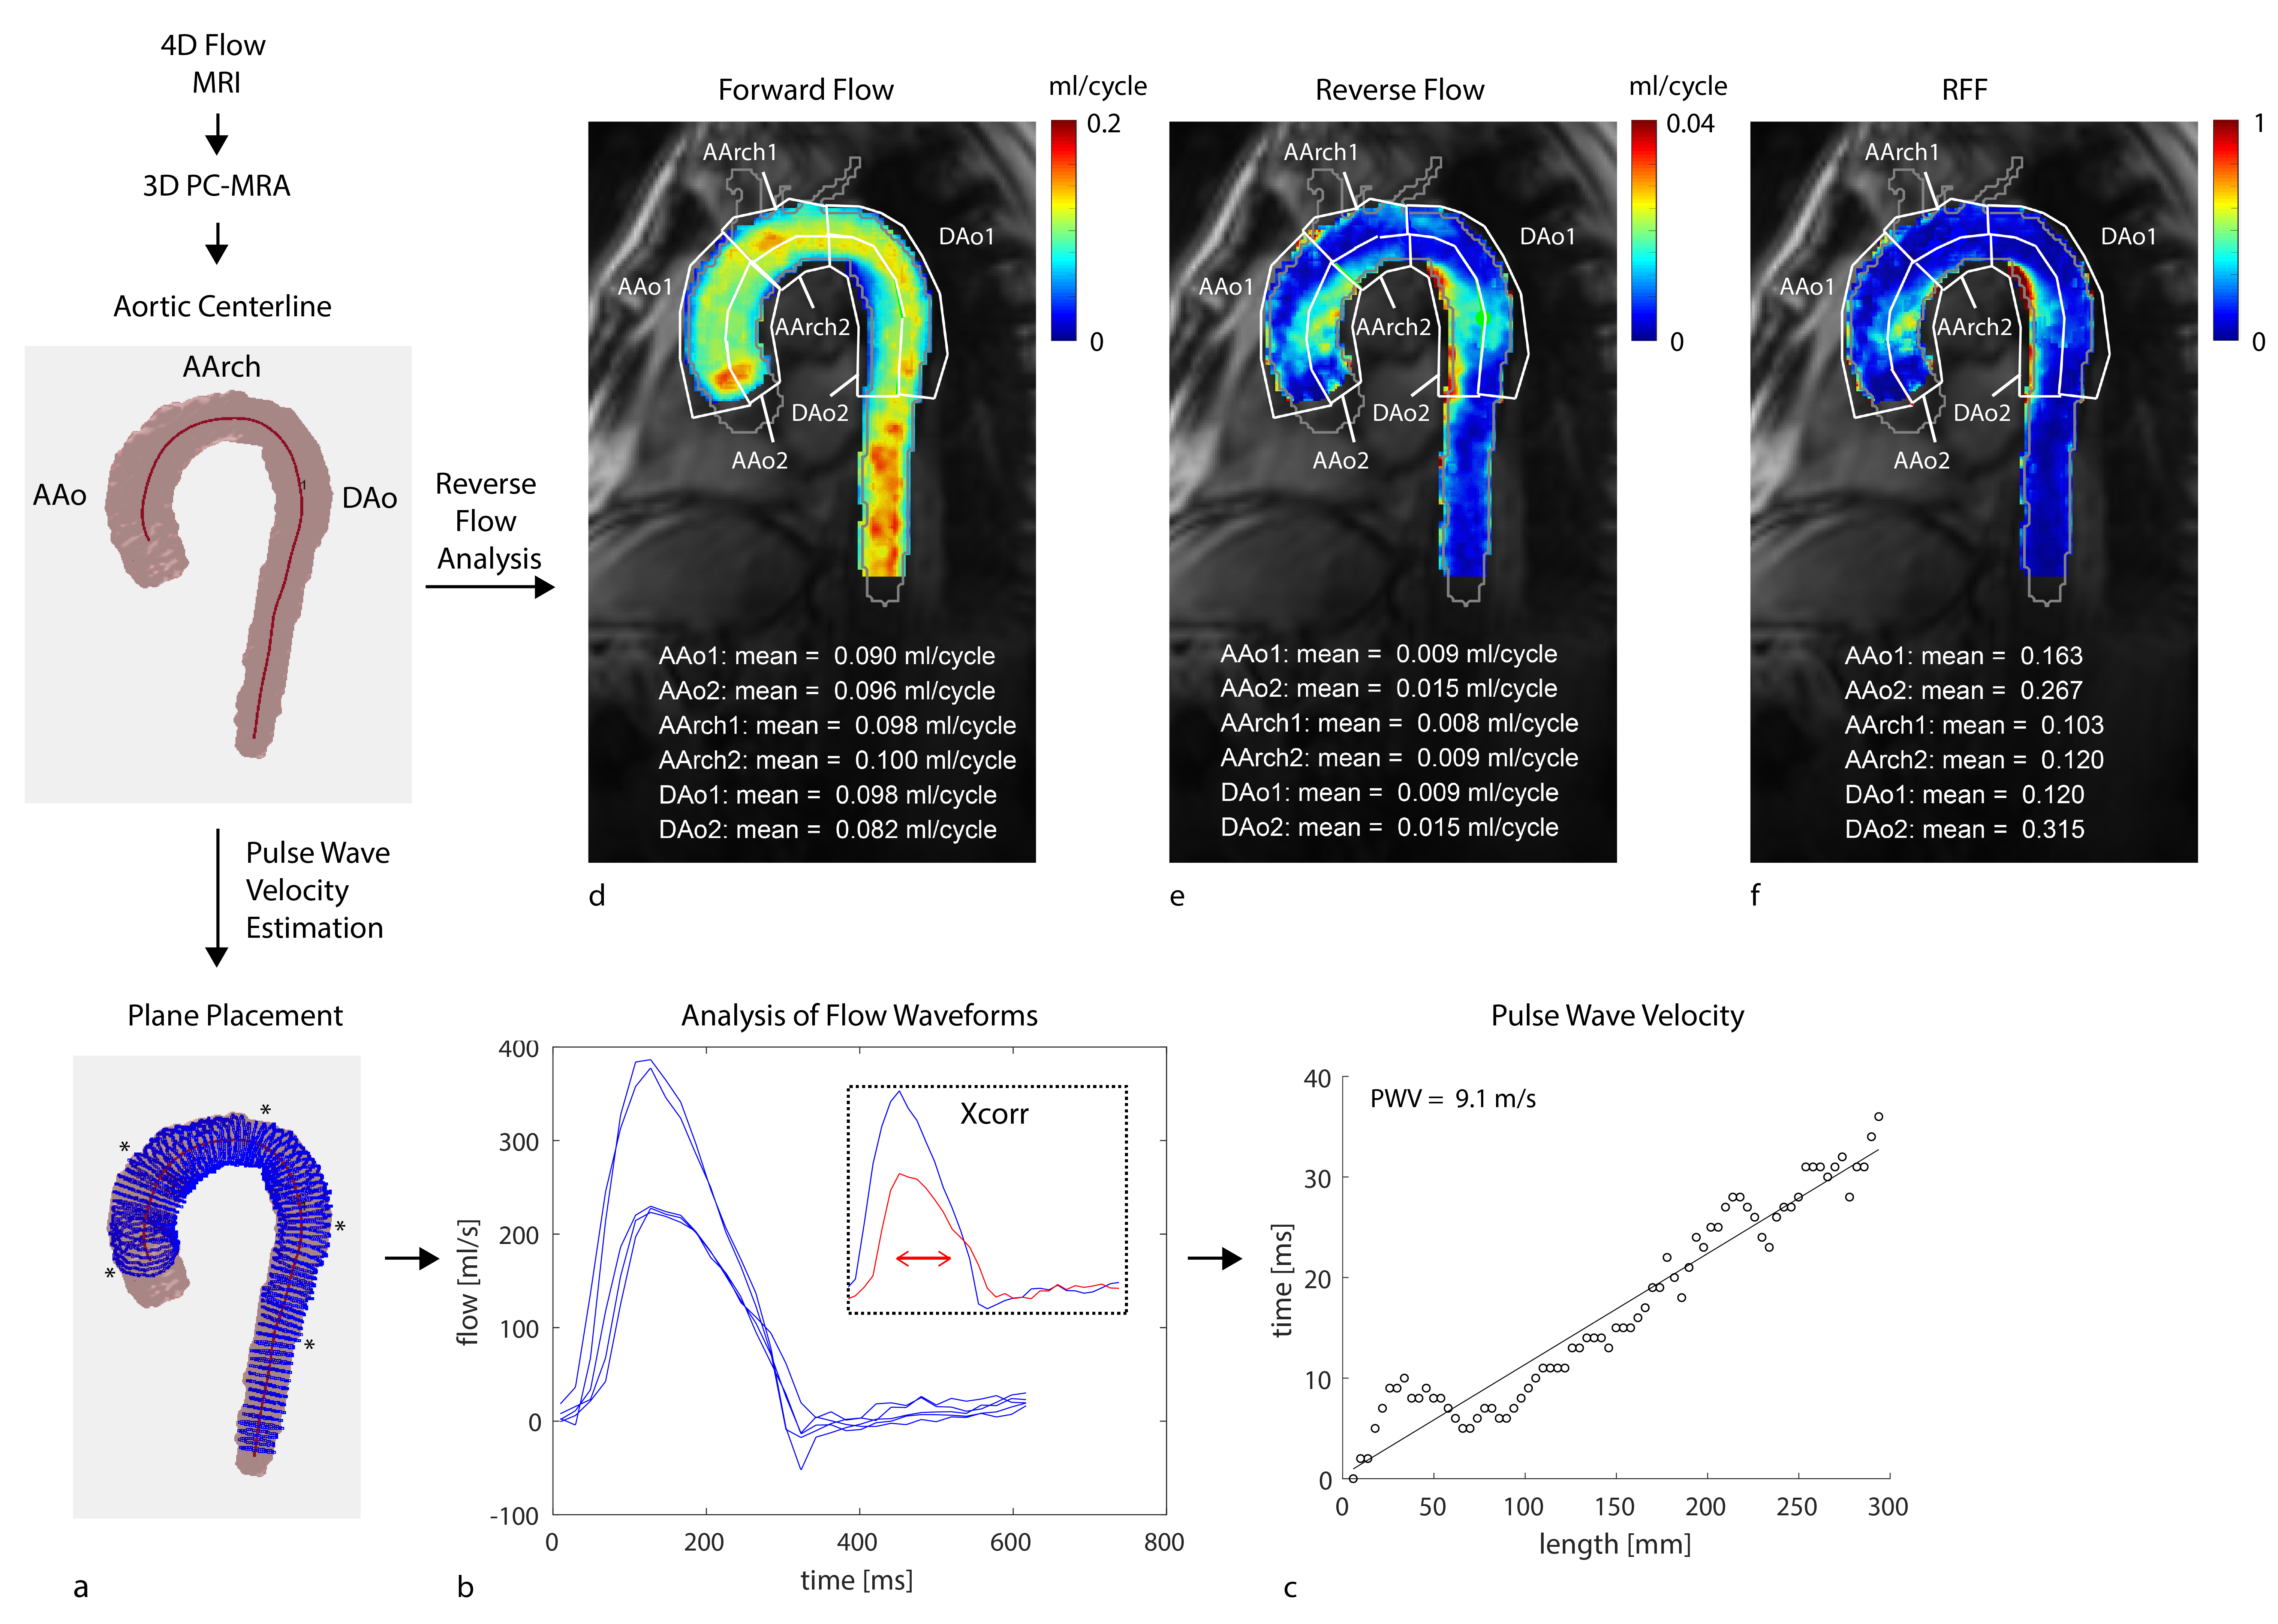
Figure 1: PWV estimation and reverse flow analysis workflow. The
aortic volume was segmented from the 3D PC-MRA (i.e. calcuated from 4D flow MRI)
and 3D centerline generated. a-c) To detemine PWV, planes were placed along the
3D aortic centerline and the time delay compared to the first plane evaluated
using Xcorr (i.e. the downstream plane was shifted in time until maximum
cross-correlation with first plane reached). d-f) Forward flow, reverse flow
and RFF maps were generated and mean values calcuated for ROIs.
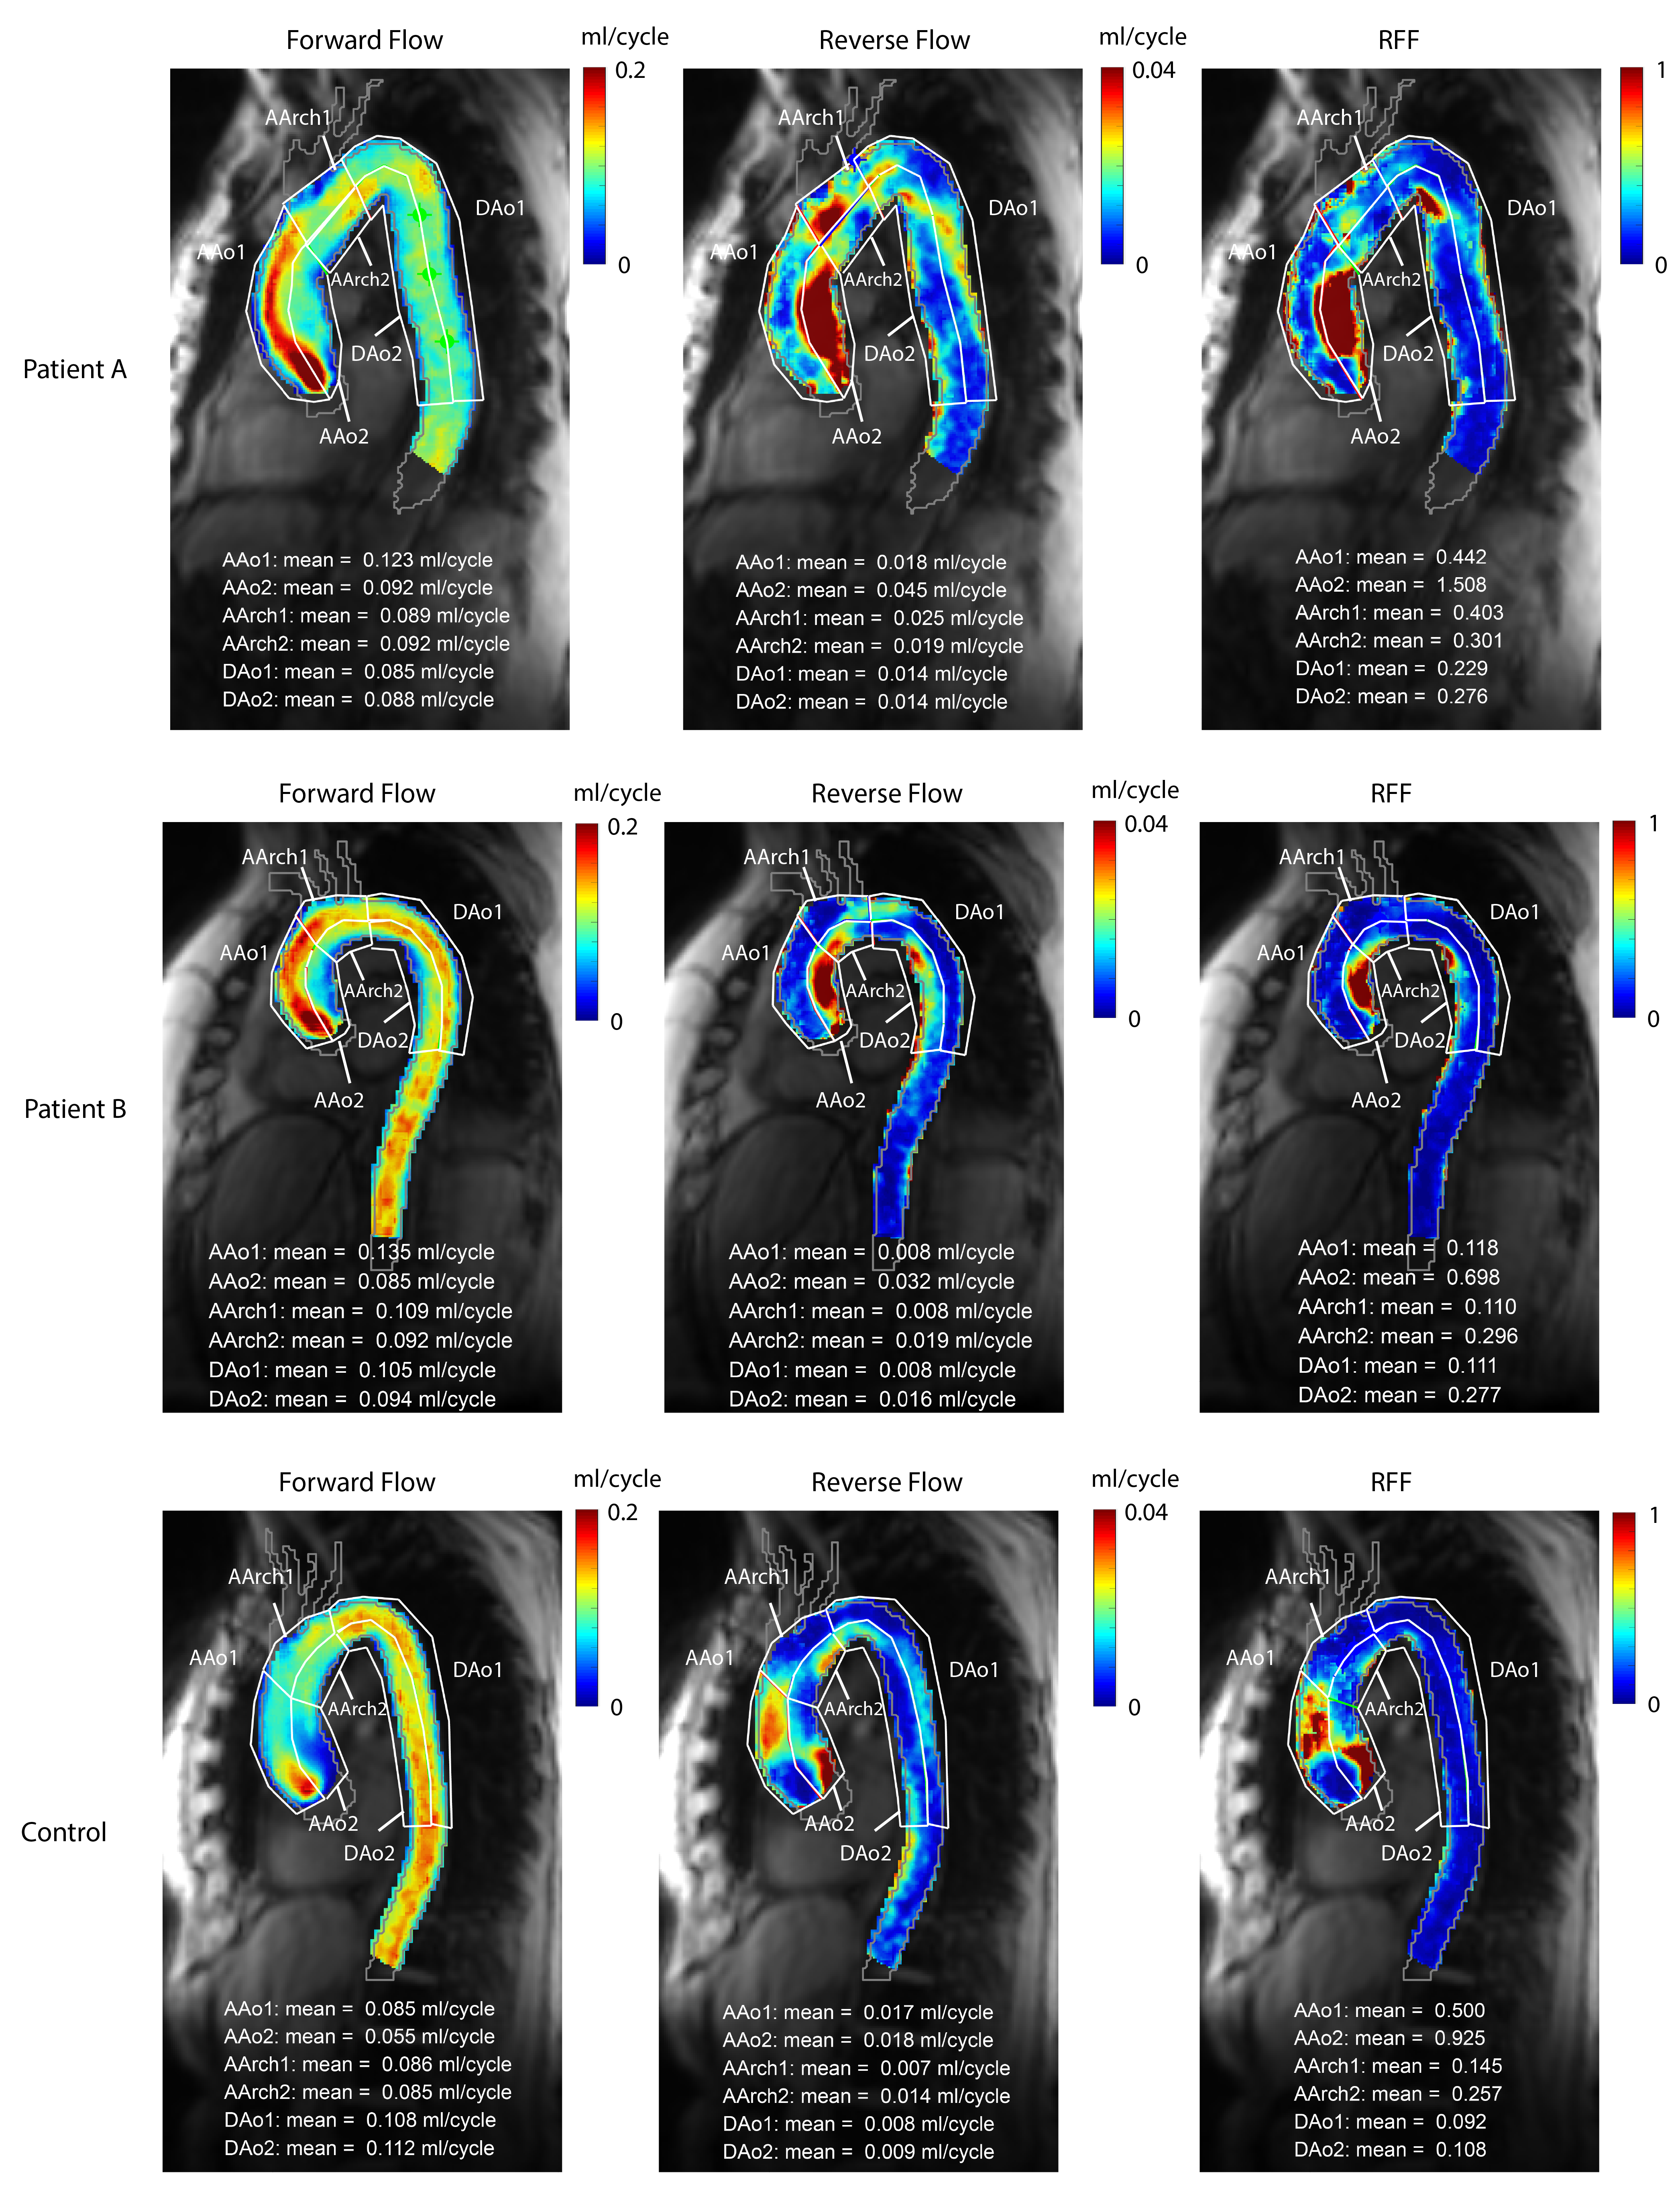
Figure 2: Forward, reverse and RFF flow maps in example
subjects. Top: 80 year old stroke patient with pronounced flow reversal in the inner
curvature of the AAo (i.e. AA2) and outer curvature of the arch (i.e. AArch1)
and DAo (i.e. Dao1). Middle: 60 year old stroke patient with moderate aortic
flow reversal near the aortic branches (i.e. AArch 1, AArch2, DAo1) and inner
curvature of the DAo (i.e. DAo2). Bottom: 67 year old control with moderate
flow reversal in the AAo (i.e. AAo1 and AAo2) and the inner curvature of the
arch.
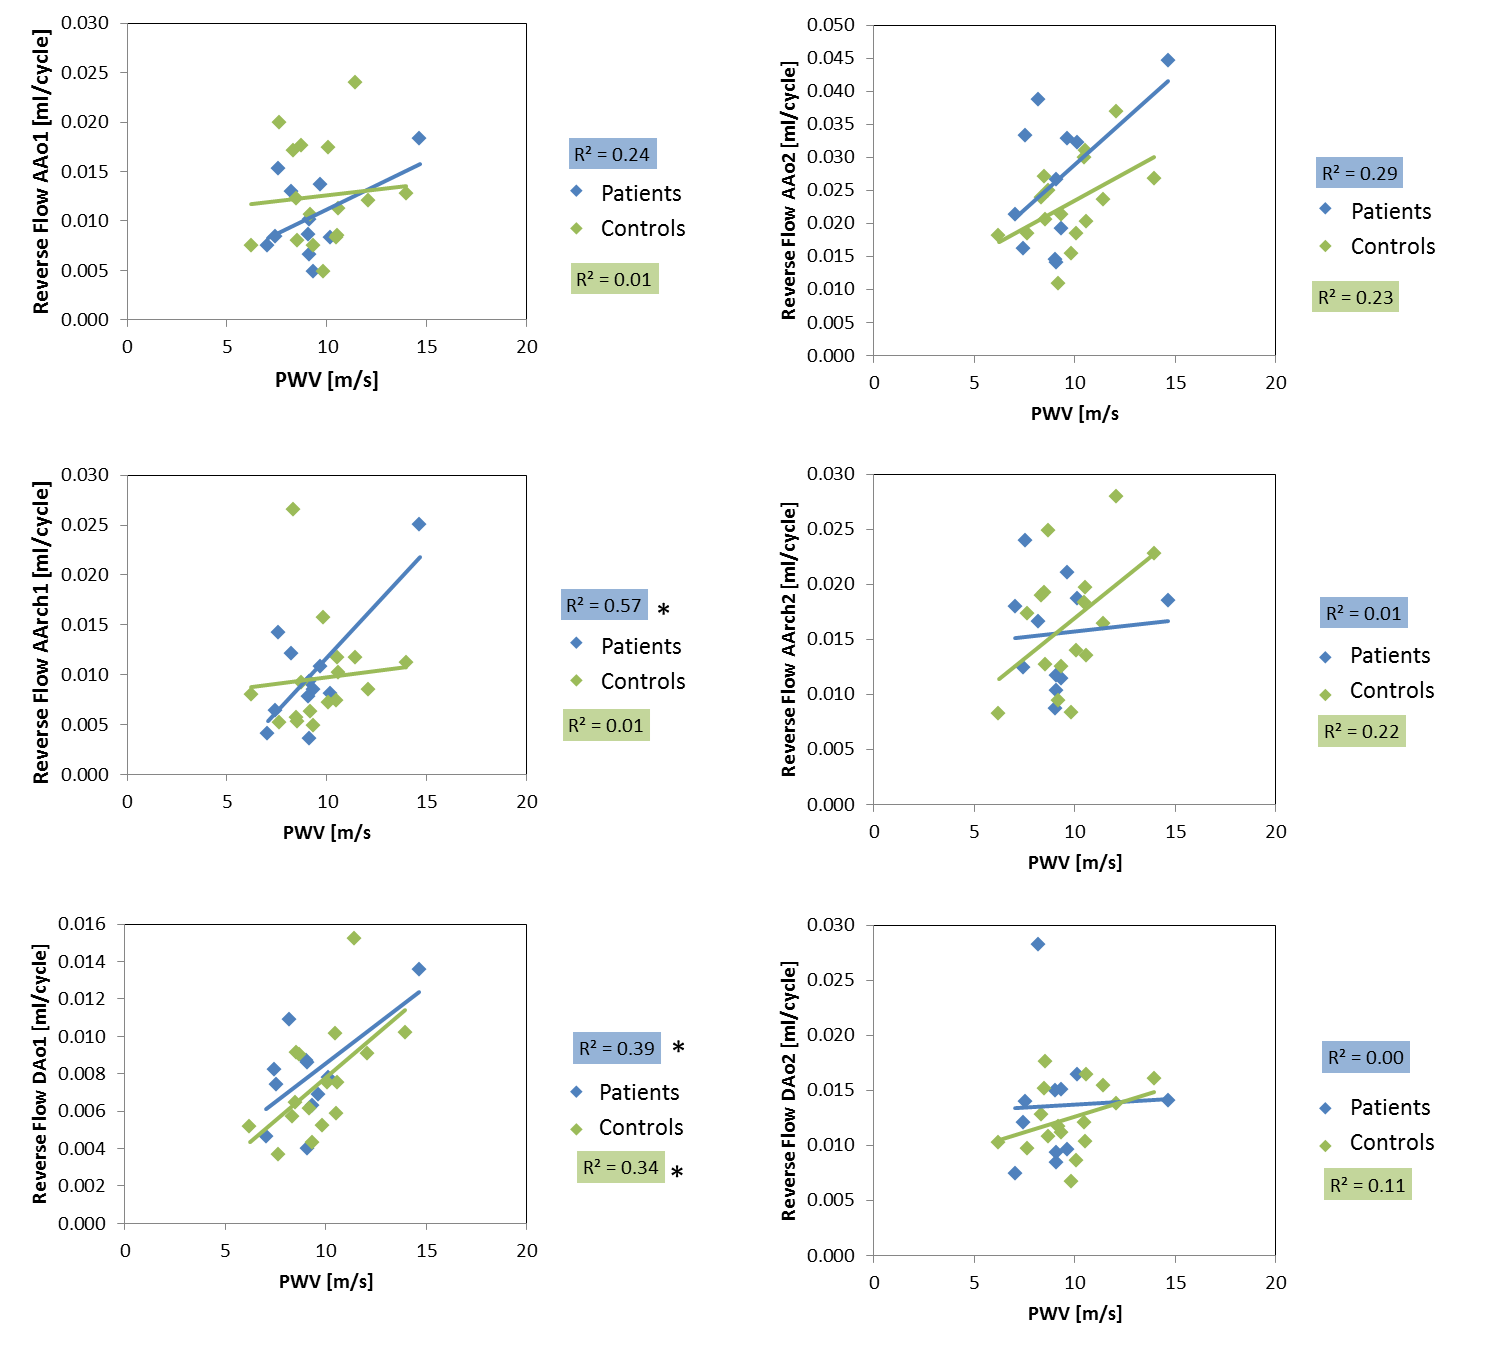
Figure 3: Correlation analysis results for PWV association
with reverse flow (n=11 patients and n=16 age-matched controls). *p<0.05
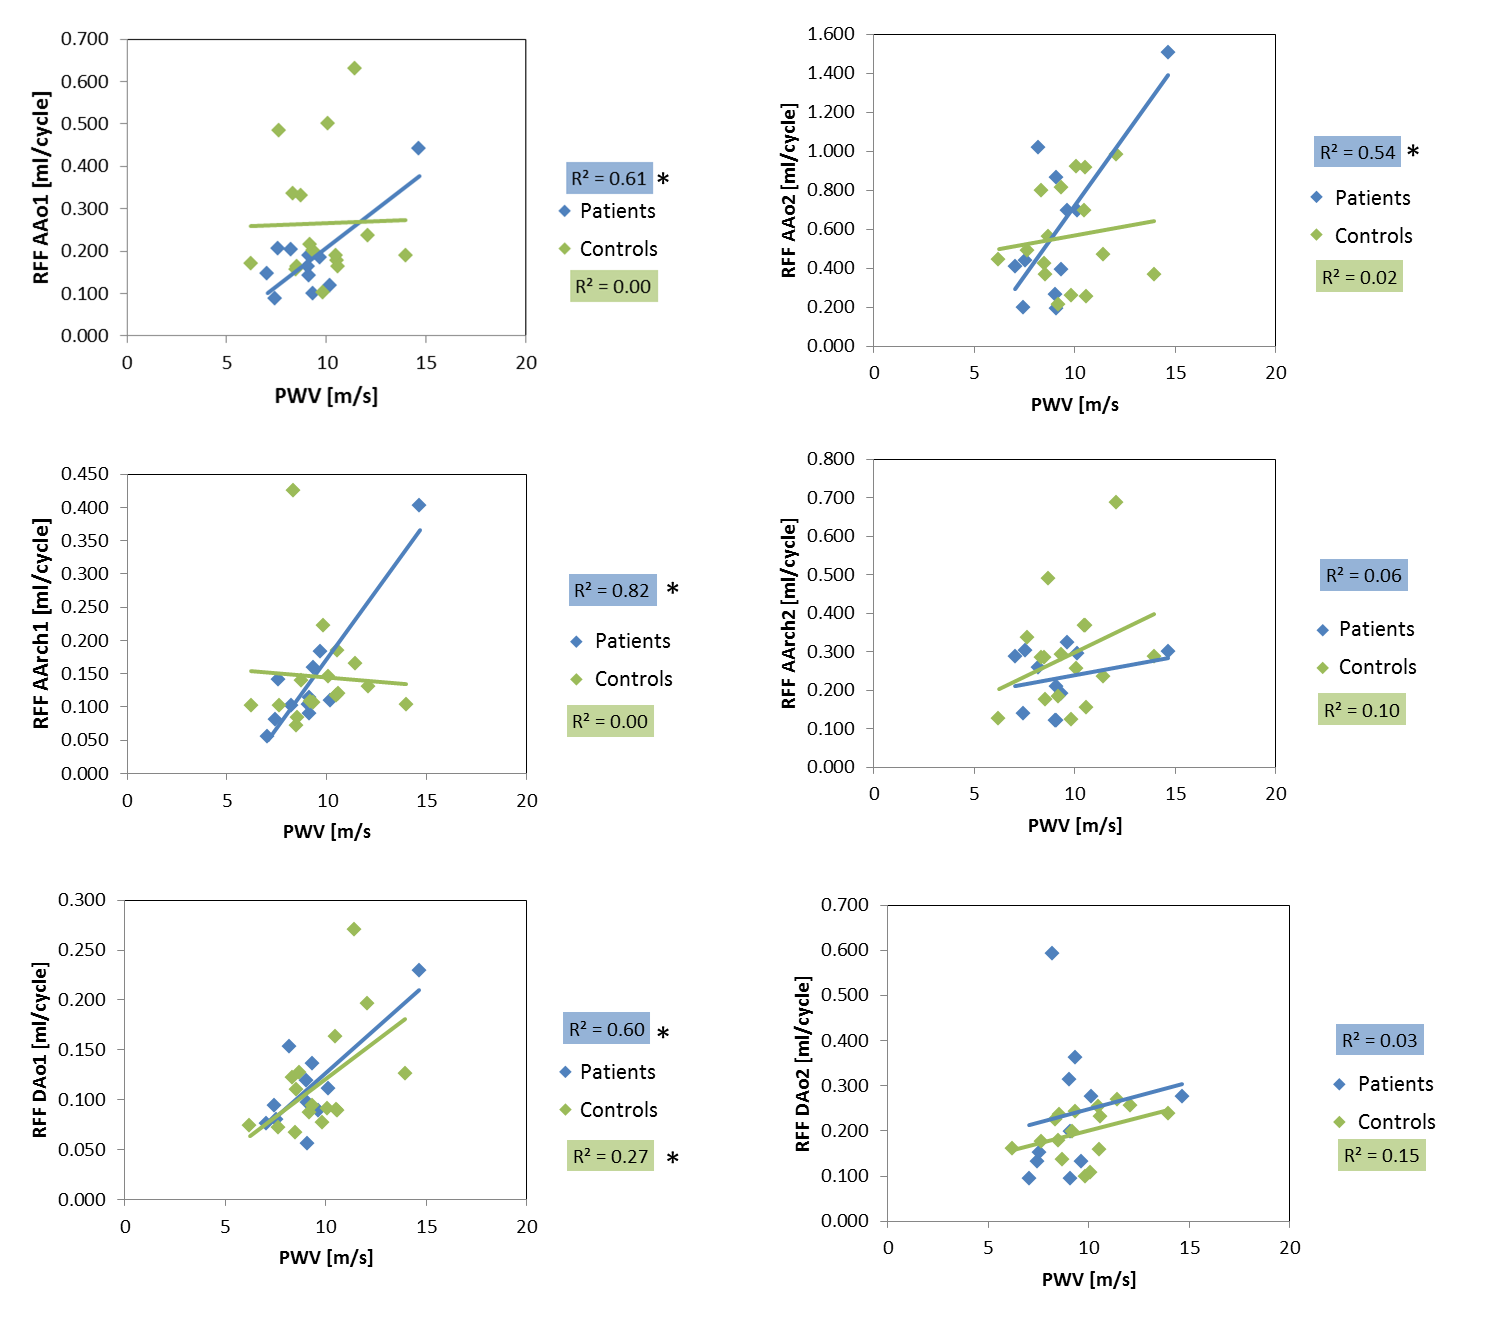
Figure 4: Correlation analysis results for PWV association
with RFF (n=11 patients and n=16 age-matched controls). *p<0.05
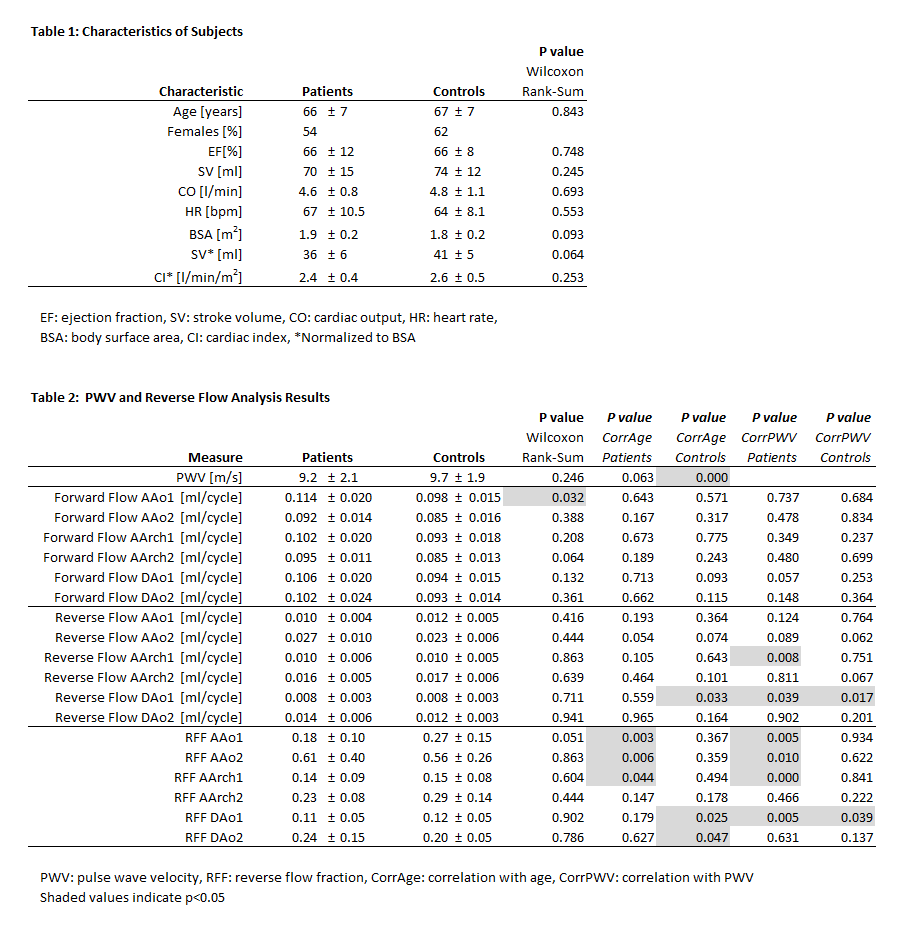
Tables 1-2