2925
Fast Self-Navigated Wall Shear Stress Measurements in the Murine Aortic Arch Using Radial 4D-PC-MRI at 17.6T1Medicine I, Cardiology, University Hospital Wuerzburg, Wuerzburg, Germany, 2Experimental Physics V, University of Wuerzburg, Wuerzburg, Germany, 3Interventional and Diagnostic Radiology, University Hospital Wuerzburg, Wuerzburg, Germany
Synopsis
4D phase contrast (PC)-MRI is a non-invasive tool for the assessment of cardiovascular hemodynamics or the Wall Shear Stress (WSS) to study atherosclerotic risks in vivo. Major limitations of conventional triggered methods are the long measurement times needed for high-resolution data sets and the requirement of stable ECG triggering, which is diffcult at high magnetic field strengths. In this work, an ECG-free, retrospectively synchronized method is presented that enables fast high-resolution measurements of 4D flow and wall shear stress in the murine aortic arch.
Purpose
4D phase contrast (PC)-MRI became an important tool for preclinical studies of atherosclerosis, which enables non-invasive measurements of cardiovascular hemodynamics as well as the assessment of functional parameters such as the wall shear stress (WSS). Major limitations of conventional triggered methods are the long measurement times needed for high-resolution data sets and the necessity of stable ECG triggering. In this abstract, we present an advanced method based on a self-navigated 3D radial PC-cine FLASH acquisition, that enables high-resolution (100 μm)3 4D flow measurements of the complete aortic arch in approximately 30 minutes. 4D-flow dynamics, aortic cross sectional areas, longitudinal, circumferential and radial wall shear stress components as well as the oscillatory shear index (OSI) can be determined from the aquired data. The use of retrospective reconstruction and self-gating enables a very flexible data analysis and increases the robustness since prospective ECG triggering is no longer needed.Methods
MR-Measurements
All data were acquired on a vertical 17.6T small animal MRI scanner with a 1 T/m gradient system and a 24 mm birdcage coil. 4D flow and WSS was measured in the aortic arch of 12-weeks-old wild-type C57/BL6J mice (n=7) with a radial 4D PC-MRI sequence. For slice excitation, a sinc-shaped pulse with a flip angle of 15° was used. The acquisition parameters were: VENC=125 cm/s, TR/TE=3.0/1.1 ms, echo asymmetry: 10%, 160000 spokes, FOV: 25x25x4 mm3, spatial resolution: 100 µm (isotropic). 4D flow measurements were conducted without triggering during free breathing and required a total scan time of 32 minutes.
Reconstruction and Data Acquisition
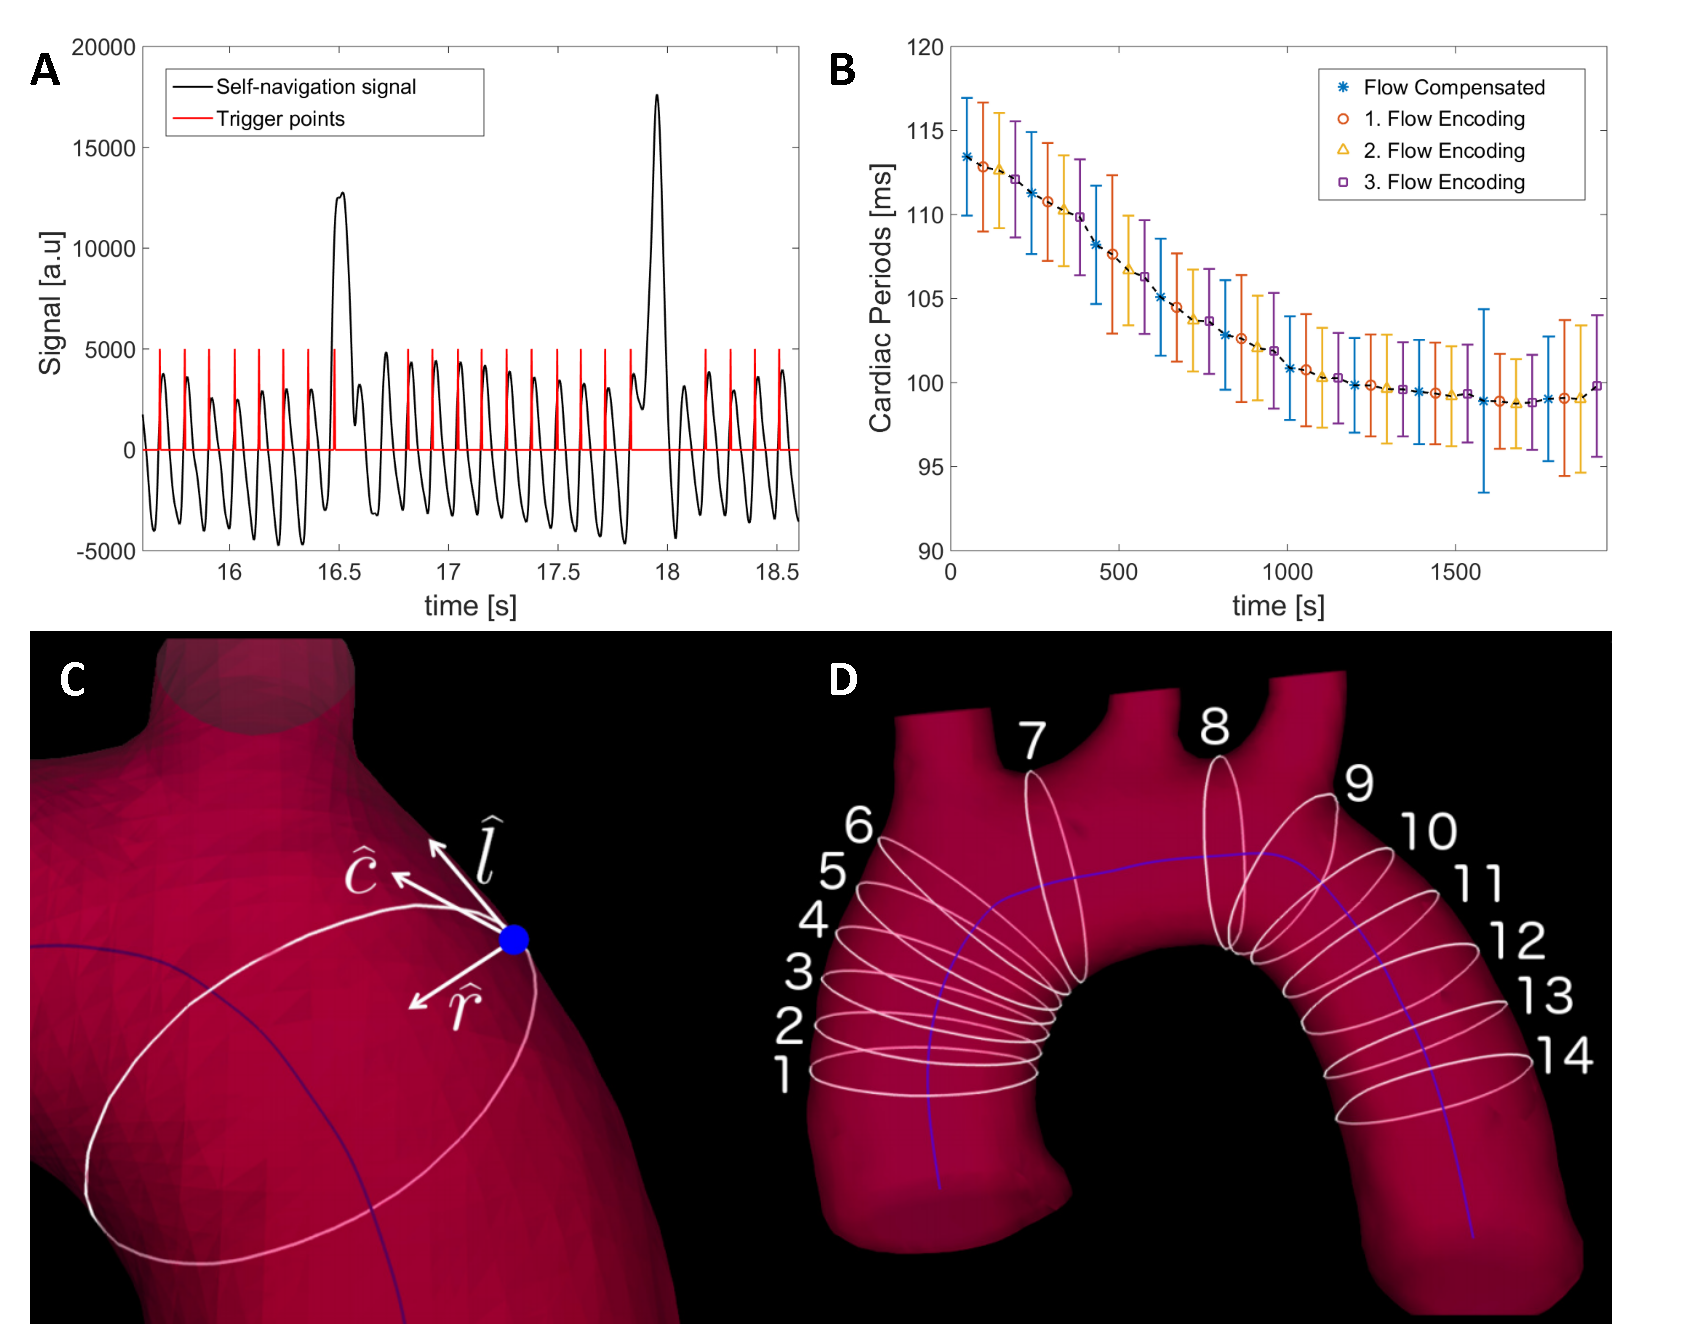
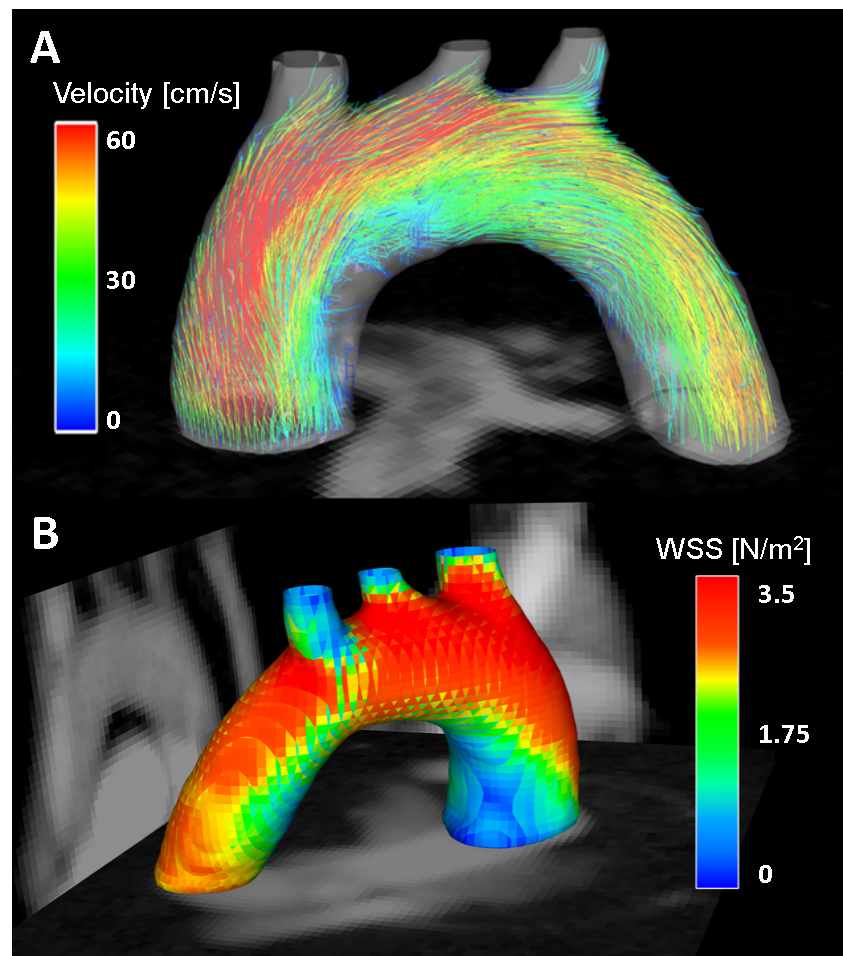
Cardiac and respiratory motion signals extracted from the radial MR signal were used for the retrospective reconstruction1 of 4D-flow cines. Rigid motion correction and a first order B0 correction was used to improve the robustness of magnitude and velocity data. For each velocity encoding step, 3D images with an isotropic spatial resolution of 100μm were reconstructed with convolution gridding at 30 different cardiac phases. After segmenting the aortic lumen semi-automatically2, time-resolved WSS-components and OSI3 were calculated from the spatial velocity gradients at the lumen surface at 14 locations along the aorta (Fig.1C+D). All reconstructions were done with Matlab (The Mathworks, Inc., Natick, USA), WSS and OSI were calculated and visualized with Ensight (CEI Software, USA)3.
Results
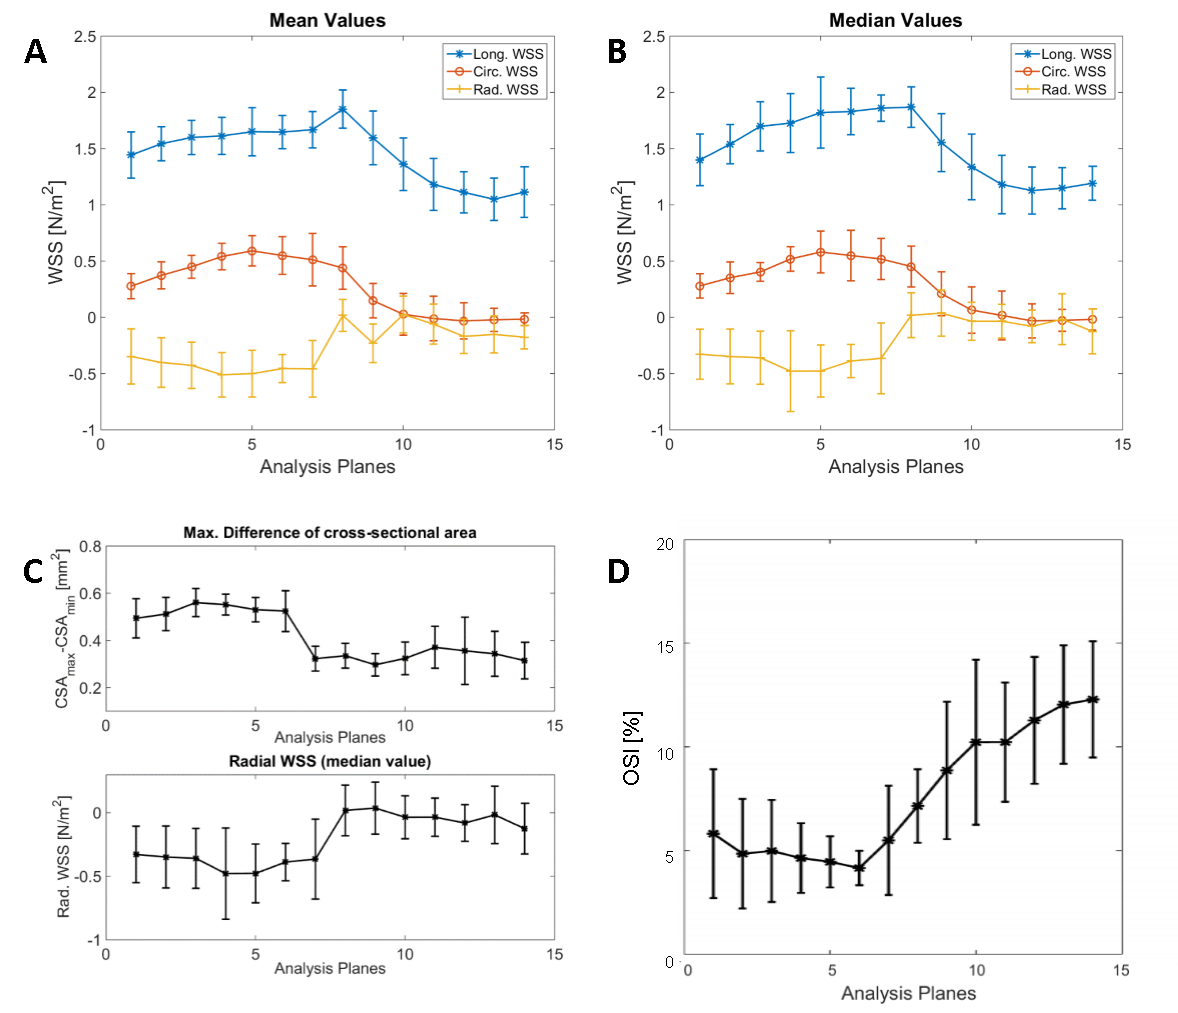
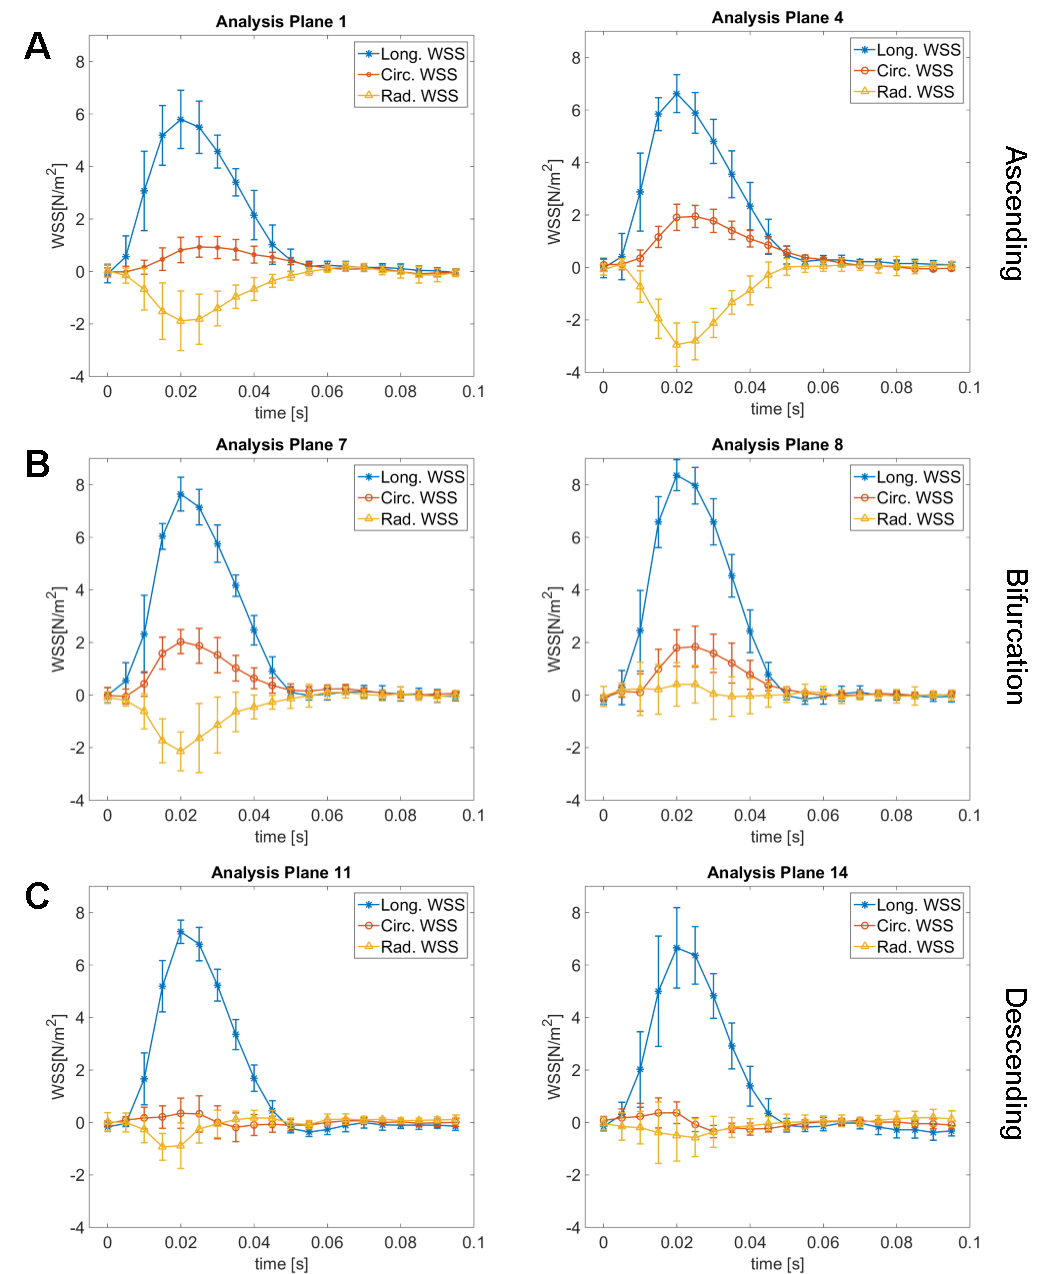
Self-navigation signals were successfully extracted from the radial DC signal. The signal modulations due to cardiac and respiratory motions are clearly recognizable and were used to determine cardiac phases and breath-gating windows (Fig.1A). As shown in Fig.1B, no significant variations between the 4 flow-encoding measurements were observed. Volume flow, cross-sectional areas (Fig.3C), WSS (Fig.3+4) and OSI (Fig.3C) were determined in a measurement time of only 32 minutes. Mean and median of all 3 WSS components (Fig.3A+B) as well as time-resolved WSS over the whole heart cycle (Fig.4) was assessed at 14 analysis planes along the aortic arch. Interestingly, an opposing behavior was observed between maximum differences of cross sectional areas and temporally averaged radial WSS (Fig.3C). Average longitudinal, circumferential and radial WSS values were 1.52 ± 0.29 N/m2 , 0.28 ± 0.24 N/m2 and −0.21 ± 0.19 N/m2, which corresponds well with literature3,4,5.Discussion
In this abstract we demonstrate the feasibility of fast self-navigated 4D flow and WSS measurements in the murine aortic arch with very high temporal (30 frames / cardiac cycle) and spatial resolutions (100 μm)3. The proposed method does not require ECG signals for motion synchronization and hence leads to higher robustness and an improved animal handling. The retrospective approach allows a very flexible data analysis that can be adapted to either high temporal or high spatial resolution. Possible applications of this new method are studies of WSS and hemodynamics in atherosclerotic mouse models as well as 3D measurements of the aortic pulse-wave-velocity.Acknowledgements
This work was supported by grants from the Deutsche Forschungsgemeinschaft (SFB 688 B5, Z2) and the Bundesministerium für Bildung und Forschung (BMBF01 EO1004).References
1. Winter et al., JCMR [2013]; 15:88-98.
2. Herold et al., JCMR [2017]; 19(1):77
3. Stalder et al., MRM [2008]; 60(5): 1218-1231
4 Frydrychowitz et al., JMRI [2009]; 30(1), 77-84
5. Janiczek et al., MRM[2011]; 66(5), 1382-1390
Figures