2923
Single-shot Radial Fast Spin-Echo T2 Mapping Pulse Sequence1Radiology, Northwestern University, Chicago, IL, United States, 2Northwestern University, Chicago, IL, United States
Synopsis
Cardiac T2 mapping is a proven imaging test for myocardial tissue characterization. Standard cardiac T2 mapping involved in cardiac MRI protocol requires a breath-hold duration of 10 sec and usually samples three short-axis planes of the heart. This limited spatial coverage may miss the focal lesion. In this study, we developed a single-shot cardiac T2 mapping pulse sequence and reconstructed multiple T2-weighted images from a single T2-decay data, using k-Space weighted image contrast and compressed sensing technique. We tested its performance in patients with suspected infiltrative cardiomyopathy, and it yielded 7.9% difference in myocardial T2 values compared to standard T2 mapping.
Introduction
Cardiac T2 mapping is a proven imaging test for myocardial tissue characterization in clinical scenarios involving myocardial edema or iron overload1. A standard cardiac T2 mapping pulse sequence2 is based on T2 preparation and balanced steady-state free precession and requires a breath-hold duration of 10 s. As such, a typical cardiac MRI protocol involving cardiac T2 mapping usually samples three short-axis planes of the heart. This limited spatial coverage may miss the focal lesion. In this study, we sought to develop a single-shot cardiac T2 mapping pulse sequence based on radial k-space sampling, compressed sensing3 and k-Space weighted image contrast (KWIC)4 filtering to retrospectively derive multiple echo time reconstructions from a single spin echo image, and evaluate its performance against a standard cardiac T2 mapping pulse sequence in patients with suspected infiltrative cardiomyopathy.Methods
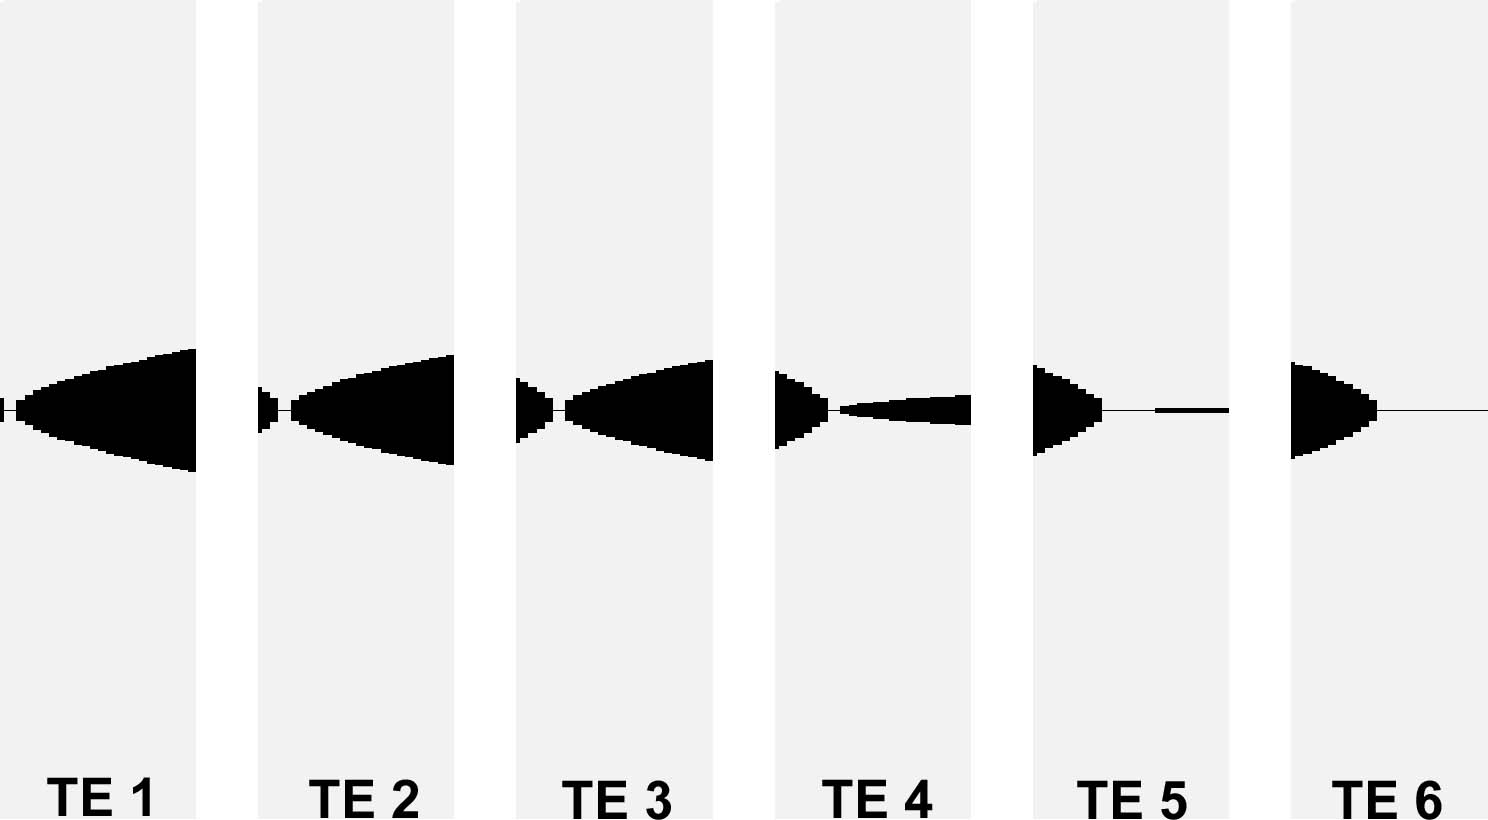
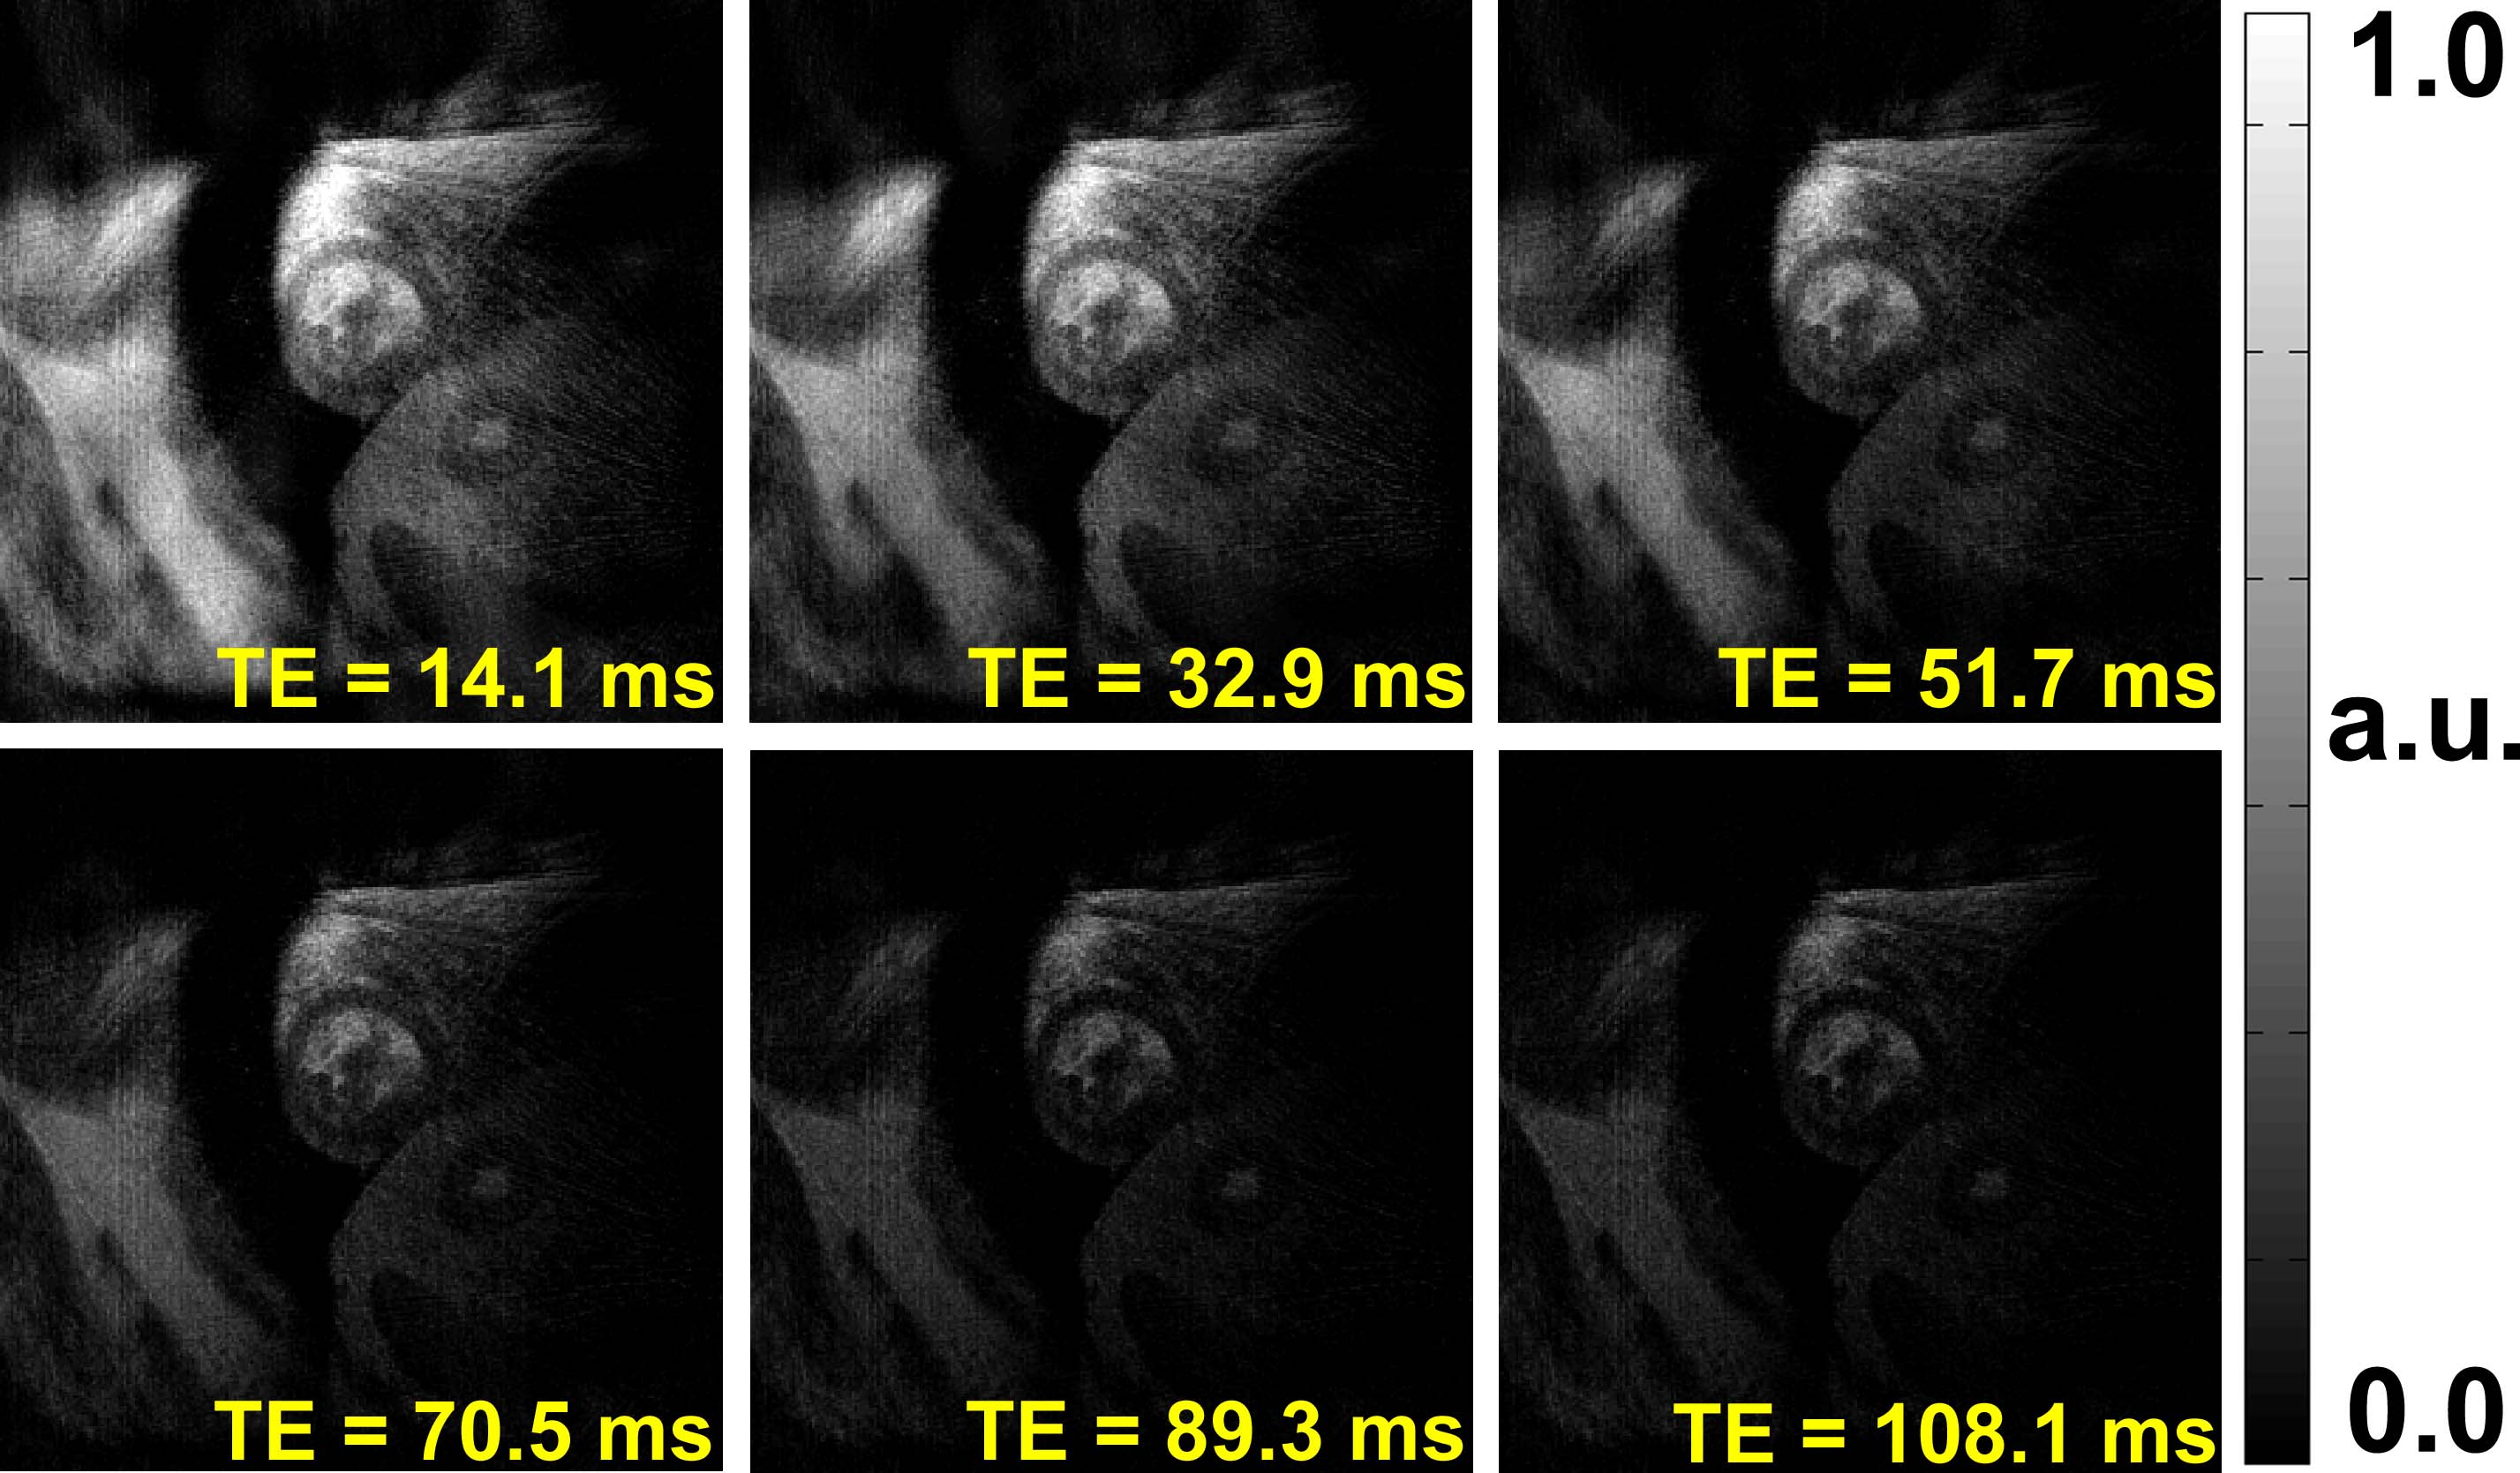
Subject: We scanned 4patients (3 males and 1 female, mean age = 54.6 ± 15.7 years) with suspected infiltrative cardiomyopathy on a 1.5T scanner (Siemens, Avanto) using standard and single-shot cardiac T2 mapping pulse sequences to sample three short-axis planes (apex, mid, base). Pulse Sequence: We developed a radial fast-spin-echo (FSE) T2 mapping pulse sequence employing golden angle ratio5. As shown in Figure 1, this pulse sequence acquires two data sets; T2 data during the first heart and trajectory correction data during the second heart beat. Radial FSE sequence used the following imaging parameters; field of view (FOV) = 300 x 300 mm2, slice thickness = 8 mm, acquisition matrix = 256 x 256, 48 rays with golden angle ratio = 111.246°, TE = 4.7 ms, receiver bandwidth = 501 Hz/pixel. The clinical T2 mapping pulse sequence used; FOV = 400 x 300 mm2, matrix size = 192 x 144, slice thickness = 8 mm, TE/TR = 1.3/2.7 ms, receiver bandwidth = 1184 Hz/pixel, FA = 70°, echo times = 0, 25, and 55 ms. Image Reconstruction: We used the nonuniform fast Fourier transform (NUFFT)6 to grid radial data onto a Cartesian space. We customized the KWIC filter to generate six images with different effective T2 weighting that matches reference T2 decay curves from a phantom experiment. Representative KWIC filters are shown in Figure 2. Specifically, we combined 2nd-3rd-4th echoes for the first TE image, 6th-7th-8th, 10th-11th-12th, 14th-15th-16th, 18th-19th-20th, and 22nd-23rd-24th for the 2-6 TE images, respectively. The effective TE values determined at the center echo of each group (14.1, 32.9, 51.7, 70.5, 89.3, and 108.1 ms, respectively). Following KWIC filtering, we used temporal principal component analysis (TPCA) to initially remove aliasing artifacts and further removed residual artifacts using low-rank block-wise denoising. The resulting TE images were fitted using a weighted non-linear least square algorithm to derive a T2 map. Statistical Analysis: One reader analyzed the T2 maps by manually drawing the myocardial contours. The resulting T2 values were compared using a paired t-test and the Bland-Altman analyses. A p < 0.05 was considered significant.Results
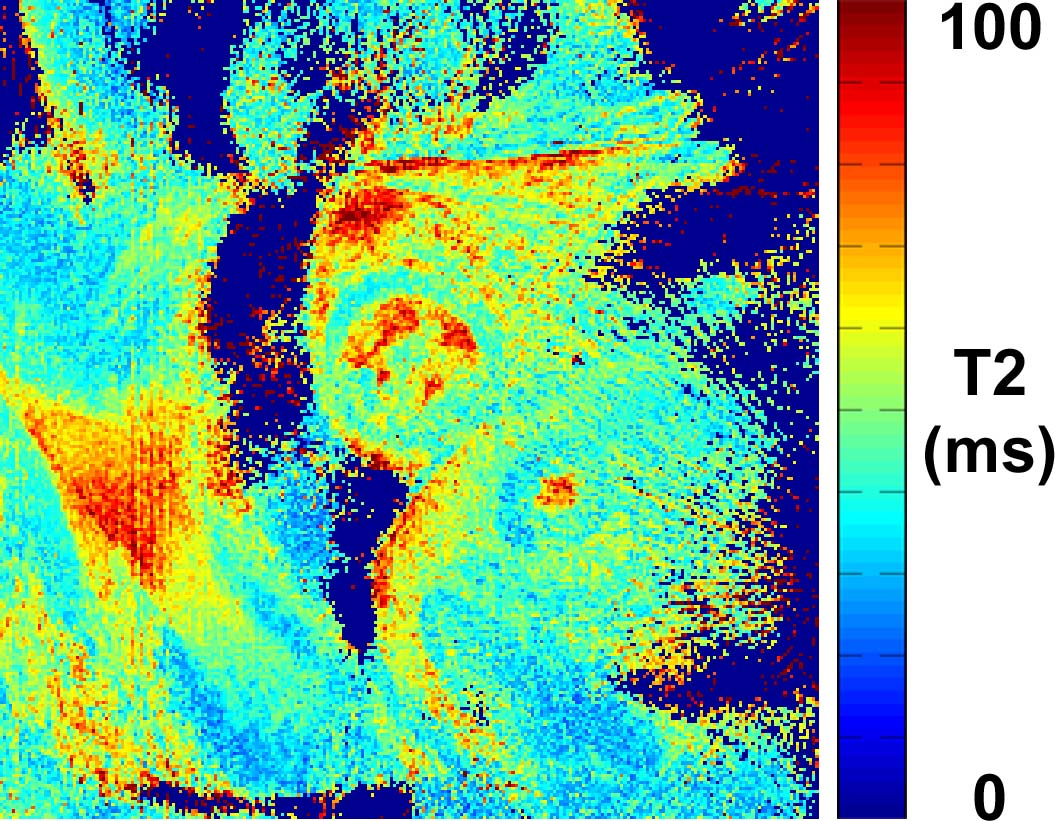
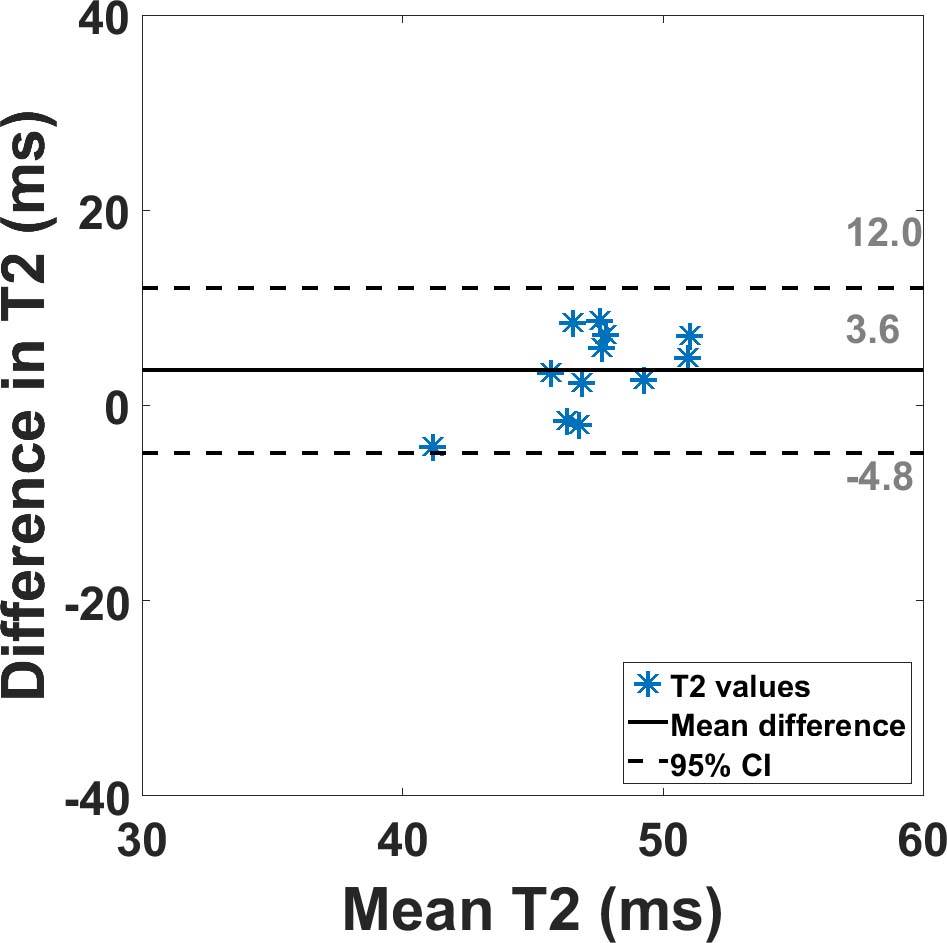
Figure 3 shows representative T2-weighted images generated at different effective TE times with good T2 contrast decaying. Figure 4 shows a representative T2 map calculated from six T2-weighted images in Figure 3. According to paired t-test, radial FSE T2 mapping yields significantly different T2 values compared to standard T2 mapping, but the percent difference between them is 7.9%. According to the Bland-Altman analysis in Figure 5, the mean difference is 3.6 ms (upper and lower 95% limits are 12.0 and -4.8 ms, respectively).Discussions
We showed that a single shot radial TSE T2 mapping pulse sequence with KWIC and compressed sensing technique yielded the percent difference of 7.9% in myocardial T2 values compared to reference method. KWIC design and compressed sensing methods may affect image quality and T2 values.Acknowledgements
This work was supported in part by the following grants: NIH (R01HL116895, R01HL138578, R21EB024315, R21AG055954)References
1. Messroghli DR, et al. Clinical recommendations for cardiovascular magnetic resonance mapping of T1, T2, T2* and extracellular volume: A consensus statement by the Society for Cardiovascular Magnetic Resonance (SCMR) endorsed by the European Association for Cardiovascular Imaging (EACVI). Journal of Cardiovascular Magnetic Resonance. 2017;19:75.
2. Giri S, et al. T2 quantification for improved detection of myocardial edema. Journal of Cardiovascular Magnetic Resonance. 2009;11(1):56. doi:10.1186/1532-429X-11-56.
3. Lustig M, et al. Sparse MRI: The application of compressed sensing for rapid MR imaging. Magnetic Resonance in Medicine. 2007;58(6):1182-1195.
4. Song HK, et al. k-Space weighted image contrast (KWIC) for contrast manipulation in projection reconstruction MRI. Magnetic resonance in medicine. 2000;44(6):825-832.
5. Winkelmann S, et al. An optimal radial profile order based on the Golden Ratio for time-resolved MRI. IEEE Trans Med Imaging. 2007;26(1):68-76.
6. Fessler JA. On NUFFT-based gridding for non-Cartesian MRI. Journal of Magnetic Resonance (San Diego, Calif : 1997). 2007;188(2):191-195. doi:10.1016/j.jmr.2007.06.012.
Figures