2920
Myocardial T1 mapping with second-based MOLLI scheme for reduced heartrate variation: A phantom validation study at 1.5T and 3.0T1Philips, Singapore, Singapore, 2National Heart Centre Singapore, Singapore, Singapore, 3Tan Tock Seng Hospital, Singapore, Singapore, 4Duke-NUS Medical School, Singapore, Singapore, 5Philips, Best, Netherlands
Synopsis
Current standard myocardial T1 mapping is based on the modified Look-Locker inversion recovery (MOLLI) technique and single-shot readout per image acquisition. A second-based scheme has recently been proposed to mitigate the dependence of imaging times on heartrate and also to increase robustness in T1 estimation. Here we report a phantom-based study with ECG simulation comparing it with the original beat-based MOLLI acquisition scheme at both 1.5 and 3.0T. We demonstrate the advantage of this approach with reduced heartrate dependence and variation for an improved T1 quantification reliability.
Introduction
MOLLI (modified Look-Locker inversion recovery)-based T1 mapping is widely used for myocardial tissue characterization, with an acquisition scheme originally defined in heartbeat 1,2. However, scan time of such a scheme depends strongly on heartrate, resulting in an incomplete sampling of the relaxation curve at short RR interval and very long breathhold time at long RR interval, which may lead to potential errors and reduced reproducibility 3,4. To mitigate the dependence of imaging times on heartrate and improve T1 estimation robustness, here we aimed to investigate a recently proposed second-based MOLLI acquisition scheme in phantom with simulated ECG signals in comparison to the classic beat-based scheme.Materials and Methods
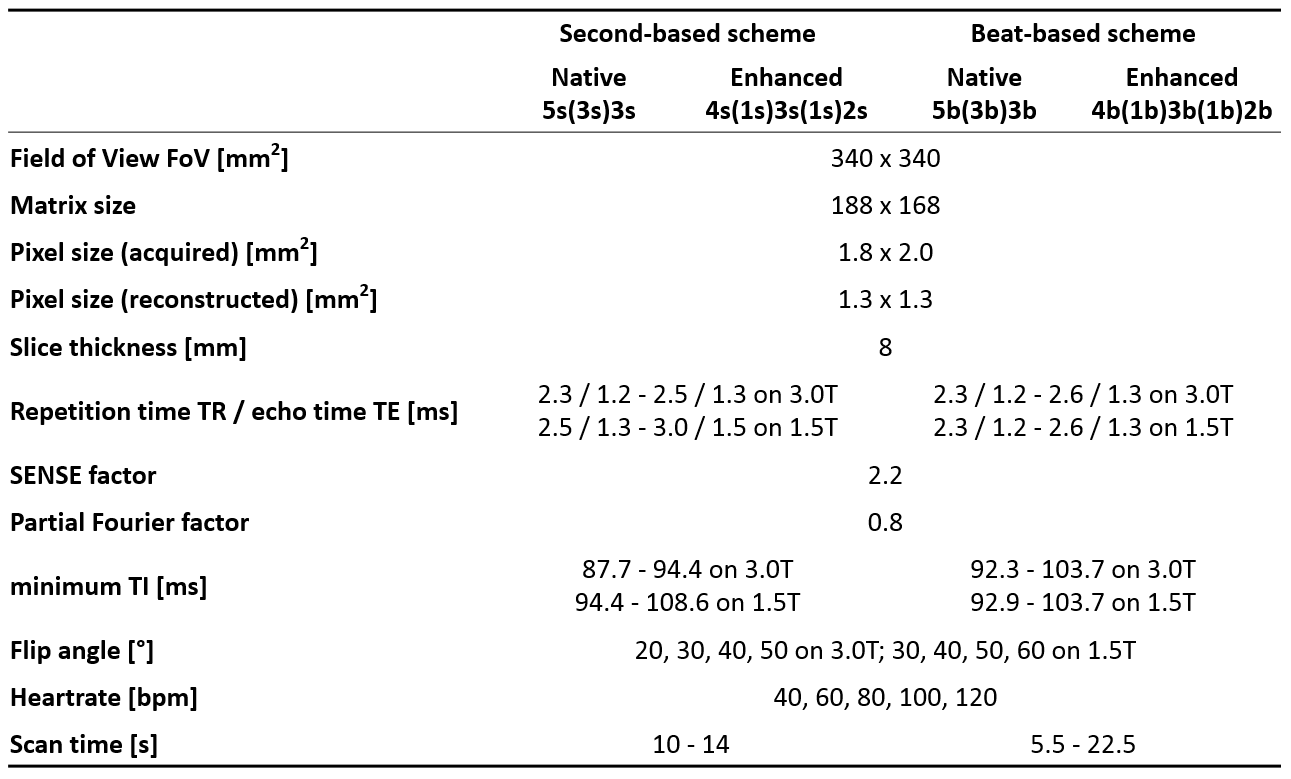
MOLLI T1 mapping was performed on both 1.5T and 3.0T system (Philips Ingenia) in a commercially available phantom (Eurospin II Test System, DiagnosticSonar, UK). Two schemes and four protocols were scanned based on the MOLLI technique, namely second- and beat-based schemes for native and enhanced (post-contrast) T1 mapping. For the second-based scheme the recently proposed method was implemented 3,4, with LL periods and recovery intervals defined in terms of time periods with minimum durations in seconds. In short, the number of single-shot image acquisitions during the LL periods is the ratio of defined minimum time duration to the RR interval in seconds rounded up to the next higher integer (e.g. 5 and 3 for native 5s(3s)3s T1 mapping with a heartrate of 50 bpm; 8, 6, and 4 for enhanced 4s(1s)3s(1s)2s T1 mapping with a heartrate of 120 bpm), while the recovery time is the minimum period between the end of the last acquired image to the next ECG-triggered IR that encompasses a delay of 3 seconds or more for native and of 1 second or more for post-contrast.
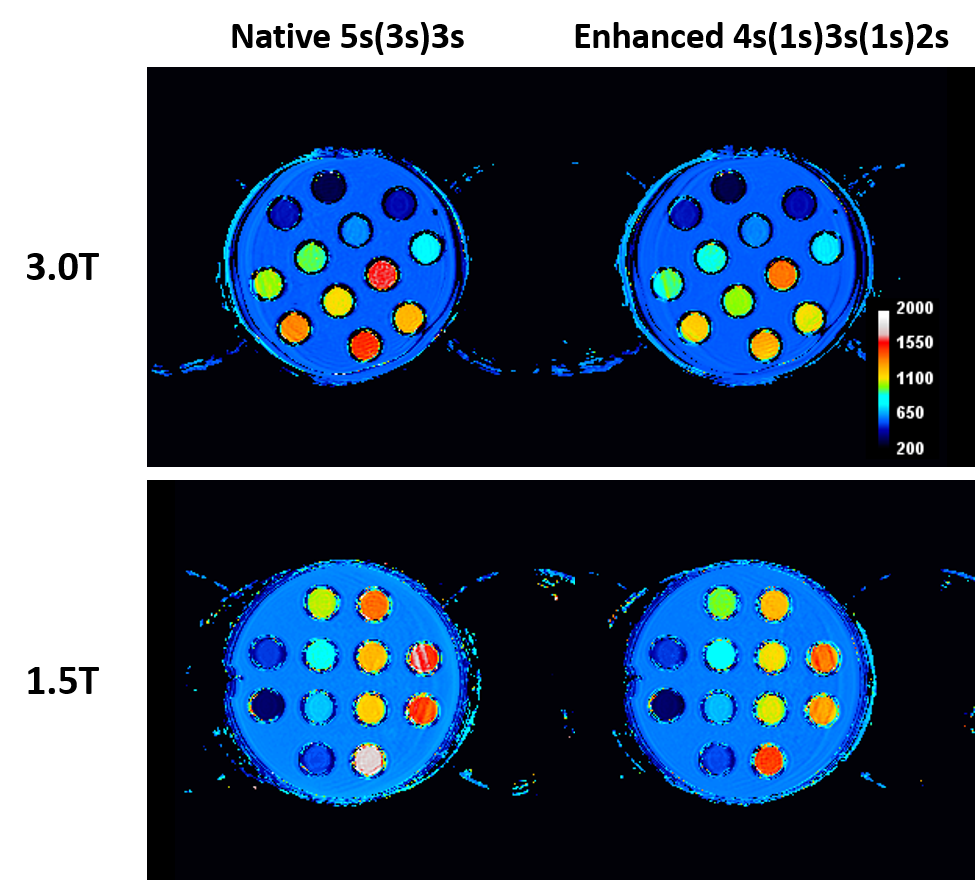
All scans were performed with simulated ECG-gating and bSSFP contrast. The basic parameters including spatial resolution and undersampling factors (2.2 for parallel imaging; 0.8 for partial Fourier) were kept constant as previously reported 5. The following parameters were systematically changed: (1) simulated heartrate for 40, 60, 80, 100, and 120 beats per minute (bpm); (2) flip angle for 30°, 40°, 50°, 60° on 1.5T and 20°, 30°, 40°, 50° on 3.0T. Detailed imaging parameters see Table 1. T1 maps were generated automatically on the scanner in vendor’s commercial software (release version R5.1.8 on 3.0T and R5.3 on 1.5T) using maximum likelihood estimation (MLE) fitting 6. T1 values were measured from 12 phantom tubes (Figure 1) with ROIs drawn carefully without inclusion of artifacts, reported as mean ± standard deviation (SD), and compared to the phantom specification. Statistical analysis was done in SPSS a P value <0.05 was considered significant.
Results and Discussion
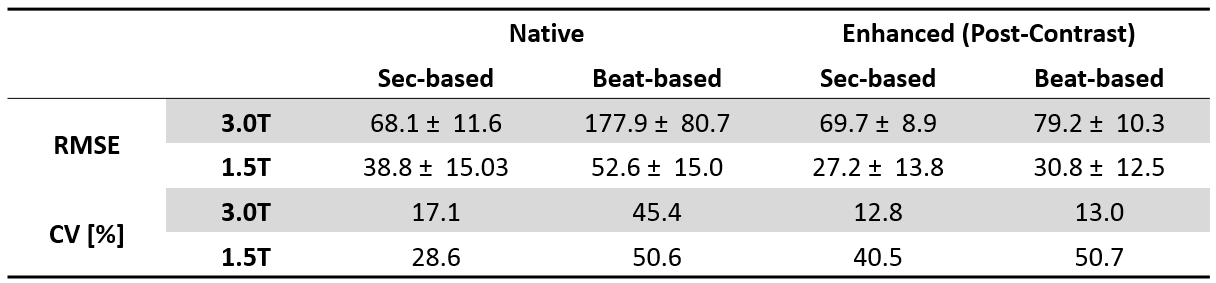
The measured T1 values across all tubes and scans gave a relative error of -11% on 3.0T (range -17% to -7%) and -1% on 1.5T (range -5% to 2%). All scans across different flip angles and heartrates gave an excellent correlation to the phantom specification (correlation coefficient 0.995 to 0.999) on both field strengths. For robustness of T1 estimation, phantom tubes with long T1 (>900 ms on 3.0T and >800 ms on 1.5T) were included for native T1 mapping analysis, while tubes with short T1 (≤900 ms on 3.0T and ≤800 ms on 1.5T) were included for enhanced T1 mapping analysis. In addition, a flip angle of 20° on 3.0T and 60° on 1.5T revealed the smallest root mean square deviation (RMSE) (114.3 ± 44.6 on 3.0T; 37.4 ± 17.4 on 1.5T) and the corresponding data were used for further analysis.
In terms of agreement to phantom specification, second-based scheme showed smallest RMSE for both native and enhanced T1 mapping for different heartrates. On the other hand, both of them showed smaller variations across heartrates as demonstrated by the coefficient of variation (CV) when compared to the beat-based schemes, respectively. Details were summarized in Table 2. Furthermore, for second-based scheme, the exact scan time (i.e. breathhold time) varied only slightly with the heartrate, and was approximately 10 to 13 seconds, while the beat-based scheme varied from about 5 to 23 seconds.
Conclusion
We have demonstrated in phantom with simulated ECG gating the advantage of a second-based MOLLI scheme for measurement of native and post-contrast myocardial T1 relaxation times. In comparison to the original schemes defined in beats, the scan time depends less on heartrate and allows for a better sampling of the relaxation curve at high heartrate. While calculation of the fitting errors may further validate the results 3,4,5, future clinical studies are warranted in a cohort of human subjects.Acknowledgements
No acknowledgement found.References
1. Messroghli DR, Radjenovic A, Kozerke S, et al. Magn Reson Med 2004;52:141.
2. Dabir D, et al. J Cardiovasc Magn Reson 2014;16:69.
3. Kellman P, Arai AE, Xue H. J Cardiovasc Magn Reson 2013;15:56.
4. Kellman P and Hansen M. J Cardiovasc Magn Reson 2014;16:2.
5. Le TT, Zhang S, Kabus S, et al. J Cardiovasc Magn Reson 2016; 18:176.
6. Karlsen, et al. Magn Reson Med 1999;41:614.
Figures