2919
Evaluation of MOLLI fitting algorithms robustness to partial volume effects due to fat1Institute for Systems and Robotics/Department of Bioengineering, Instituto Superior Técnico, Universidade de Lisboa, Lisbon, Portugal
Synopsis
The MOLLI sequence for myocardium T1 quantification is widely applied in the clinical setting. The standard 3-parameter fitting algorithm allows a high precision in the T1 estimates but it comes at the cost of a low accuracy. The accuracy can be improved using the instantaneous signal loss (InSiL) approximation method for signal fitting. In this work we evaluated the robustness of the InSiL algorithm when fat also contributes to the signal. The results show that InSiL enables to increase the accuracy of the MOLLI sequence even in the presence of partial volume effects due to fat.
Introduction
The MOLLI sequence for myocardium T1 quantification is widely applied in the clinic. The standard 3-parameter fitting algorithm allows high precision but as the readout affects the magnetization, this procedure suffers from low accuracy.1 It is also vulnerable to partial volume effects (PVE) such as fat in the epicardial border or fat infiltration in the myocardium.2,3 The detrimental influence of the readout can be reduced by using an instantaneous signal loss (InSiL)4 approximation. The robustness of the InSiL algorithm to PVE had not yet been studied. Here we evaluated the robustness of InSiL4 considering the contribution of additional components such as fat to the measured signal.Methods
Extended phase graphs simulations were performed in Matlab2016a to generate signals from MOLLI 5(3)3 bSSFP sequence (flip angle 35º, TImin=100ms; TR/TE=2.5/1.25ms).5 A component representative of the myocardium tissue (T1/T2=900/50ms; on-resonance) and the other of fat tissue (T1/T2=260/60ms; 210Hz off-resonance) were simulated.
In the first simulation, signals with different fat fractions (FF) were generated by combining the two components (FF=[0.00-0.50]), where 0 represents absence of fat and 1 corresponds to a pixel composed only by fat. Gaussian noise was added to obtain a typical SNR (SNR=43).6
Two fitting algorithms were applied to estimate T1 values: (1) conventional 3-parameter fitting and (2) InSiL4. In the 3-parameter fitting approach, the signal evolution is modeled by the expression $$$S(t)=A-Bexp(-t/T_1^*)$$$, where $$$T_1^*$$$ is the apparent T1. This was performed by using a Levenberg-Marquardt algorithm. The correction $$$T_1 = T_1^*(B/A -1)$$$ is subsequently applied. The InSiL method was implemented according to 4. The T1 was retrieved by fitting the signal $$$S$$$ to a simulated magnetization $$$M$$$ (for $$$N$$$ single shot images):
$$[M_0,T_1,C]=\min_{M_0, T_1, C }\sum_{i=1}^{N=8}(M(i)-S(i))^2$$
The evolution of the magnetization $$$M$$$ is simulated between readouts $$$k$$$ and $$$k+1$$$ by $$$M(k+1)=M_0+(M(k)–M_0)exp(-t/T_1)$$$, where $$$M_0$$$ is the equilibrium magnetization. The bSSFP readout effect is represented by a loss of signal when the center of k-space is acquired, and is parametrized by the constant $$$C$$$. T1 estimates for both methods were evaluated in terms of accuracy and precision.
A second simulation was performed using a cardiac numerical phantom7 to evaluate the performance of both algorithms in the presence of PVE due to fat near the epicardium. A low-pass filter was applied to a fat mask in order to create a mask with variable FF between 0.10-0.50 in pixels near the myocardium border (Figure 1). The FF, T1 and T2 ground-truth values were used to generate the MOLLI signal for each pixel. The two fitting methods were applied pixelwise and error maps for each method were calculated.
Results
Figure 2 shows that the 3-parameter fitting method is more sensitive to fat PVE, especially for longer T1 values (>1500 ms) for which there is a T1 overestimation (|error|>15%). InSiL is more robust to fat and for FF<0.20 the observed errors are lower than 10%.
Figure 3 illustrates the impact of PVE due to fat near the epicardium on the accuracy and precision of the T1 estimative for both techniques. While using the 3-parameter fitting method increases the error, InSiL is associated with higher T1 dispersion in pixels with high fat contribution. This is corroborated by Figure 4, which shows the normalized error for different levels of FF. InSiL presents similar mean T1 values for FF up to 0.30 (mean error$$$\pm$$$standard deviation: from 1$$$\pm$$$4% (FF=0.00) to 1$$$\pm$$$5% (FF=0.30)), while the 3-parameter algorithm results in an increase in the error from 8$$$\pm$$$3% (FF=0.00) to 10$$$\pm$$$4% (FF=0.30).
Discussion
The results show that the impact of fat on the accuracy of T1 maps is more extreme for longer T1 values (>1500ms). Since the 3-parameter fitting method is affected by T2 effects during the readout, the differences in T2 of the two components (water and fat) will influence the final T1 error. On the other hand, InSiL simulates the readout effect as a global loss of signal in each pixel, so the effects of T2 for both components are compensated for, and the error results mainly from differences in T1. Even so, for T1 in the 900-1100ms interval and for FF up to 0.30, the InSiL shows errors below 4%, while the 3-parameter fitting approach reaches -11%. For higher FF, InSiL may be useful due to the reduced error, but it is associated with lower precision.Conclusion
The clinical availability of MOLLI makes it a widespread tool for myocardium T1 quantification. InSiL is a reconstruction technique which does not require any changes to the acquisition scheme. The results presented in this work show that InSiL enables to increase the accuracy of MOLLI even in the presence of fat PVE. The next step will be to replicate this study in vivo.Acknowledgements
FCT grant SFRH/BD/120006/2016 and UID/EEA/5009/2013.References
1 Kellman P, Hansen MS. T1-mapping in the heart: accuracy and precision. J Cardiovasc Magn Reson. 2014;16(1):2.
2 Larmour S, Chow K, Kellman P, Thompson RB. Characterization of T1 bias in skeletal muscle from fat in MOLLI and SASHA pulse sequences: Quantitative fat-fraction imaging with T1 mapping. Magn Reson Med. 2017;77(1):237-249.
3 Kellman P, Bandettini WP, Mancini C, Hammer-Hansen S., Hansen MS, Arai AE. Characterization of myocardial T1-mapping bias caused by intramyocardial fat in inversion recovery and saturation recovery techniques. J Cardiovasc Magn Reson. 2015;17(1):33.
4 Shao J, Nguyen K-L, Natsuaki Y, Spottiswoode B, Hu P. Instantaneous Signal Loss Simulation (InSiL): An Improved Algorithm for Myocardial T-1 Mapping Using the MOLLI Sequence. J Magn Reson Imag. 2015;41(3):721-729.
5 Messroghli DR, Greiser A, Frohlich M, Dietz R, Schulz-Menger J. Optimization and validation of a fully-integrated pulse sequence for modified look-locker inversion-recovery (MOLLI) T1 mapping of the heart. J Magn Reson Imaging. 2007;26(4):1081–6.
6 Kellman P, Arai A E, Xue H. T1 and extracellular volume mapping in the heart: estimation of error maps and the influence of noise on precision. J Cardiovasc Magn Reson. 2013;15:56.
7 Wissmann L, Santelli C, Segars WP, Kozerke S. MRXCAT: Realistic Numerical Phantoms for Cardiovascular Magnetic Resonance. J Cardiovasc Magn Reson. 2014;16:63.
Figures
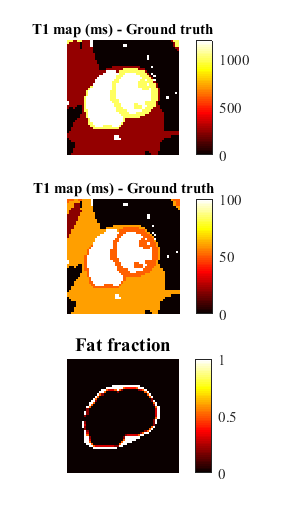
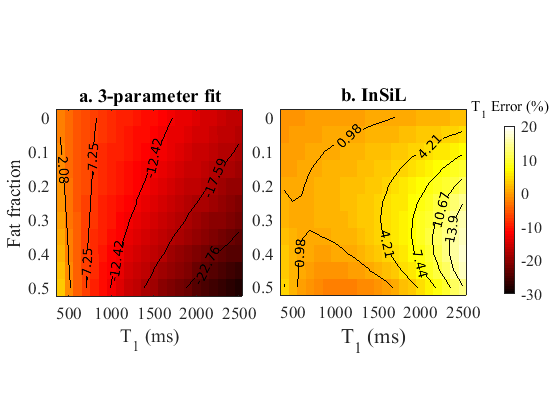
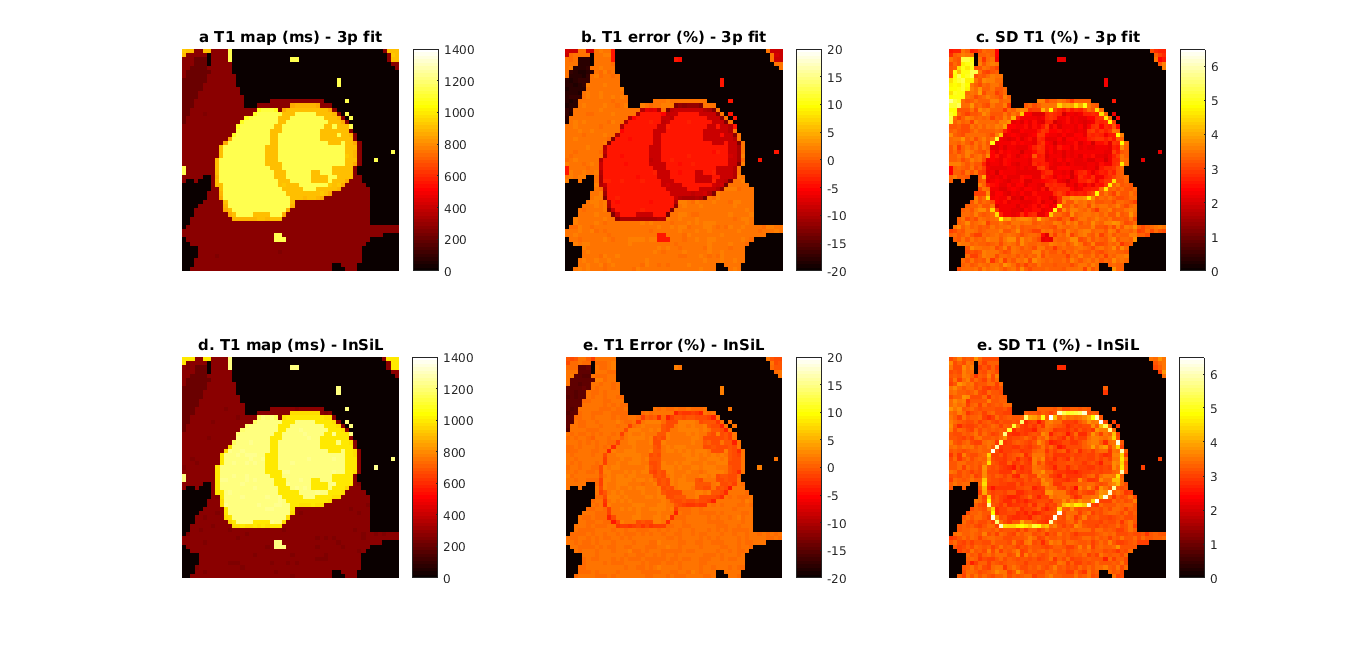
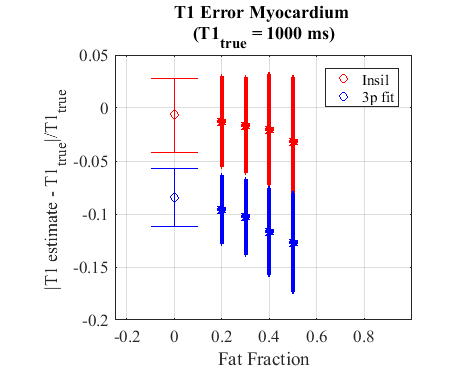
Figure 4 - Normalized error of T1 estimative ($$$\pm$$$Standard deviation) within pixels of the epicardium border with FF values between 0.00 and 0.50 for the numerical phantom with InSiL and 3-parameter fit (3p fit). InSiL presents similar mean error values for FF up to 0.30 (from 1 $$$\pm$$$ 4% (FF=0.00) to 1$$$\pm$$$5% (FF=0.30)), while the 3-parameter algorithm presents an increase in the error from 8$$$\pm$$$3% (FF=0.00) to 10$$$\pm$$$4 % (FF=0.30). It is important to note that for FF = 0.50 the error with the InSiL method is 3$$$\pm$$$6% while with the 3-parameter fitting is 12$$$\pm$$$4%.