2918
Simulation-Aided Contrast Agent Washout Analysis in Patients with Acute Myocarditis1Berlin Ultrahigh Field Facility, Max-Delbrueck-Centrum Berlin-Buch, Berlin, Germany, 2DZHK (German Centre for Cardiovascular Research), Berlin, Germany, 3Medical Physics and Metrological Information Technology, Physikalisch-Technische Bundesanstalt, Berlin, Germany, 4Technical University Berlin, Berlin, Germany, 5Working Group on Cardiovascular Magnetic Resonance, Experimental and Clinical Research Center (ECRC), Berlin, Germany, 6Department of Cardiology and Nephrology, HELIOS Klinikum Berlin Buch, Berlin, Germany, 7Clinic Agatharied, Dept. of Cardiology, University of Munich, Hausham, Germany
Synopsis
Contrast-enhancement techniques allow the visualization of small myocardial injuries in acute myocarditis, which cannot be detected by any other noninvasive technique. Late Gadolinium Enhancement (LGE) has been shown predictive for the development of heart failure. Early Gadolinium Enhancement (EGE) was identified as parameter for detection of disease activity. We analyze the contrast agent washout during 10 minutes after tracer administration. Our aim is to characterize parameter values of patients with myocarditis in a 3D spatially distributed contrast agent flow model.
Introduction
Cardiac Magnetic Resonance(CMR) has emerged as a valuable tool for the detection and monitoring of acute myocarditis1,2. In particular, contrast-enhancement techniques allow the visualization of small myocardial injuries, which cannot be detected by any other noninvasive technique3. Late Gadolinium Enhancement (LGE) have been shown predictive for the development of heart failure4. The Extracellular Volume(ECV)5 fraction of patients with myocarditis has been elevated in single segments6. However, the global elevation was not significant1 and is therefore not addressed here. Early Gadolinium Enhancement (EGE) was identified as parameter for detection of disease activity7. This parameter is able to identify reversible injury8. This suggests that the whole contrast-agent washout kinetics can help in understanding the myocardial tissue damage. Tracer kinetic modeling has previously been employed for the quantification of first-pass perfusion9,10. This involves a much smaller timeframe and requires images of higher temporal resolution than the contrast agent washout process as addressed here. The pharmacokinetic models have been adapted to delayed enhancement11, which included the application of multiple compartments but remained constant in space. However, spatial distribution of contrast agent can play a key role in characterization of specific diseases. Therefore, our aim is to characterize parameter values of patients with myocarditis in a 3D spatially distributed contrast agent flow model.Methods
Simulations:
Blood and contrast agent flow was calculated using a previously described Computational Fluid Dynamics model12,13 with two compartments, using an in-house developed Matlab (The Mathworks, Natick, USA) program. It determines the amount of contrast agent $$$c$$$ in the vascular $$$c^v$$$ and the extracellular compartment $$$c^e$$$ by $$ \frac{\partial c^v}{\partial t} + u^v \cdot \nabla c^v - \alpha\nabla^2 c^v + ExR(1-\phi)(c^v-c^e)=\frac{AIF}{\phi} $$ $$ \frac{\partial c^e}{\partial t} - \beta\nabla^2 c^e - ExR\phi(c^v-c^e)=0 $$ where $$$\alpha, \beta \in \mathbb{R}$$$ are diffusion weights, $$$ExR \in \mathbb{R}$$$ is the exchange rate and together with $$$\phi \in \mathbb{R}$$$ describe the exchange between vascular and extracellular space, $$$u^v:\mathbb{R}^3\rightarrow \mathbb{R}$$$ is the blood flow velocity, computed as in14, and $$$AIF:\mathbb{R}^3\times\mathbb{R}\rightarrow \mathbb{R}$$$ is the arterial input function, where we assumed a population-derived functional form15 which was adapted by the contrast-agent dose given. A cube $$$[0, 10]^3$$$ was discretized $$$11 \times 11 \times 11$$$ with inflow node at $$$(2, 5, 5)$$$ and sampling point $$$(3, 5, 5)$$$. Parameters ($$$ \alpha=1, \beta=1/10, \phi=0.14$$$) were assumed as suggested previously12.
Measurements:
N=18 patients with an acute myocarditis1, underwent CMR at 1.5 T. Native T1-Mapping was assessed, as well as post-contrast 1,3,5,7 and 10 minutes after administration of gadobutrol (0.15mMol/(kg body weight)). All T1-Mappings were acquired using MOLLI16 with a 5(3)3 scheme. The mid-ventricular slice in a short axis view was analyzed with manually drawn contours and automatic patient-wise image registration. A group of age and sex matched controls underwent the same procedure. The contrast-agent concentration was calculated by17 $$ c= (\frac{1}{T_1 native} - \frac{1}{T_1 post-contrast})\frac{1}{r_1},$$ where r1 is the r1 relaxivity of the contrast-agent.
Post-Processing:
The solution $$$c=(c^v,c^e)$$$ was numerically estimated for different exchange rates $$$ExR \in \mathbb{R}$$$ and were then used for fitting to measured contrast agent concentrations by a least squares algorithm. Statistical test for significance was a one-sided Mann-Whitney U test.
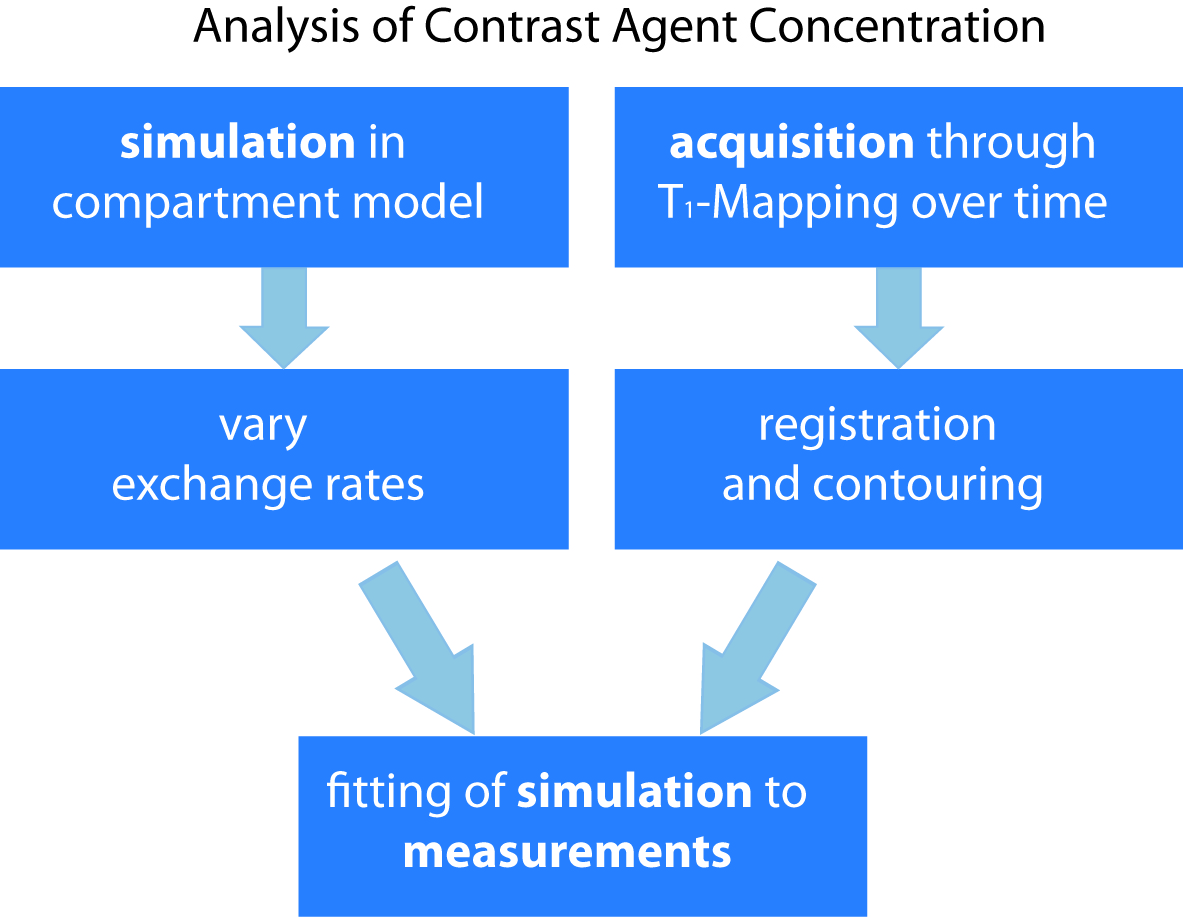
An overview of the workflow is given in figure 1.
Results
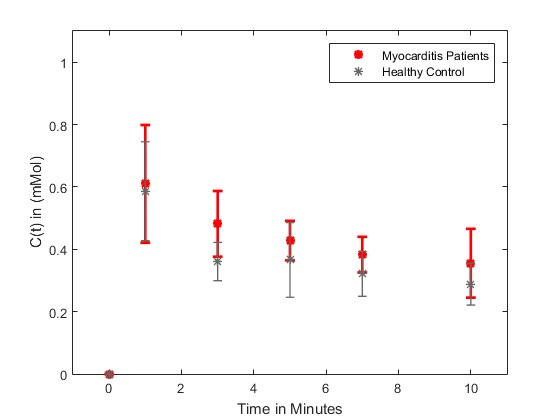
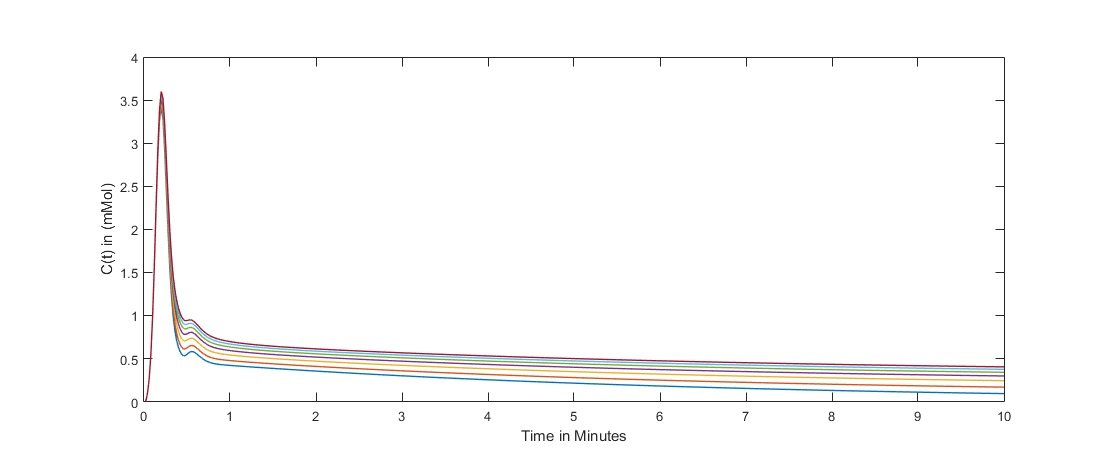
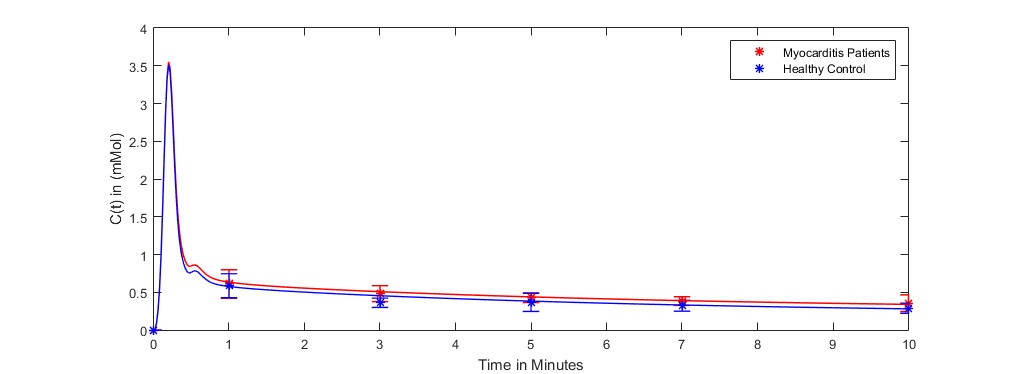
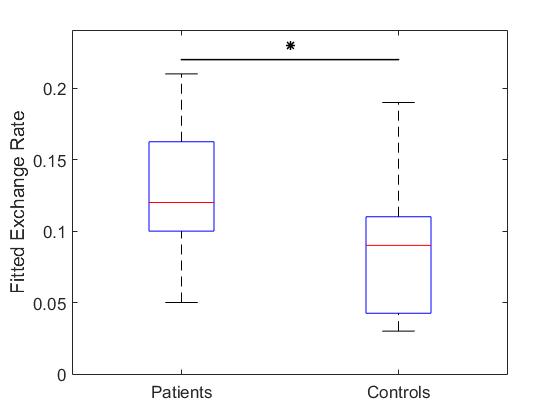
For N=15 datasets, the image registration was successful for patients with acute myocarditis and healthy controls. Figure 2 provides the mean contrast agent concentrations and standard deviations of patients and volunteers derived from T1-Mapping during washout. Simulated contrast agent concentration curves for varying exchange rates have successfully been generated for a time-course of 10 minutes after contrast agent injection (figure 3). Fitting of simulated curves to measurements (figure 4) were successful with an overall error of <5%. A significant elevation (p<0.01) of exchange rates for the whole washout could be observed in patients with acute myocarditis compared to controls (figure 5).Discussion
The significant difference in exchange rate between patients with acute myocarditis and healthy controls implies the validity of this parameter describing a key role in the contrast agent washout process. Limitations include the small amount of patients, as well as measurements per patient. 3D whole-heart T1-Mappings would be highly beneficial for this work, since it would show the total distribution of contrast agent in the heart. Also, accurate patient-specific arterial input functions should be set as boundary conditions.Conclusion
Our results suggest the feasibility of analyzing contrast agent washout kinetics in patients with acute myocarditis using the presented flow model. To take our research to the next level full patient-specific 3D simulations can be adapted by incorporation of pixel-wise T1 measurements.Acknowledgements
No acknowledgement found.References
1. Von Knobelsdorff-Brenkenhoff F, Schüler J, Dogangüzel S, et al. Detection and Monitoring of Acute Myocarditis Applying Quantitative Cardiovascular Magnetic Resonance. Circ Cardiovasc Imaging. 2017;10(2). doi:10.1161/CIRCIMAGING.116.005242.
2. Pollack A, Kontorovich AR, Fuster V, Dec GW. Viral myocarditis—diagnosis, treatment options, and current controversies. Nat Rev Cardiol. 2015;12(11):670-680. doi:10.1038/nrcardio.2015.108.
3. Mahrholdt H, Goedecke C, Wagner A, et al. Cardiovascular Magnetic Resonance Assessment of Human Myocarditis: A Comparison to Histology and Molecular Pathology. Circulation. 2004;109(10):1250-1258. doi:10.1161/01.CIR.0000118493.13323.81.
4. Mavrogeni S, Spargias C, Bratis C, et al. Myocarditis as a precipitating factor for heart failure: Evaluation and 1-year follow-up using cardiovascular magnetic resonance and endomyocardial biopsy. Eur J Heart Fail. 2011;13(8):830-837. doi:10.1093/eurjhf/hfr052.
5. Kellman P, Wilson JR, Xue H, Ugander M, Arai AE. Extracellular volume fraction mapping in the myocardium, part 1: evaluation of an automated method. J Cardiovasc Magn Reson. 2012;14(1):63. doi:10.1186/1532-429X-14-63.
6. Schüler J, Rudolph A, Schmacht LM, et al. Combined parametric mapping allows discrimination of disease activity in myocarditis. J Cardiovasc Magn Reson. 2016;18(Suppl 1):P256. doi:10.1186/1532-429X-18-S1-P256.
7. Friedrich MG, Sechtem U, Schulz-Menger J, et al. Cardiovascular Magnetic Resonance in Myocarditis: A JACC White Paper. J Am Coll Cardiol. 2009;53(17):1475-1487. doi:10.1016/j.jacc.2009.02.007.
8. Cocker MS, Abdel-Aty H, Strohm O, Friedrich MG. Age and gender effects on the extent of myocardial involvement in acute myocarditis: a cardiovascular magnetic resonance study. Heart. 2009;95(23):1925-1930. doi:10.1136/hrt.2008.164061.
9. Larsson HBW, Fritz-Hansen T, Rostrup E, Serndergaard L, O D Ring P, Henriksen O. Myocardial Perfusion Modeling Using MRI.
10. Tofts PS. Modeling tracer kinetics in dynamic Gd-DTPA MR imaging. J Magn Reson Imaging. 1997;7(1):91-101. doi:10.1002/jmri.1880070113.
11. Knowles BR, Batchelor PG, Parish V, et al. Pharmacokinetic modeling of delayed gadolinium enhancement in the myocardium. Magn Reson Med. 2008. doi:10.1002/mrm.21767.
12. Cookson AN, Lee J, Michler C, et al. A spatially-distributed computational model to quantify behaviour of contrast agents in MR perfusion imaging. Med Image Anal. 2014. doi:10.1016/j.media.2014.07.002.
13. Riazy L, Olbrich M, Schaeffter T, Fritschi S, Niendorf T, Schulz-Menger J. Quantification of Perfusion in Hypertrophic Cardiomyopathy using 3D Contrast Agent Flow Simulation. ISMRM Annu Meet Proc. 2017.
14. Michler C, Cookson AN, Chabiniok R, et al. A computationally efficient framework for the simulation of cardiac perfusion using a multi-compartment Darcy porous-media flow model. Int j numer method biomed eng. 2013. doi:10.1002/cnm.2520.
15. Parker GJM, Roberts C, Macdonald A, et al. Experimentally-derived functional form for a population-averaged high-temporal-resolution arterial input function for dynamic contrast-enhanced MRI. Magn Reson Med. 2006;56(5):993-1000. doi:10.1002/mrm.21066.
16. Messroghli DR, Radjenovic A, Kozerke S, Higgins DM, Sivananthan MU, Ridgway JP. Modified Look-Locker inversion recovery (MOLLI) for high-resolution T1 mapping of the heart. Magn Reson Med. 2004;52. doi:10.1002/mrm.20110.
17. Buckley D, Parker G. Measuring contrast agent concentration in T1-weighted dynamic contrast-enhanced MRI. Dyn Contrast-Enhanced Magn Reson Imaging Oncol. 2005:69-79. doi:10.1007/3-540-26420-5_5.
Figures