2915
3D SASHA myocardial T1 mapping with high accuracy and improved precision1School of Biomedical Engineering and Imaging Sciences, King's College London, London, United Kingdom, 2Imagerie Adaptative Diagnostique et Intervenionelle, INSERM U947 et Université de Lorraine, Nancy, France, 3CIC-IT 1433, INSERM, Université de Lorraine, Nancy, France
Synopsis
In this study we propose to further improve the precision of free-breathing 3D saturation-recovery based T1 mapping (3D SASHA), while keeping its high accuracy, by employing a novel 3D denoising method which exploits spatio-temporal correlations in the T1-weighted images. The proposed approach has been tested on ten healthy subjects and four patients with cardiovascular disease. For all subjects, no statistical difference was observed between the precision measured on 3D denoised SASHA and 2D MOLLI T1 maps (p=0.62), while preserving the T1 accuracy. There was an improvement in the precision after denoising on the 3D SASHA T1 maps acquired in healthy subjects and patients.
Introduction
Free-breathing 3D quantitative myocardial T1-mapping allows for volumetric coverage of the heart providing higher signal-to-noise ratio (SNR) and spatial resolution than conventional 2D approaches. Recently a 3D saturation recovery based T1-mapping technique (3D SASHA1) was proposed. 3D SASHA achieves higher accuracy in the estimation of myocardial T1 values but lower precision than the clinically used inversion recovery based 2D MOLLI2 technique. We propose to further improve the precision of the 3D SASHA technique, while keeping its high accuracy, by employing a novel 3D denoising method which exploits spatio-temporal correlations in the acquired T1-weighted images3. The proposed approach was tested in ten healthy subjects and four patients with different cardiomyopathies and compared against 2D MOLLI acquisitions in terms of precision.Methods
The 3D denoising technique imposes edge-preserving regularity and exploits the co-occurrence of spatial gradients in the acquired T1-weighted images by incorporating a multi-contrast Beltrami regularization. This technique corresponds to an extension of the 2D denoising approach proposed in3. 3D SASHA and 2D MOLLI acquisitions were performed in ten healthy subjects on a 1.5T MR scanner (Ingenia, Philips, Best, The Netherlands). Acquisition parameters for 3D SASHA sequence included: FOV=300x300x90mm3, TR/TE=3.2/1.6ms, resolution=1.4x1.4x8mm3, FA=35°, parallel imaging SENSE factor = 2, diaphragmatic navigator motion correction and gating. Acquisition parameters for 2D MOLLI were: FOV=300x280mm2, TR/TE=2.6/1.3ms, resolution=1.7x2.1mm2, slice thickness 10mm, FA=35°. Four patients were acquired using the same 3D SASHA protocol but with a slightly different resolution (resolution=1.6x1.6x8mm3). Late gadolinium enhancement (LGE) imaging was also performed after injection of gadolinium. The proposed 3D denoising technique was applied to the 3D SASHA datasets before pixel-wise T1 three-parameter fitting. A ROI was manually selected in the myocardial septum of 2D MOLLI and 3D SASHA (before and after denoising) T1-maps (apex, mid and base slices) of the healthy subjects and patients to measure the accuracy and precision of the corresponding myocardial T1-values. Precision was compared for the healthy subjects cohort using a Mean-Whitney test.Results
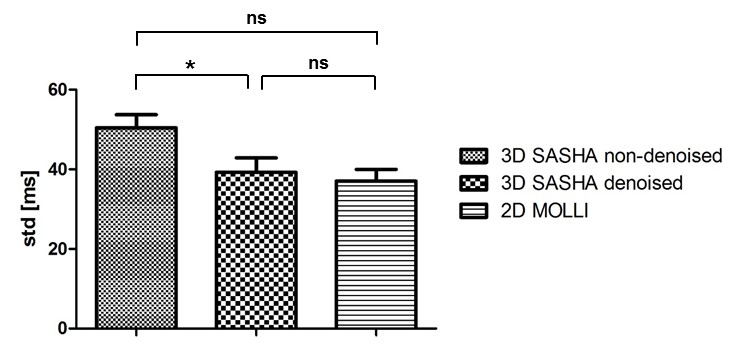
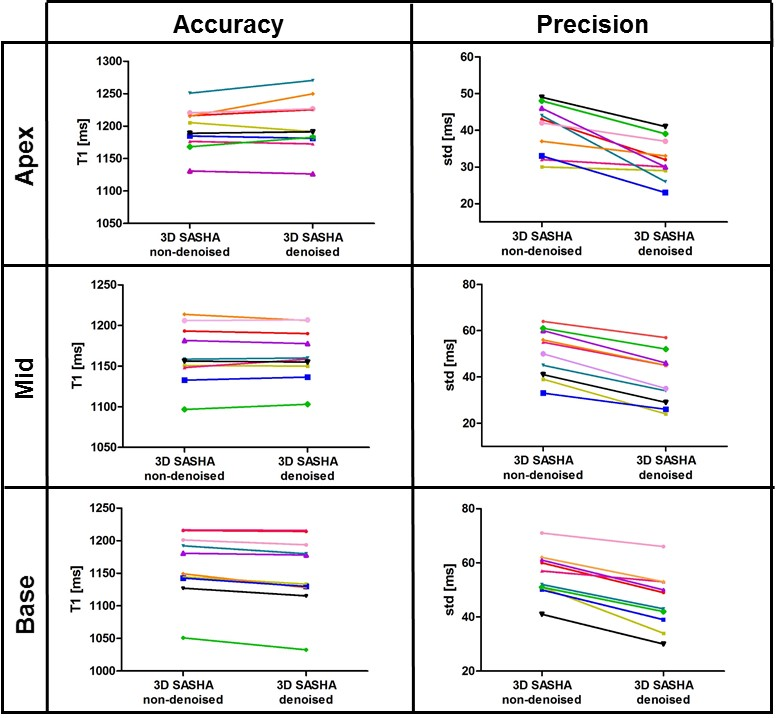
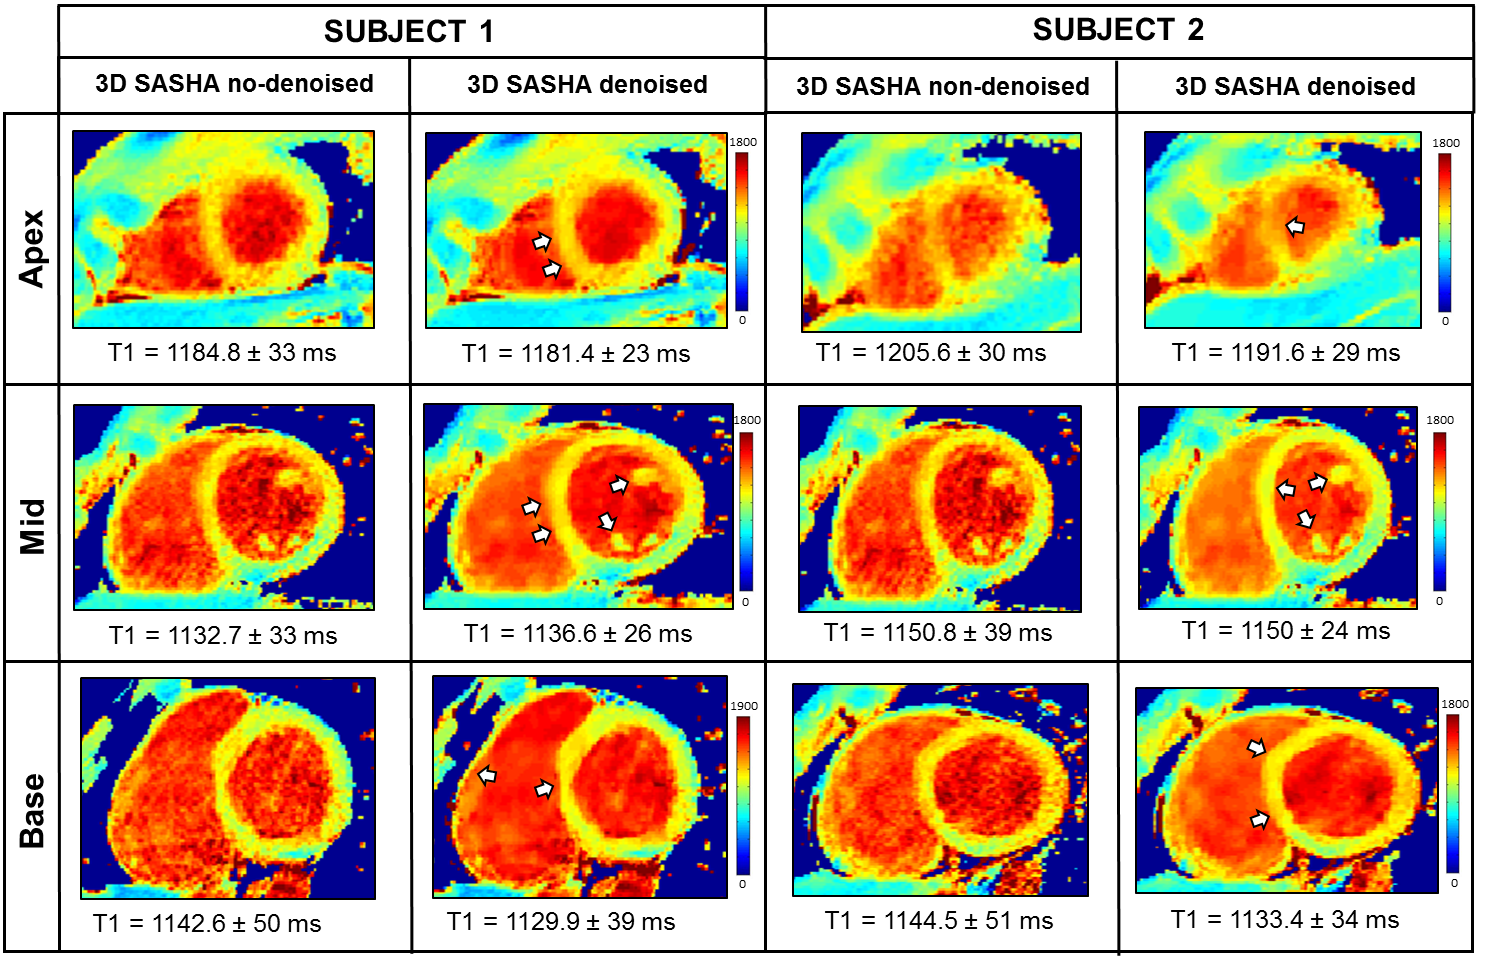
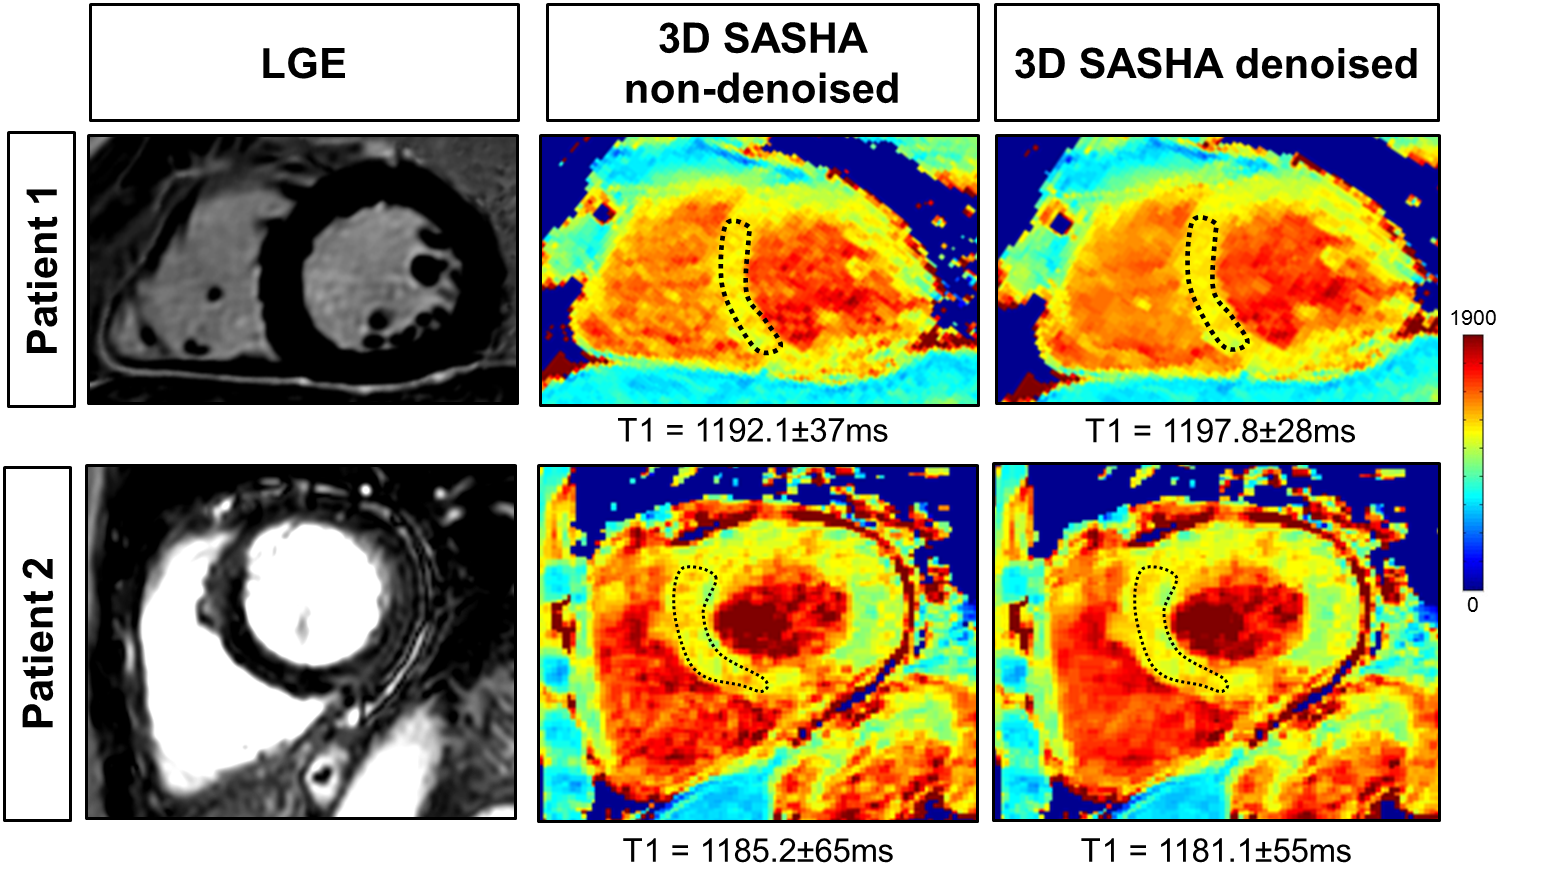
Figure 1 compares the average precision between the ten healthy subjects measured with 2D MOLLI, 3D SASHA before and after denoising. There is a significant improvement in the precision of the 3D SASHA T1 map after denoising (p=0.064). There is a significant difference in precision (p=0.014) between 2D MOLLI and 3D SASHA before denoising. Conversely, the precision measured with 3D SASHA after denoising is comparable to 2D MOLLI (p=0.62). Figure 2 shows the accuracy and precision measured for each healthy subject on three different slices (apex, mid and base) before and after denoising. The accuracy is preserved while the precision improves for all subjects (on average about 20%). After denoising the image quality of the 3D SASHA T1 maps improves, with a better delineation of the myocardium and papillary muscles (Figure 3). Similar results were obtained for the patients. Figure 4 shows the reconstructed 3D SASHA T1 map before and after denoising as well as the associated LGE images for two representative patients. The 3D denoising method permits to improve the precision measured in the selected ROI on the myocardium without affecting the accuracy, while providing a visually better map with sharper edges.Conclusion
We demonstrate the feasibility of combining 3D SASHA T1 mapping with a 3D denoising method to achieve high accuracy and improved precision. Improved precision was measured in the 3D SASHA T1 maps of healthy subjects and patients after denoising. Future work will focus on validating the proposed approach in a larger cohort of patients.Acknowledgements
This work was supported by the EPSRC Centre for Doctoral Training in Medical Imaging (EP/L015226/1), Philips Healthcare, an EPSRC programme and project grant (EP/P001009/1 and EP/P007619/1) and FONDECYT N° 1161051.References
1. Nordio G, et al. 3D myocardial T1 mapping using saturation recovery. Journal of Magnetic Resonance Imaging. 2017;46(1):218-227
2. Messroghli D, et al. Modified look-locker inversion recovery (MOLLI) for high-resolution T1 mapping of the heart. 2004;52:141-146
3. Bustin A, et al. Impact of denoising on precision and accuracy of saturation-recovery-based myocardial T1 mapping. 2017;46(5):1377-1388
Figures