2914
Accelerated 3D saturation-recovery based myocardial T1 mapping using fewer saturation time points and denoising1King's College London, London, United Kingdom, 2Philips Healthcare, London, United Kingdom
Synopsis
In this study we propose to accelerate the 3D saturation-recovery (3D SASHA) T1-mapping technique by using a reduced number of saturation time points while maintaining accuracy and precision using a 3D denoising method. No statistical difference was found in terms of accuracy and precision (respectively p=0.14 and p=0.99) between the T1-maps reconstructed after denoising using different number of T1-weighted images (between three and nine). After application of 3D denoising, the precision was independent of the number of T1-weighted images used for the fitting, which may permit to considerably accelerate the 3D SASHA acquisition.
Introduction
Quantitative myocardial T1 mapping has emerged as a promising non-invasive imaging technique to detect and visualize different cardiomyopathies1. A 3D T1 mapping technique would be preferable to a 2D technique due to ease of planning and as it permits to visualize the whole heart with higher image resolution and signal-to-noise-ratio. Recently a 3D saturation recovery based technique, called 3D SASHA2, has been proposed, which showed comparable accuracy and improved precision as compared to 2D SASHA. A 1D diaphragmatic navigator was used to enable a free-breathing acquisition, however scan time is prolonged due to the low scan efficiency (~40-50%). Here, we propose to accelerate 3D SASHA T1 mapping by reducing the number of T1-weighted images used for the fitting procedure while maintaining accuracy and precision using a 3D denoising method3.Methods
Phantom and in-vivo data from 10 healthy subjects were acquired on a 1.5T MR system (Philips Ingenia, Best, The Netherlands). The T1 phantom contained nine agar/NiCl2 vials, with T1 values ranging from 250ms to 1500msec4. The acquisition parameters for the 3D SASHA sequence included: TR/TE=3.2/1.6; FA=35°; subject specific mid-diastolic trigger delay; image resolution=1.4x1.4x8mm3 and FOV=300x300x90mm3. For respiratory motion compensation a 1D diaphragmatic navigator was used with a gating window of 5mm. Nine T1-weighted images were acquired for both phantom and healthy subjects. The number of images considered for fitting (N) was retrospectively reduced, from N= 9, 8, … to 3 images. A novel 3D denoising method was applied to the T1 weighted images prior to the fitting. The 3D denoising technique imposes edge-preserving regularity and exploits the co-occurrence of spatial gradients in the acquired T1-weighted images by incorporating a multi-contrast Beltrami regularization. This technique corresponds to an extension of the 2D denoising approach proposed by Bustin et al.3 The T1 maps were reconstructed offline with Matlab using a three-parameter fitting model before and after denoising, with the number of T1-weighted images varying between three and nine. For the in-vivo data, accuracy and precision of the T1 values measured in the septum was assessed. A Kruskal-Wallis test was used to compare the accuracy and precision within the non-denoised and denoised T1 maps. A Mann Whitney test was used to compare the precision measured for different number of T1-weighted images.Results
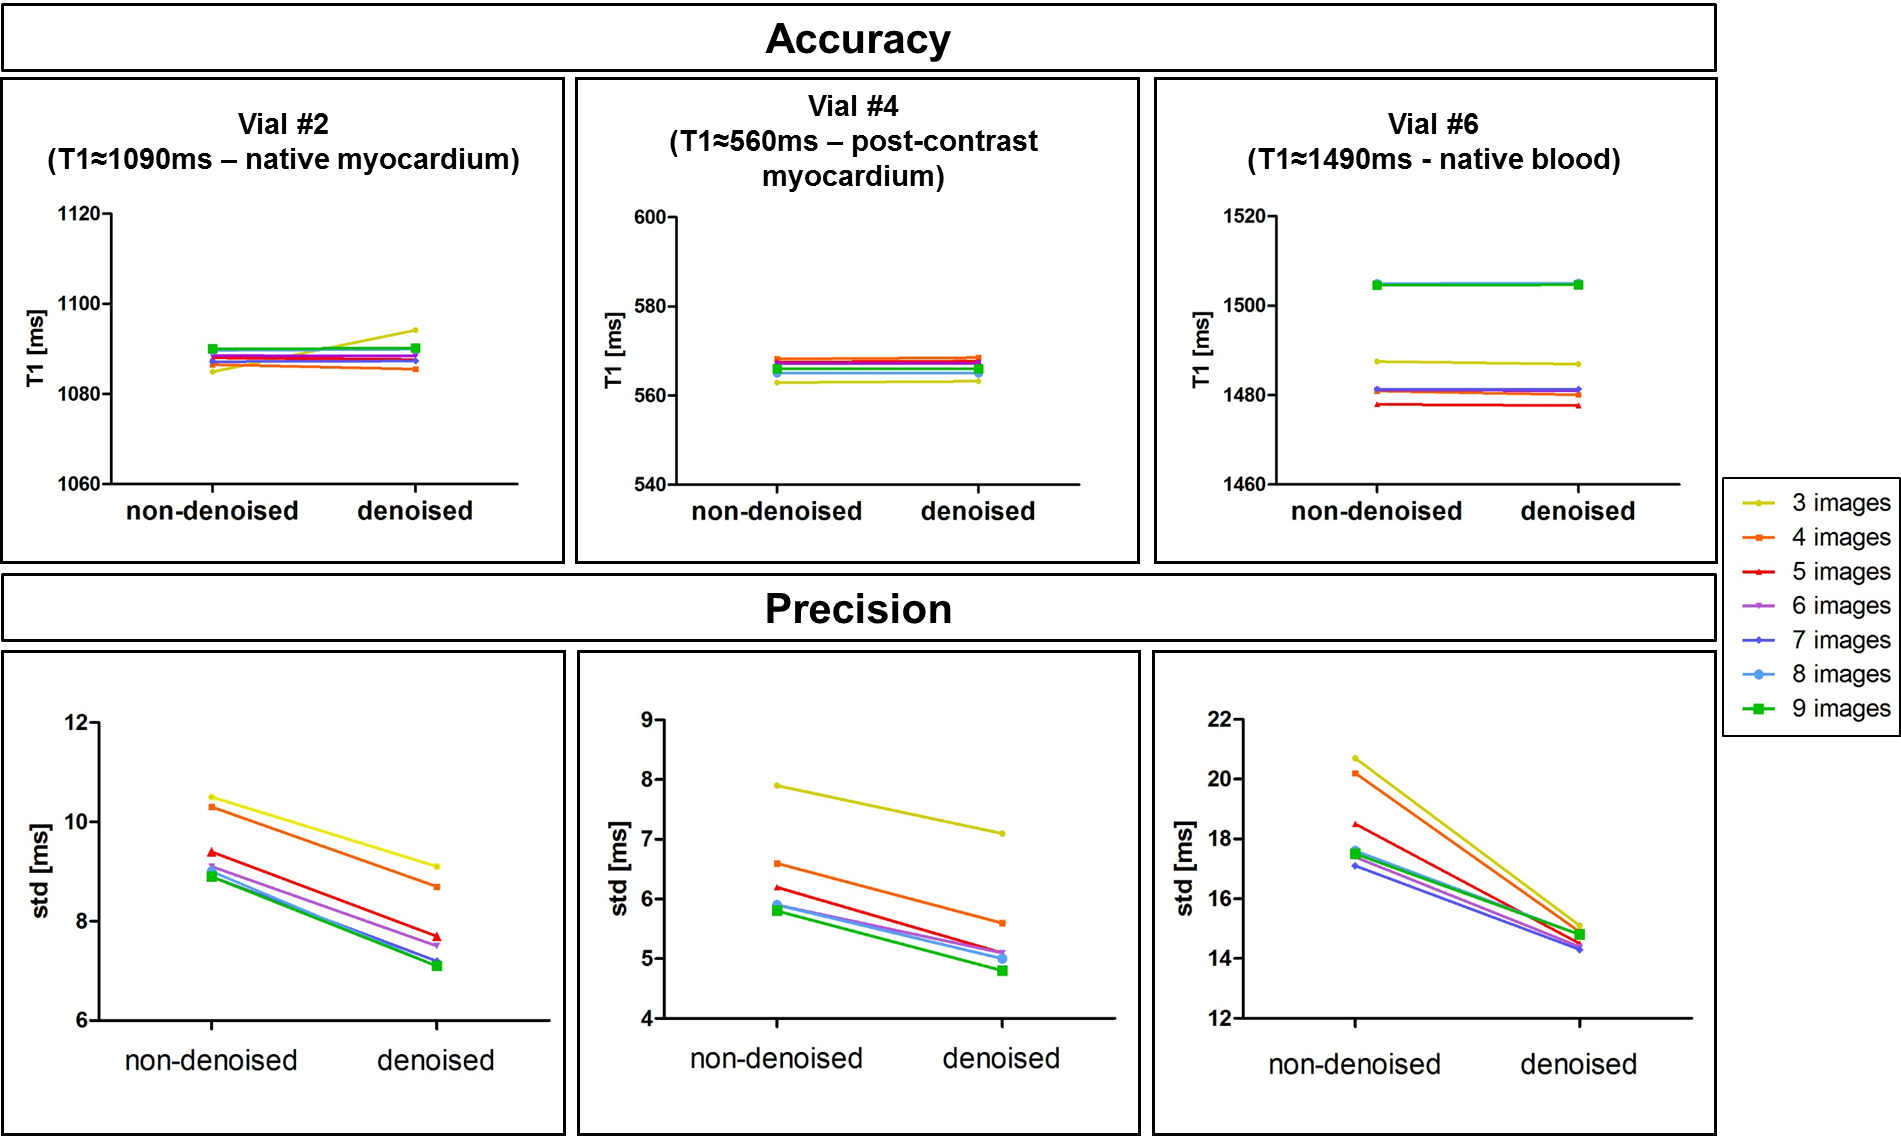
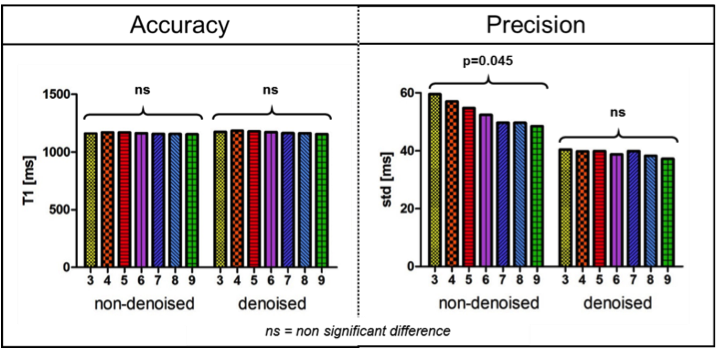
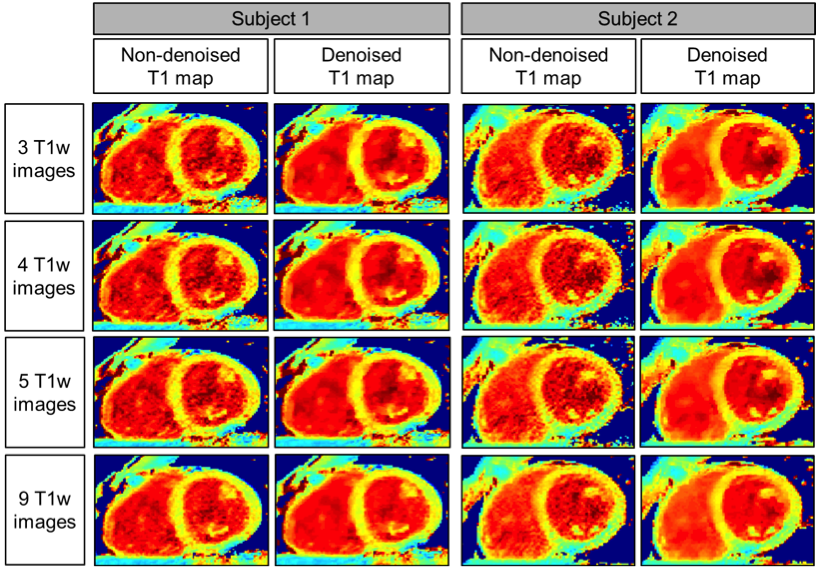
Accuracy and precision before and after denoising for three phantom vials are shown in Figure 1 with T1 similar to post-contrast myocardium (vial #4), healthy native myocardium (vial #2) and native blood (vial #6). There was no statistical difference for the accuracy measured before and after denoising (respectively p=0.99 and p=0.99), while there was an improvement in precision (about 18%) after denoising for any number of T1-weighted images used. In-vivo results show that there was no statistical difference between the accuracy measured on the T1 maps reconstructed with 3 to 9 T1-weighted images, both before and after denoising (respectively p=0.48 and p=0.14) (Figure 2a). There was a statistical difference (p<0.05) between the precision measured on the T1 maps reconstructed with 3 to 9 T1-weighted images before denoising, while there was no significant difference after denoising (p=0.99). The nominal scan time (min:sec) was 4:14 using nine T1-weighted images versus 1:54 that would be needed to acquire only four T1-weighted images. Figure 3 shows the myocardial T1 maps for two representative subjects reconstructed with different numbers of T1-weighted images before and after denoising. Image quality and delineation of the myocardium does not change visually for the different T1 maps after the application of the denoising method.Conclusion
We demonstrate the feasibility of accelerating quantitative 3D SASHA imaging by reducing the number of T1-weighted images. This is achieved by applying a novel 3D denoising algorithm to the T1-weighted images prior to the fitting. Using this approach, the accuracy and precision measured on the T1 maps is independent from the number of T1-weigted images (N >= 3) being used for the fitting.Acknowledgements
This work was supported by the EPSRC Centre for Doctoral Training in Medical Imaging (EP/L015226/1), Philips Healthcare, an EPSRC programme and project Grant (EP/P001009/1 and EP/P007619/1) and FONDECYT N° 1161051.
References
1. Haaf P, et al. Cardiac T1 mapping and extracellular volume (ECV) in clinical practice: a comprehensive review. Journal of Cardiovascular Magnetic Resonance. 2016;18(1):89.
2. Nordio G, et al. 3D myocardial T1 mapping using saturation recovery. Journal of Magnetic Resonance Imaging. 2017;46(1):218-227.
3. Bustin A, et al. Impact of denoising on precision and accuracy of saturation-recovery-based myocardial T1 mapping. 2017;46(5):1377-1388.
4. Captur G, Gatehouse P, Kellman P, et al. A T1 and ECV phantom for global T1 mapping quality assurance: the T1 mapping and ECV standardisation in CMR (T1MES) program. J Cradiovasc Magn Reson 2016;18:1–3.
Figures