2913
Investigating extra-cellular volume fraction in patients with Becker Muscular Dystrophy and Limb Girdle Muscular Dystrophy 2I.1Institute of Genetic Medicine, Newcastle University, Newcastle upon Tyne, United Kingdom, 2Philips Healthcare, Guildford, United Kingdom, 3Newcastle Magnetic Resonance Centre, Newcastle University, Newcastle upon Tyne, United Kingdom
Synopsis
The development of gradual and diffuse myocardial fibrosis is a key pathology in muscular dystrophy and it is possible that extracellular volume (ECV) measurement may be a useful biomarker. Thirteen participants with muscular dystrophy and ten healthy controls were recruited to undergo cardiac MRI, including cardiac tagging, LGE and ECV measurement to determine whether significant global or local differences in ECV could be detected, and their relationship to cardiac dysfunction as indicated by cine imaging and cardiac tagging. Global ECV was not different but there were significant segmental differences between muscular dystrophy and controls.
Introduction
The muscular dystrophies are caused by gene mutations that disrupt structural proteins in skeletal, respiratory and cardiac muscle. Becker muscular dystrophy (BMD) is caused by a deficiency in the dystrophin protein while limb girdle muscular dystrophy type 2I (LGMD2I) is caused by a mutation within the Fukutin-related protein gene (FKRP). Cardiomyopathy is a significant cause of mortality and morbidity in these diseases1. LGE is an adverse prognostic factor for dysfunction, arrhythmia and death. Extra-cellular volume (ECV) measurement is a technique to estimate interstitial space in the myocardium, correlating to fibrosis2,3. ECV has potential to detect and quantify diffuse fibrosis as found in muscular dystrophies and may have potential as an outcome measure in therapeutic trials.
The aim of this study is to compare ECV values in LGMD2I, BMD, and control cohorts and relate them to measures of cardiac dysfunction.
Methods
Thirteen participants with muscular dystrophy (6 LGMD2I, 7 BMD) and ten healthy controls were recruited. A 3T Philips Achieva scanner with a 16-channel torso XL coil was used. A short-axis bTFE cine stack was collected under breath-hold, together with long axis views. Cardiac tagging was performed as described previously4. Cardiac tagging data were not analysable for one patient in each cohort. Pre-contrast T1 map acquisition was performed using a modified Look-Locker (MOLLI) sequence.(TR/TE/TI/FA=2.1ms/0.95ms/350ms/20o, FOV 300x300mm,resolution 2x2mm2 zero-filled to 1.17mm2) at a fixed diastolic cardiac phase with a 5s(3s)3s timing scheme, and three short axis locations (apical, mid-cavity, basal). 10 minutes after 0.2mmol/kg of gadoterate meglumine, a LGE short-axis stack and orthogonal long-axis planes were acquired using a 3D PSIR sequence. Post-contrast T1 map acquisition with MOLLI at 15 minutes used a 4s(1s)3s(1s)2s scheme.
Systolic indices were calculated from the cine imaging. Tagging data was analysed as previously described. Circumferential strain and torsion were analysed throughout the cardiac cycle. LGE and wall motion abnormalities (WMA) were confirmed by an experienced observer. Mean T1 values were obtained using ROI analysis using ImageJ. T1 maps were at three levels: basal, mid cavity, and apical. Each slice was further divided into four segments (modified AHA topographical segments): (Figure 1). ECV values are quoted as regional (based on slice: basal, mid-cavity or apical), segmental, or global (taking all segments in all slices into account).
Results
Figure 2 shows the subject characteristics. ECV results: There were no significant differences in global ECV between controls and either cohort. The highest regional median ECV values were found in the apical region in both LGMD2I (0.25 (0.23-0.30) p=NS) and the BMD groups (0.26 (0.22-0.28) p=0.04). The LGMD2I cohort had significantly higher ECV values in the basal region than the control group (LGMD2I 0.23 (0.22-0.29) vs control 0.22 (0.20-0.26), p=0.04). The highest ECV segmental value in the control group was 0.27 (2/119 segments). In both disease cohorts the highest segmental ECV values (>=0.28) were in the basal posterior segments (3/16). The lateral wall segments more frequently had an ECV of >=0.28 (15/20 segments) than the septal wall. Of the participants with ECV values >=0.28 the majority (6/7) were BMD participants. The data were also divided according to whether subjects had cardiac dysfunction or not (see Figures 3 and 4), where cardiac dysfunction was defined as EF<55%, WMA or positive LGE.
Cardiac dysfunction: Ejection fraction and stroke volumes were lower in the two patient cohorts compared with controls. Left ventricular mass and end systolic volumes were not significantly different between disease and control cohorts. Two participants had evidence of subendcocardial LGE.
Discussion
This reports ECV in LGMD for the first time, as well as the first tagging results in BMD. In a study of ECV in a BMD cohort, Florian et al. reported that ECV rises were highest in the lateral wall segments, these ranged from 0.26-0.35 in the group with cardiac involvement5. Our results suggested that in participants with cardiac dysfunction these segments also had the higher ECV values on average; by comparison a more modest 0.24-0.28. ECV values inversely correlated significantly to torsion in both apical and basal regions. Cardiac tagging is able to demonstrate cardiac dysfunction in the LGMD2I cohort with clear correlation to the EF and ECV values.
Conclusions
The differences in ECV detected were regional rather than global and different regions of abnormality were found in the two muscular dystrophies. The range of ECV in control and muscular dystrophy subjects was wide and overlapping. The small dynamic range and wide variability make it insufficiently sensitive for a longitudinal outcome measure, compared to conventional functional measures. This cohort is relatively early in the disease process, but represents those most likely to be examined in a clinical trial.
Acknowledgements
KGH was supported by the Medical Research Council (G1100160)References
Poppe M, Cree L, Bourke J et al., The phenotype of limb-girdle muscular dystrophy type 2I. Neurology. 2003;60(8):1246-51
Flett AS, Hayward MP, Ashworth MT et al., Equilibrium contrast cardiovascular magnetic resonance for the measurement of diffuse myocardial fibrosis: preliminary validation in humans. Circulation. 2010; 122(2): 138-44.
Miller CA, Naish JH, Bishop P et al., Comprehensive validation of cardiovascular magnetic resonance techniques for the assessment of myocardial extracellular volume. Circulation Cardiovascular imaging. 2013;6(3):373-83.
Hollingsworth KG, Willis TA, Bates MG et al., Subepicardial dysfunction leads to global left ventricular systolic impairment in patients with limb girdle muscular dystrophy 2I. Eur. J. Heart Fail. 2013; 15(9): 986-94.
Florian A, Ludwig A, Rosch S et al., Myocardial fibrosis imaging based on T1-mapping and extracellular volume fraction (ECV) measurement in muscular dystrophy patients: diagnostic value compared with conventional late gadolinium enhancement (LGE) imaging. Eur Heart J Cardiovasc Imaging. 2014;15(9):1004-12.
Figures
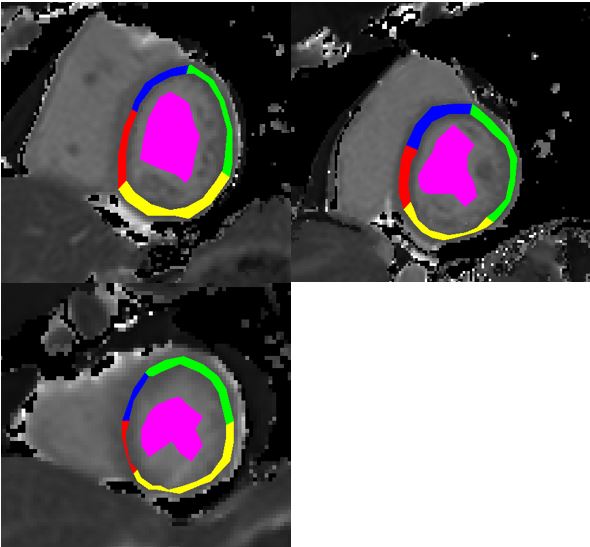
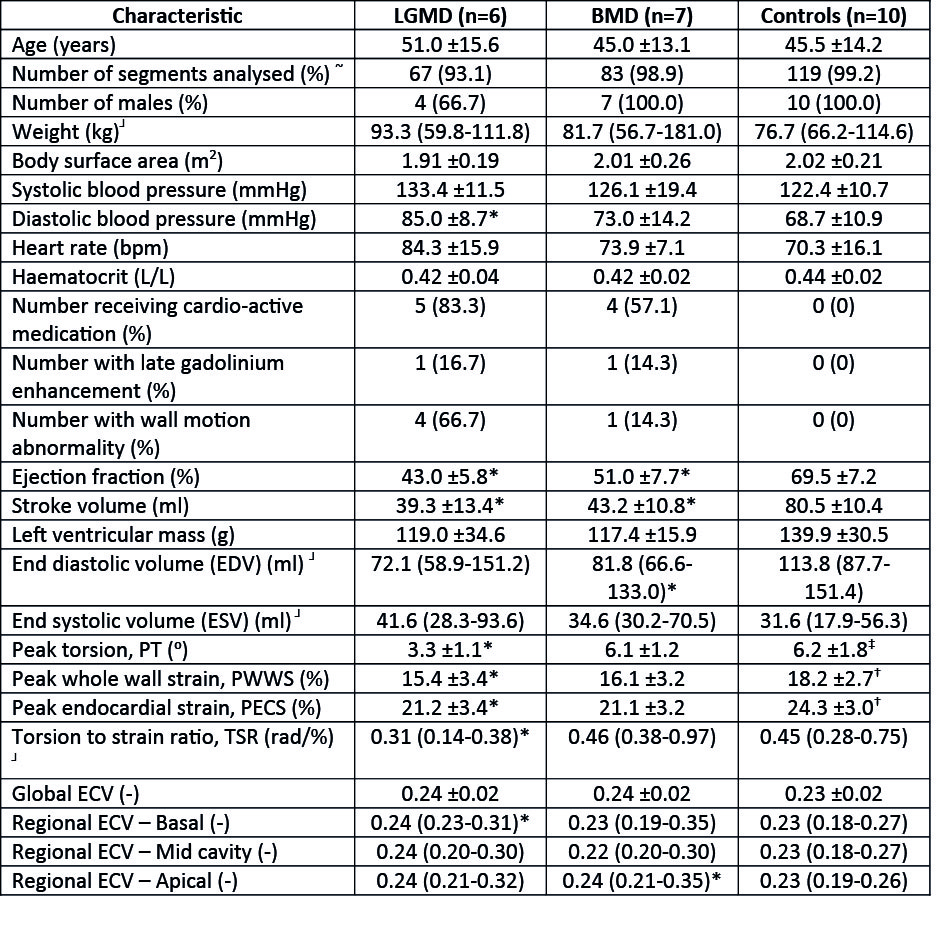
Figure 2. Participant characteristics.
*Significant difference between cohort and controls, p value <0.05.
~ Excluding all segments where image quality was insufficient due to ‘wrap around effects’ or movement artefact (in total n=7).
†(n=9) Due to a parallel imaging artefact the results from one participant was unanalysable and therefore excluded.
‡(n=8) Due to tracking difficulties in one participant it was not possible to get torsion values.
┘non-normally distributed – Mann Whitney U test used to calculate significance. Data is presented as median and range.
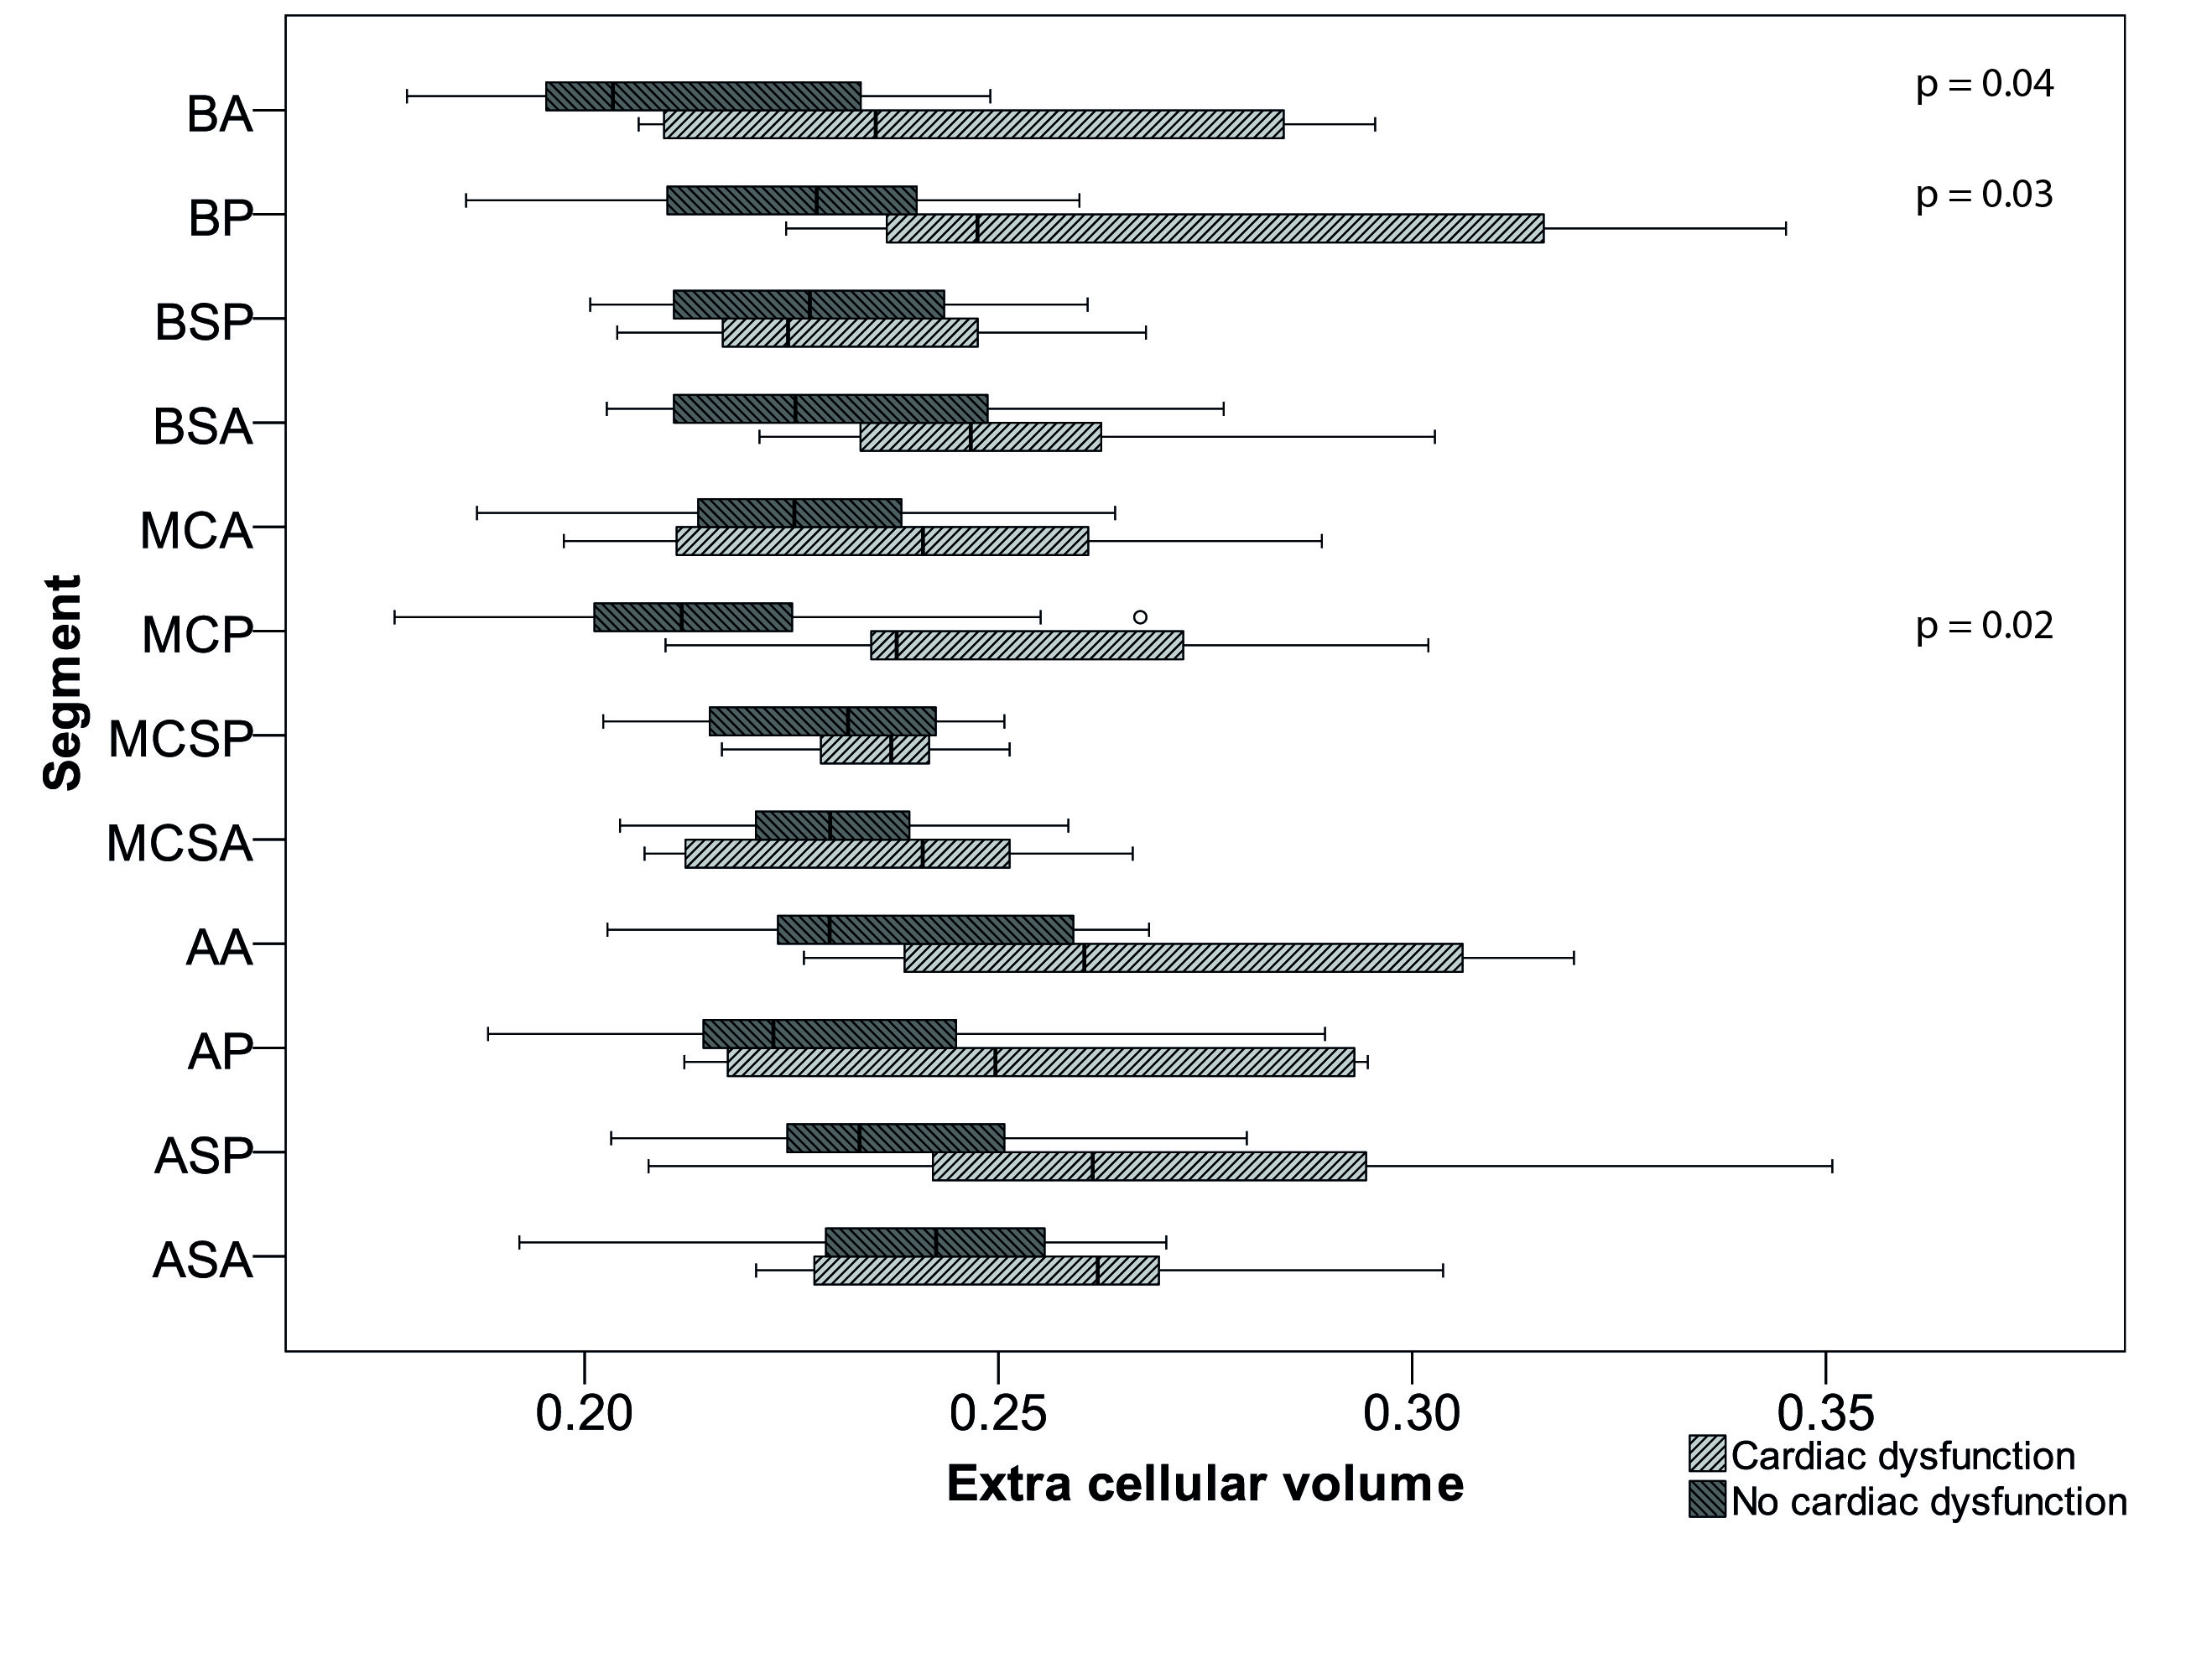
Figure 3. Comparing segmental ECV values in participants with cardiac dysfunction (n=7) to those participants without (including the control cohort) (n=16). Cardiac dysfunction was defined as EF<55%, WMA or positive LGE.
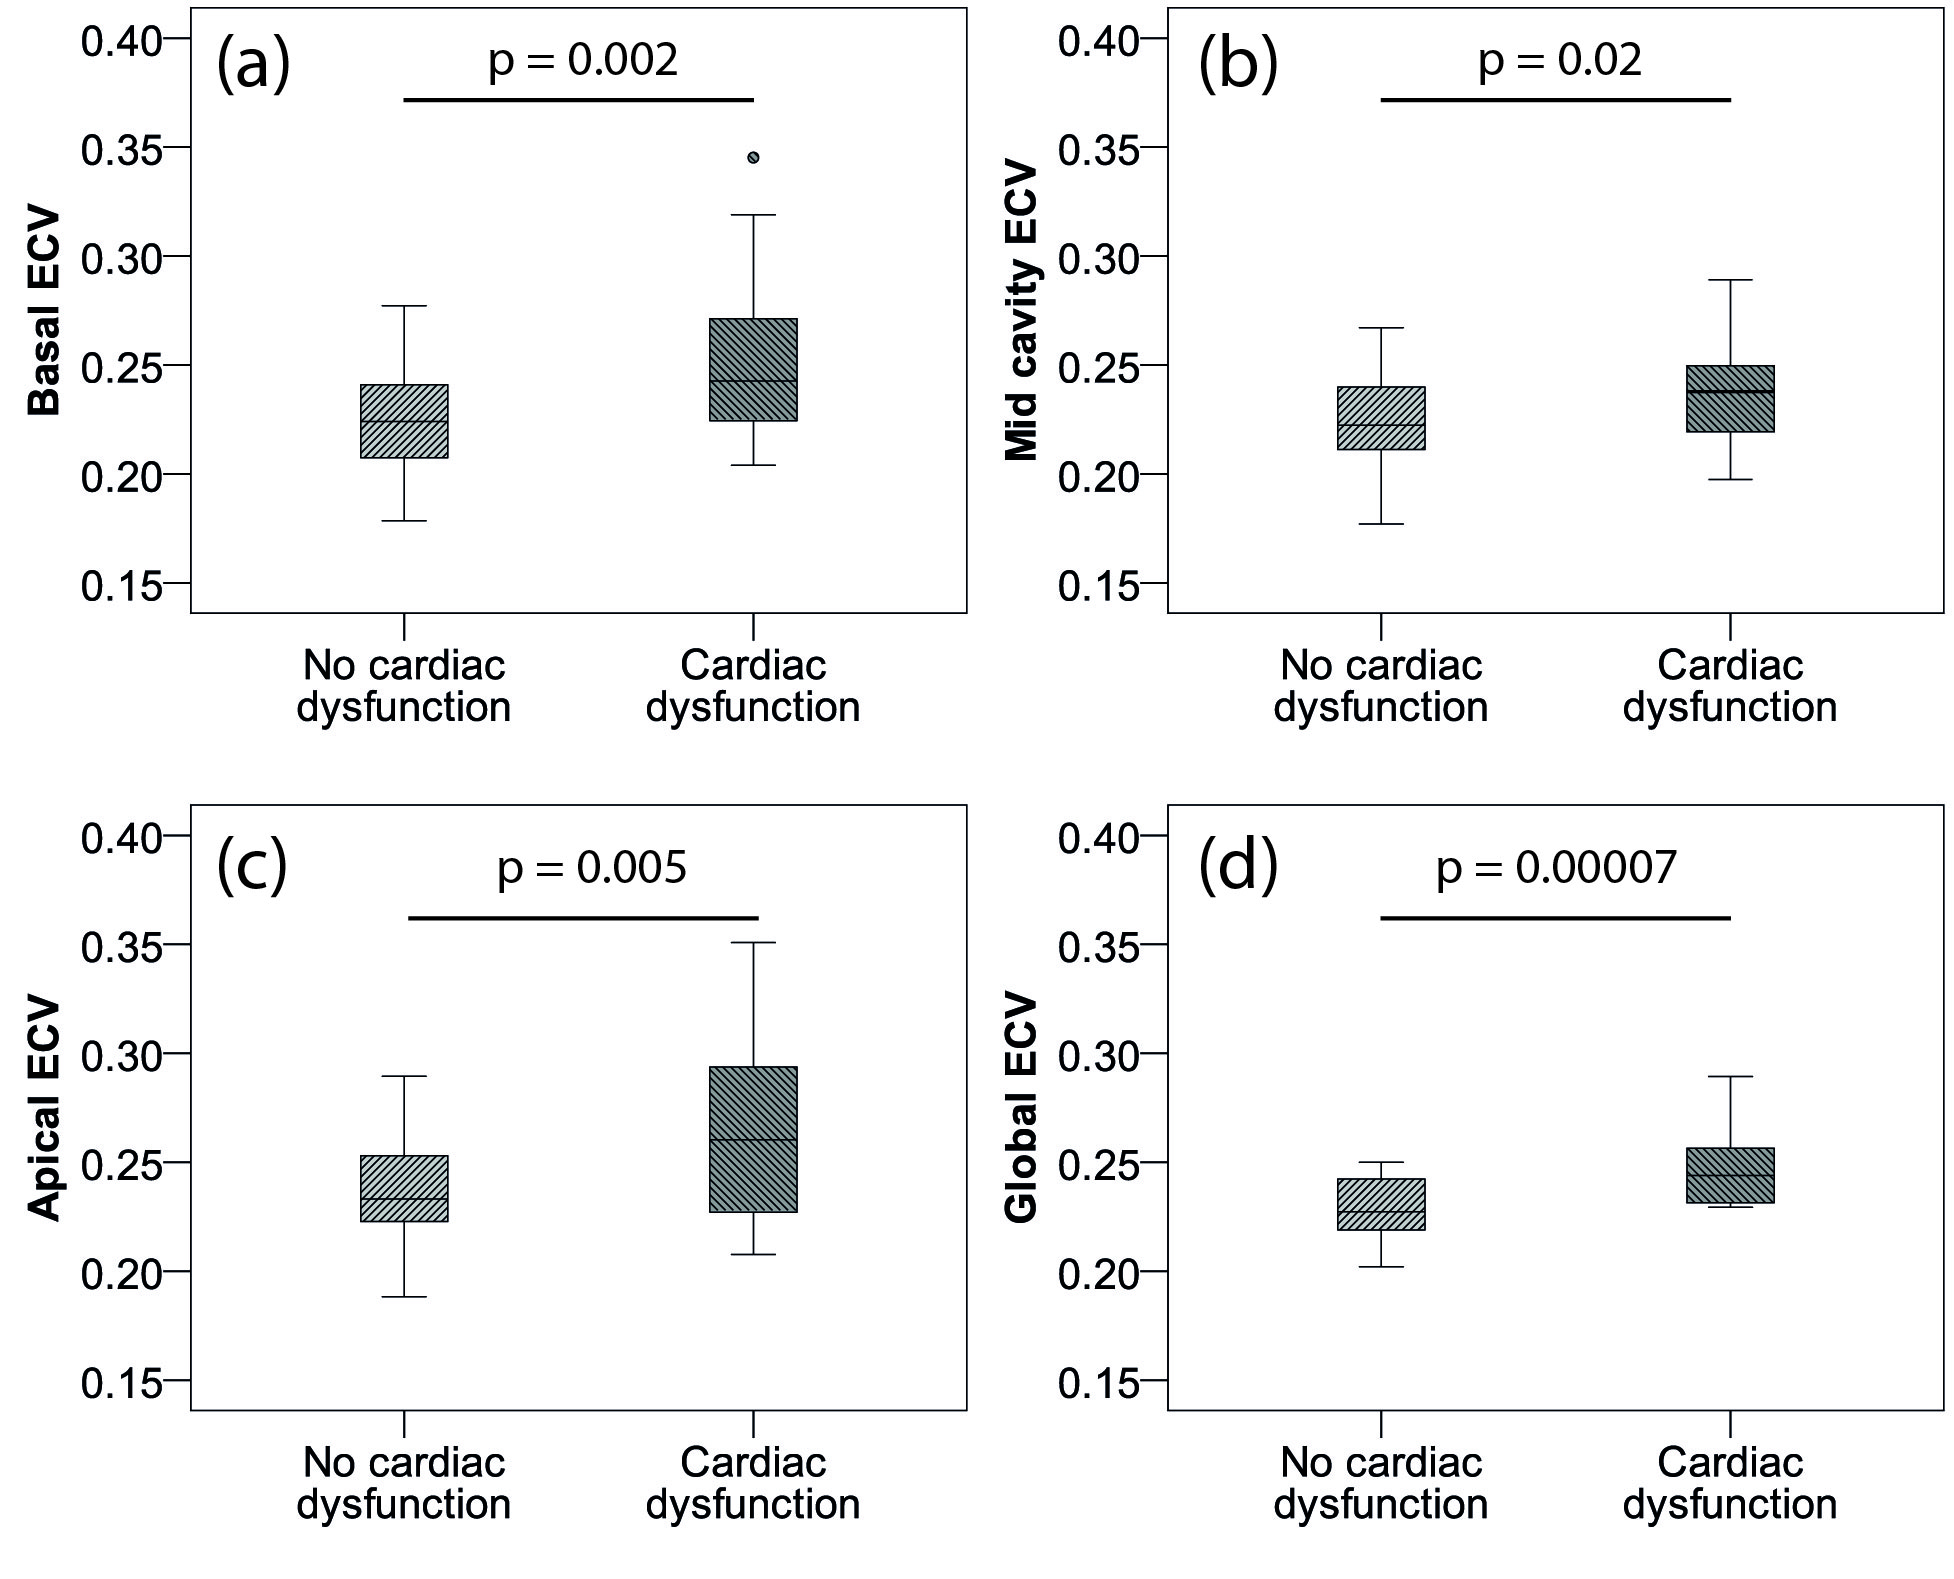
Figure 4. Box and whisker plots to compare ECV between participants with (n=7) and without (n=16) cardiac dysfunction (as defined as an EF<55%, WMA or evidence of LGE). a) Apical ECV, b) Mid cavity ECV, c) Basal ECV, d) Global ECV. P values calculated using Mann-Whitney U test.