2908
Improved T1 and T2 Accuracy for Cardiac MR Fingerprinting Sequences by Including Detailed Modeling of Slice Profile, B1, Inversions, and T2 Preparation Pulses1Biomedical Engineering, Case Western Reserve University, Cleveland, OH, United States, 2Radiology, University Hospitals, Cleveland, OH, United States
Synopsis
Because different cMRF pulse sequences may have different sensitivities to confounding factors, the generation of accurate and precise T1 and T2 maps may require detailed modeling of spin dynamics. This work studies the importance of modeling slice profile, B1, and relaxation during adiabatic inversion and T2 preparation pulses in cMRF. The ISMRM/NIST system phantom was scanned using cMRF sequences with different patterns of flip angles, TRs, and preparation pulses. Modeling these additional effects leads to higher correlation (using linear regression and concordance correlation coefficients) between NIST and cMRF measurements and better consistency between different cMRF sequences.
Introduction
Cardiac MRF (cMRF) provides simultaneous T1, T2, and M0 maps in the heart.1 Theoretically, any cMRF pulse sequence with sufficient T1 and T2 sensitivity should yield equivalent measurements. However, as each pulse sequence may be sensitive to different confounding factors, the generation of consistent and accurate relaxation values may require detailed modeling of spin dynamics. Slice profile and B1 corrections have previously been applied to MRF in the brain and abdomen2–4 but not to cMRF. Repeated adiabatic inversion and T2 preparation pulses are employed in cMRF. Relaxation can occur during these long (>10ms) pulses, which may introduce errors if not taken into account. This work studies the importance of modeling slice profile, B1, and relaxation during preparation pulses in cMRF. These effects are demonstrated using several different sequence designs.Methods
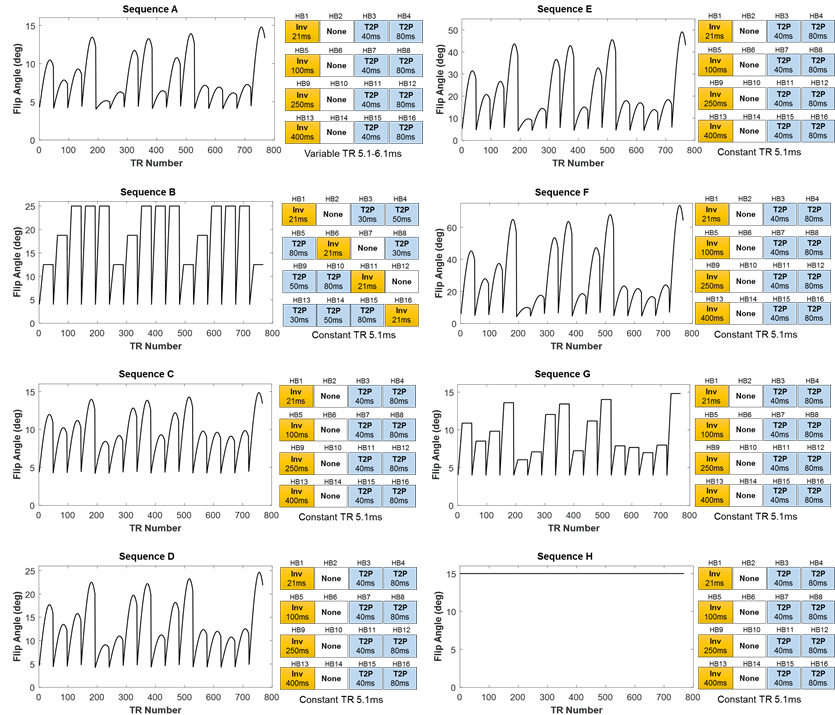
The T2 array of the ISMRM/NIST system phantom5 was scanned at 3T (Siemens Skyra) using an 18-channel head array and a simulated 60bpm heart rate. Maps were acquired using several possible variants of cMRF sequences (Figure 1). Sequences A1 and B6 have previously been published. Sequences C-F use sinusoidally varying flip angles (FA) but reach different maximum values. Sequences C, G, and H have differently shaped FA distributions but reach the same maximum of 15°. Sequences A and C only differ in the use of constant vs. variable TRs. All scan durations were 16 heartbeats with 48 TRs collected every heartbeat after a 600ms trigger delay. Data were acquired with an undersampled spiral trajectory with golden angle rotation (R=48, 192x192 matrix, 300mm2 FOV). After gridding, maps were generated using dot product matching.7 Four types of Bloch equation simulations were performed to generate the dictionaries. (1) Uncorrected: As previously reported1, instantaneous RF rotations were simulated using nominal flip angles. Nominal TIs and TEs were used for preparation pulses. (2) Slice Profile: The RF and slice-select, slice-rephasing, and spoiler gradient waveforms were extracted from the sequence programming environment at 10μs steps. A separate dictionary was simulated for each of 250 spins distributed across twice the nominal slice thickness and complex-summed over all spins to obtain the corrected dictionary. (3) Preparation Pulses: In addition to slice profile, the RF and gradient waveforms for the adiabatic inversions (hyperbolic secant) and T2 preparations (BIR-4 90°) were extracted from the sequence programming environment. A separate dictionary was simulated for each spin before summing over all spins. (4) B1: Along with the previous corrections, B1 was modeled in the dictionary (range 0.07:0.05:1.3) as a scaling factor for the entire FA series. Dictionaries were simulated with T1 10-3000ms and T2 2-800ms. The dictionary size with and without B1 was 52780 and 4060 entries, respectively. Mean T1 and T2 values were calculated within 5x5 ROIs. The concordance correlation coefficients (CCC)8 were calculated between NIST and cMRF T1 and T2. Linear regression was also performed between NIST and cMRF measurements.
Results
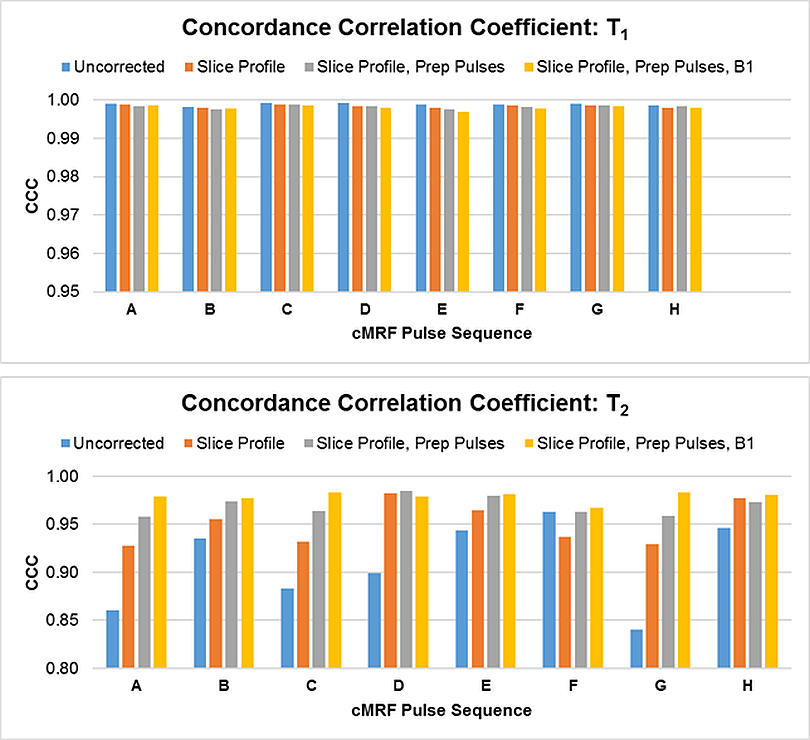
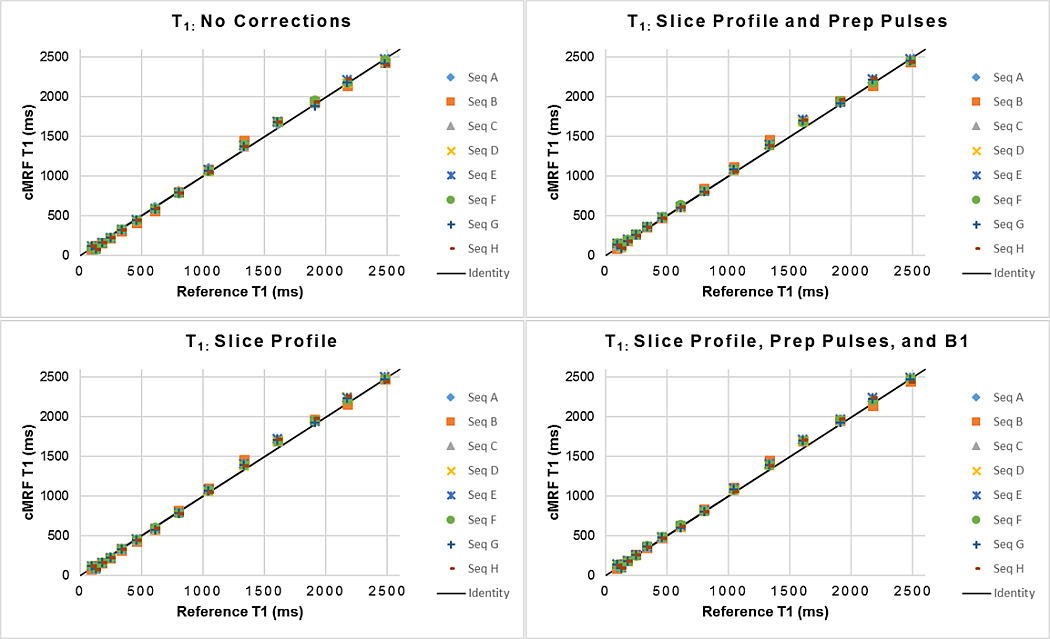
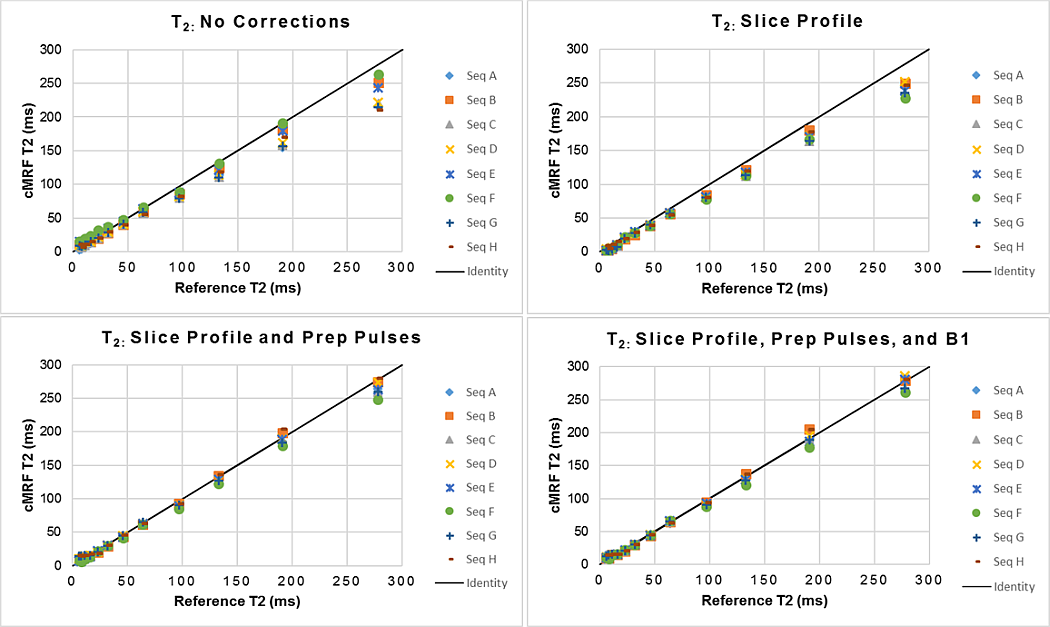
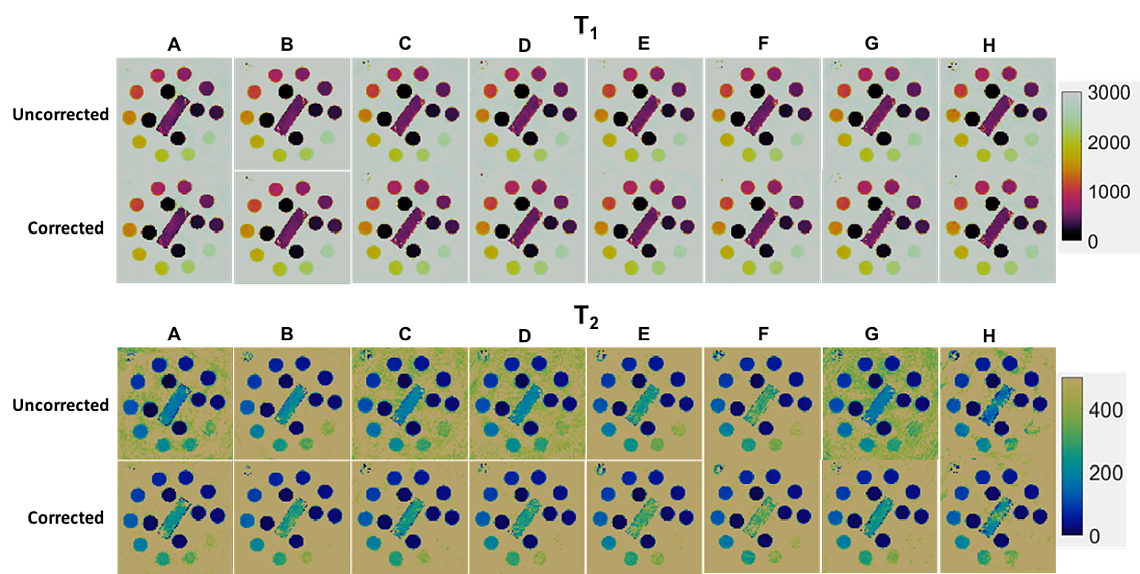
Plots of CCC between NIST and cMRF from different sequences and with different corrections of physical effects are shown in Figure 2. The T1 CCC is above 0.997 regardless of sequence and correction method. For most sequences, the T2 CCC is lowest when no corrections are modeled. The CCC progressively increases as slice profile, preparation pulses, and B1 are modeled. For instance, with sequence A (having variable TRs, sinusoidally varying FA 4-15°, TIs 21-400ms, and T2 prep times 40-80ms), the T2 CCC values are 0.861, 0.928, 0.958, and 0.979 as each correction is added. Figures 3-4 show the mean T1 and T2 within each ROI compared to reference values. Especially for T2, cMRF measurements from different sequences are more consistent with each other and with reference values when all corrections are modeled. The cMRF data have a stronger linear correlation with the reference and slopes closer to 1 after applying corrections. Representative T1 and T2 maps acquired with each sequence design are shown in Figure 5.Discussion and Conclusions
cMRF has the potential to enable accurate and precise T1 and T2 quantification that ideally is independent of pulse sequence design. Modeling slice profile, B1, and relaxation during adiabatic preparation pulses can improve the correlation between cMRF and reference values in the NIST/ISMRM system phantom. Different cMRF sequences were shown to yield comparable measurements after corrections were applied. This analysis may also be useful when comparing the optimality of different cMRF sequences. There are several limitations that should be addressed. The slice profile correction assumes that only one species is present across the slice, which may not be true in vivo. The time needed to generate the uncorrected dictionary is 20s on a standalone PC running MATLAB Mex code compared to 3hr with all corrections. Future work will evaluate these corrections in vivo.Acknowledgements
R01HL094557, R01DK098503, R01EB016728, CBET 1553441, Siemens Healthineers (Erlangen, Germany).
References
- Hamilton JI, Jiang Y, Chen Y, et al. MR fingerprinting for rapid quantification of myocardial T1, T2, and proton spin density. Magn Reson Med 2017;77:1446–1458.
- Buonincontri G, Sawiak SJ. MR fingerprinting with simultaneous B1 estimation. Magn Reson Med 2016;76:1127–1135.
- Buonincontri G, Schulte R, Cosottini M, et al. Spiral MRF at 7T with simultaneous B1 estimation. Magn Reson Med 2017;41:1–6.
- Ma D, Coppo S, Chen Y, et al. Slice profile and B1 corrections in 2D magnetic resonance fingerprinting. Magn Reson Med 2017;78(5):1781-1789.
- Russek SE, Boss M, Jackson EF, et al. Characterization of NIST/ISMRM MRI System Phantom. Proc ISMRM 2012; #2456.
- Pahwa S, Hamilton JI, Adedigba J, et al. Simultaneous T1 and T2 mapping of the myocardium in normal volunteers using Cardiac MR Fingerprinting. Proc ISMRM 2017; #2726.
- Ma D, Gulani V, Seiberlich N, et al. Magnetic resonance fingerprinting. Nature 2013;495:187–192.
- Lin LI. A Concordance Correlation Coefficient to Evaluate Reproducibility. Biometrics 1989;45:255.
Figures