2906
Myocardial T1 Measurement and Relationship with Myocardial T2 and Black Blood T2* at 3.0T MRI for Thalassemia Major Patients1Radiodiagnosis, Picture - This by Jankharia Imaging, Mumbai, India, 2Picture - This by Jankharia Imaging, Mumbai, India
Synopsis
Black blood T2* mapping on 1.5T is currently the gold standard for iron load assessment in patients with iron overload and plays a crucial role in patient management. Inaccuracies in T2* quantification at 3T due to greater artifact levels and higher B0 and B1 inhomogeneities have resulted in a lack of multi-center and multi-vendor validation studies to standardize T2* for iron overload assessment on 3T. In-vivo and In-vitro studies on 1.5T have suggested that T1 and T2 could be potential alternatives to T2*. In this study, we have demonstrated linear relationships for T1 Vs T2*, T2 Vs T2* and T1 Vs T2 at 3T suggesting that T1 or T2 could be potential alternatives to T2*.
INTRODUCTION
T2* mapping is a clinically validated and accepted method for monitoring myocardial iron content at 1.5T(1,2) with T2 mapping being a robust alternative (3) . While a linear relationship between T1, T2 and T2* has been established at 1.5T (4,5) in thalassemic patients, no studies have explored such a relationship at 3T. Exploring such a relationship at 3T is important due to the poor reproducibility of T2*, due to greater B0 and B1 inhomogeneities (6) . The aim of this retrospective study is to evaluate the relationship between T1, T2 and black blood T2* at 3T.MATERIALS AND METHODS
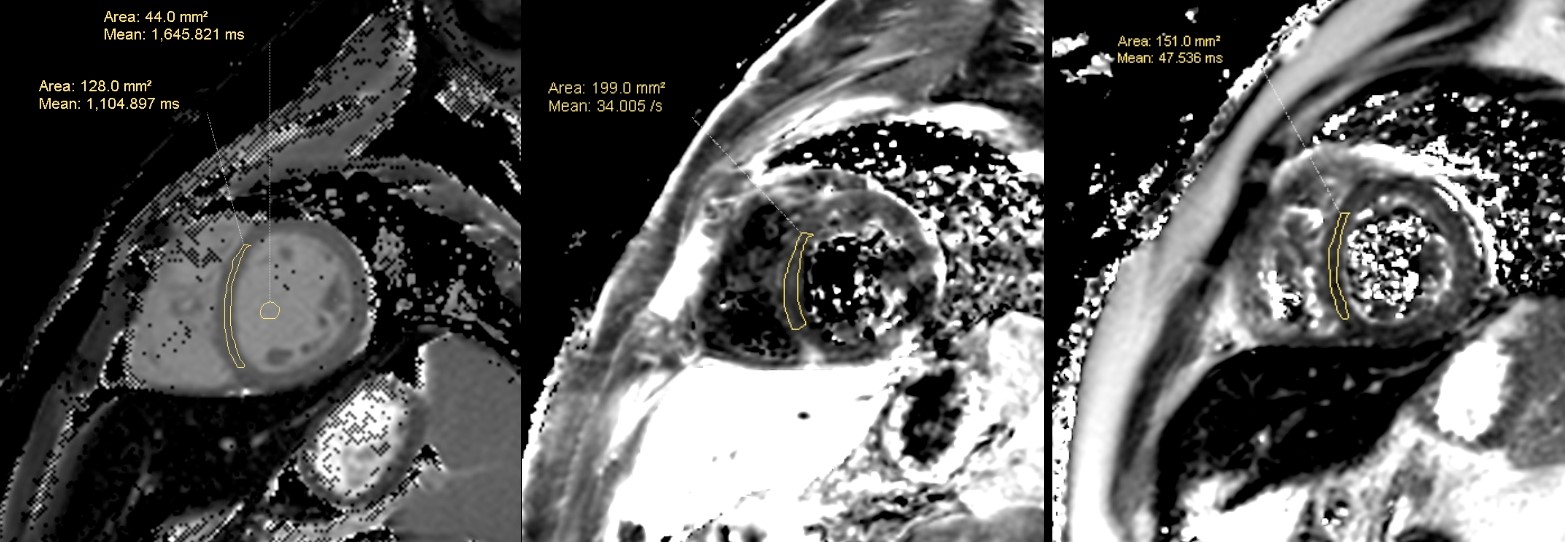
Clinical MRI scan data for myocardial T1, T2 and black blood T2* maps from 102 patients (age 20.5 ± 13.5 years, 56 males and 46 females) was retrospectively obtained for analysis. Patients were scanned on Philips 3.0T MRI scanner (Ingenia, Philips Health Systems, The Netherlands) using a multi-element body coil and were ECG gated. The quantitative cardiac imaging protocol included standard ECG gated, multi-transmit RF enabled single breath-hold Modified Look-Locker Inversion recovery (MOLLI) sequence (5s(3s)3s) for native T1 quantification (FOV: 300mm x 300mm, Matrix: 256 x 256, FA: 20, TE: 1.20, TR: 2.6 and SENSE factor 2), a Double Inversion Recovery(DIR) prepared multi-echo gradient echo black blood sequence for T2* quantification (FOV: 300 mm x 300 mm, Matrix: 288 x 288, FA: 25º, Number of Echoes: 15 [starting TE is 1.43 ms and end TE is 19.21 ms, spacing between echoes is 1.38 ms], TR: 20 ms and SENSE factor 2) and DIR prepared GraSE for T2 quantification (FOV: 300 mm x 300 mm, Matrix: 288 x 288, ETL: 9, [starting TE 9.2 ms – end TE 83.4 ms , and Spacing between echoes is 9.27 ms], TR: 779 ms and SENSE factor 2). T1, T2 and T2* values were measured by manually selecting ROI on cardiac interventricular septum in a single short axis slice (Figure 1). Relation between the parameters was statistically evaluated through linear regression analysis with p-value < 0.05 set as significant.
RESULTS
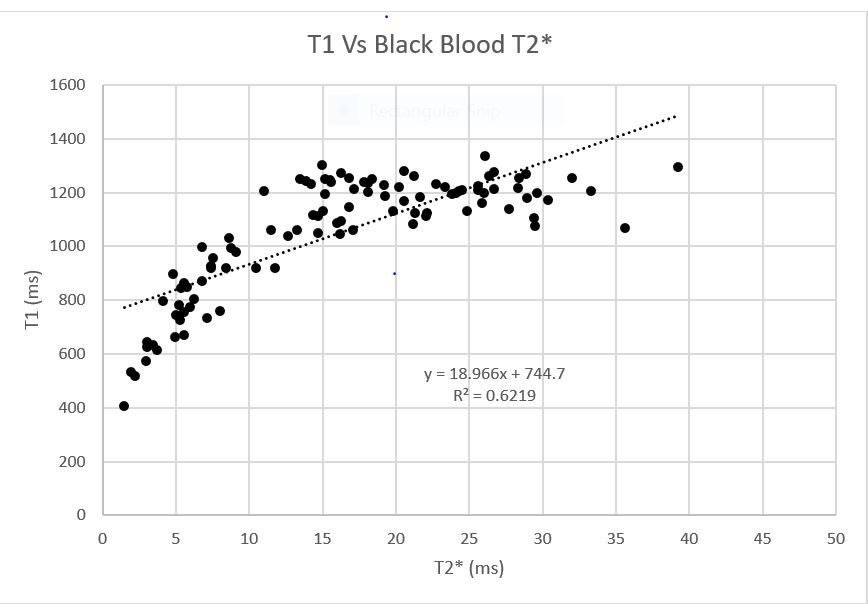
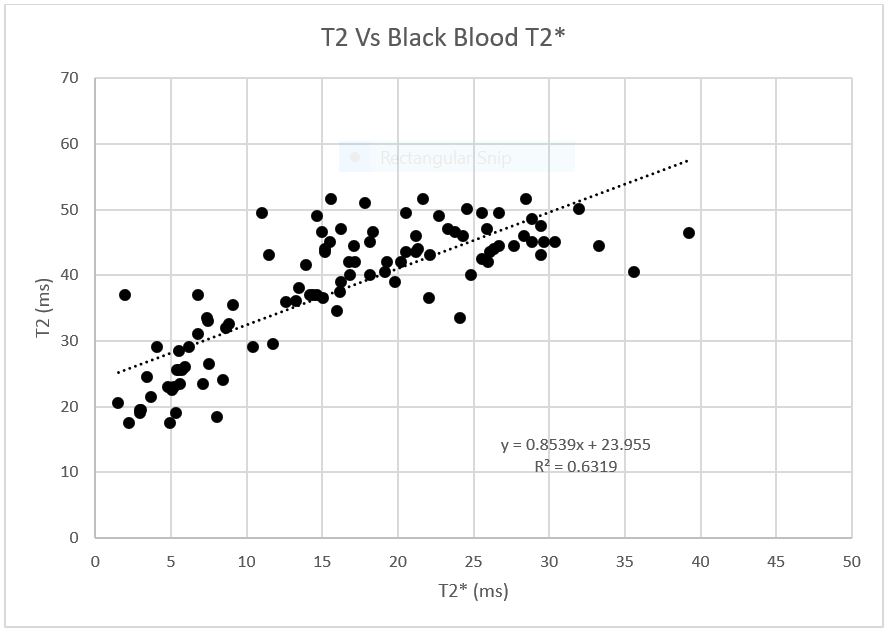
There is a linear correlation between T1 and T2*(r2 = 0.62, p-value < 0.005) (Figure 2), T2 and T2* (r2 = 0.63, p-value < 0.005) (Figure 3) and T1 and T2 (r2 = 0.78, p-value < 0.005) (Figure 4) in thalassemia major patients. The range of observed T1 values is 406.7 ms – 1335.29 ms (range of 928.59 ms), T2 values is 17.51 ms – 51.54 ms (range of 34.03 ms) and T2* is 1.5 ms – 39.23 ms (range of 37.33 ms).32 patients were classified as having abnormal myocardial iron content (10 severe, 12 moderate ,10 mild) and 70 patients were classified as having normal myocardial iron content.DISCUSSION
This is the first work investigating the relationship between T1, T2 and T2* on 3T. The linear relationship between T1 Vs T2*, T2 Vs T2* and T1 Vs T2 suggests that T1 and T2 could be potential alternatives to T2* on 3T.CONCLUSION
In conclusion, this work demonstrates the possibility of using T1 or T2 as potential alternative biomarkers for T2* at 3T for iron load assessment at 3T.Acknowledgements
We would like to thank the team from Philips India Ltd. for providing technical assistance.References
1. Westwood, M. A. et al. Intercentre reproducibility of magnetic resonance T2* measurements of myocardial iron in thalassaemia. Int. J. Cardiovasc. Imaging 21, 531–538 (2005).
2. Westwood, M. A. et al. Interscanner reproducibility of cardiovascular magnetic resonance T2* measurements of tissue iron in thalassemia. J. Magn. Reson. Imaging JMRI 18, 616–620 (2003).
3. He, T. et al. Multi-center transferability of a breath-hold T2 technique for myocardial iron assessment. J. Cardiovasc. Magn. Reson. Off. J. Soc. Cardiovasc. Magn. Reson. 10, 11 (2008).
4. Wood, J. C. et al. Cardiac iron determines cardiac T2*, T2, and T1 in the gerbil model of iron cardiomyopathy. Circulation 112, 535–543 (2005).
5. Feng, Y. et al. In vivo comparison of myocardial T1 with T2 and T2* in thalassaemia major. J. Magn. Reson. Imaging JMRI 38, 588–593 (2013).
6. Alam, M. H. et al. Comparison of 3 T and 1.5 T for T2* magnetic resonance of tissue iron. J. Cardiovasc. Magn. Reson. 18, 40 (2016).
Figures