2903
Fully Automatic SegmenTal analysis of myocardial Relaxometry (FASTR) - Initial results using T1 mappingVenkat Ramanan1,2, Nitishkumar Bhatt1, LaBonny Biswas1,2, Idan Roifman2, Graham Wright1,2,3, and Nilesh Ghugre1,2,3
1Physical Sciences Platform, Sunnybrook Research Institute, Toronto, ON, Canada, 2Schulich Heart Program, Sunnybrook Research Institute, Toronto, ON, Canada, 3Department of Medical Biophysics, University of Toronto, Toronto, ON, Canada
Synopsis
Relaxometric techniques, particularly T1 mapping, have gained clinical importance recently. T1 and ECV are usually calculated by manually drawing contours on the maps. This is laborious particularly for large volume studies. Here we present a fully automated framework (FASTR) for segmental analysis of T1 maps (both native and post-contrast) and partition-coefficient values. Since CINE images are usually always acquired in the studies, we use CINE derived epi/endocardial contours and make further adjustments on T1 maps. This results in more accurate and robust segmentation of the myocardial wall, which works even in the presence of edema, infarct and minor artifacts.
Introduction
T1 mapping and other relaxometry techniques such as T2, T2* have gained clinical importance in the characterization of myocardial response in various cardiomyopathies [1]. Recently, T1 mapping has been widely employed to investigate regional variations in T1 and ECV values to differentiate healthy and diseased state (eg. myocardial infarction, fibrosis, diabetes) [1,2,3]. To calculate T1 and ECV segment-wise, the endocardial and epicardial boundaries are usually drawn manually which can be laborious, particularly for high volume patient studies. Here we present a fully automated framework (FASTR) to calculate relaxometry values accurately and display them using the standard AHA model. Initial results are shown using both native and post-contrast T1 maps acquired using the MOLLI sequence and finally display the partition coefficient in each AHA segment.Methods
FASTR design: Figure 1 depicts the flowchart of our algorithm. We start with a standard MOLLI T1 mapping reconstruction using MOCO registration [4]. The closest CINE SSFP image in both slice-location and temporal-phase is then selected and coregistered with the MOLLI images to correct for both scaling (field-of-view) and translation/rotation using rigid-registration. The selected CINE SSFP image is then processed for automatic detection of endocardial and epicardial contours based on a previously published technique [5]. This method first computes a centroid and computes the contours by edge detection and smoothes them using a roundness metric. These contours serve as the initial guess for myocardial segmentation in the T1 maps. The resulting contours are then transferred to the MOLLI derived T1 map for further adjustments - translation and scaling. Firstly, the contour points are also translated to the closest border point (edge) by applying an edge detection filter to exclude partial voluming from blood. Secondly, the points are further shifted inwards into the mid-myocardial wall (25% of the wall thickness) to completely avoid the LV and RV blood pools and lung interface. These corrected contours are used for generating a 16 segment AHA model. For calculation of blood T1, the endocardial contour is scaled down to enclose only a uniform region of blood.The above process is repeated for both native and post-contrast MOLLI images to arrive at the segment-wise partition coefficient. Partition coefficient (λ) was estimated from the standard relation: $$$(1/T1myo,post-1/T1myo,pre)/(1/T1blood,post-1/T1blood,pre)$$$. Experimental Study: Pigs were imaged on a 3T scanner (GE MR750) in healthy state (N=3) and at week 1 (N=2) following acute myocardial infarction (AMI). AMI was induced using a 90 min LAD occlusion-reperfusion model. CINE SSFP imaging was performed to acquire 10-12 short axis images. Native T1 values were quantified in three short-axis slices (basal, mid and apical) using a Modified Look-Locker T1 Imaging (MOLLI) sequence; 3-5 pattern with 7 pausing heart-beats acquiring 8 images in 15 heart-beats; in-plane resolution = 1.75 mm, slice thickness = 5 mm. Infarction was assessed using late gadolinium enhancement imaging (LGE). Post-contrast T1 mapping was performed at 15 min post contrast injection.Results
Figure 2 shows the calculated contours from a healthy animal. Accurate contouring is observed on CINE and native T1maps after adjustments. Unadjusted contours, directly transferred from those CINE images, are seen to be inaccurate and in many cases needed further adjustments. Since we are interested only in the LV mid-myocardium and blood values of T1, these adjustments significantly improve the accuracy of contouring.Figure 3 shows results from an infarct model (1 week post-infarct). The infarct is confirmed from an LGE image. Contouring seems to work well for both native and post-contrast T1maps, even in the presence of an artifact in the inferior wall.Since the method is not optimized for speed currently, it takes about 13 seconds to process a sliceDiscussion
Our method works fully automatically without manual intervention to generate accurate AHA segment-wise native, post-contrast T1 maps and display the partition-coefficient and ECV. This is particularly appealing for large-scale studies where manual contouring can be completely avoided. Patients who undergo a T1 mapping study almost always undergo a functional assessment using a standard CINE bSSFP technique. This is the case even with larger studies such as the UK BioBank. Since our method relies on contours generated from CINE as a starting point, it is more robust than processing just on MOLLI images. However, any gross failure in CINE contour generation would also affect this method.Conclusions
Here we have presented a method to automatically reconstruct and display segment-wise relaxometric parameters using CINE derived contours. Initial results for T1 mapping are shown. To validate this technique further, it needs to be tested on larger studies. The technique can also be used for other relaxometric techniques, such as T2 and T2*, though this needs to be investigated.Acknowledgements
We would like to acknowledge funding support from the Ontario Research Fund (ORF-RE7)References
- Messroghli DR, Moon JC, Ferreira VM, et al. Clinical recommendations for cardiovascular magnetic resonance mapping of T1, T2, T2* and extracellular volume: A consensus statement by the Society for Cardiovascular Magnetic Resonance (SCMR) endorsed by the European Association for Cardiovascular Imaging (EACVI). J. Cardiovasc. Magn. Reson. Off. J. Soc. Cardiovasc. Magn. Reson. 2017;19:75. doi: 10.1186/s12968-017-0389-8.
- Cheng H-LM, Stikov N, Ghugre NR, Wright GA. Practical medical applications of quantitative MR relaxometry. J Magn Reson Imaging 2012;36:805–824. doi: 10.1002/jmri.23718.
- Levelt E, Piechnik SK, Liu A, et al. Adenosine stress CMR T1-mapping detects early microvascular dysfunction in patients with type 2 diabetes mellitus without obstructive coronary artery disease. J. Cardiovasc. Magn. Reson. Off. J. Soc. Cardiovasc. Magn. Reson. 2017;19:81. doi: 10.1186/s12968-017-0397-8.
- Xue H, Shah S, Greiser A, Guetter C, Littmann A, Jolly M-P, Arai AE, Zuehlsdorff S, Guehring J, Kellman P. Motion correction for myocardial T1 mapping using image registration with synthetic image estimation. Magn. Reson. Med. 2012;67:1644–1655. doi: 10.1002/mrm.23153
- Lu Y, Radau P, Connelly K, Dick A, Wright GA. Segmentation of Left Ventricle in Cardiac Cine MRI: An Automatic Image-Driven Method. In: Functional Imaging and Modeling of the Heart. Lecture Notes in Computer Science. Springer, Berlin, Heidelberg; 2009. pp. 339–347
Figures
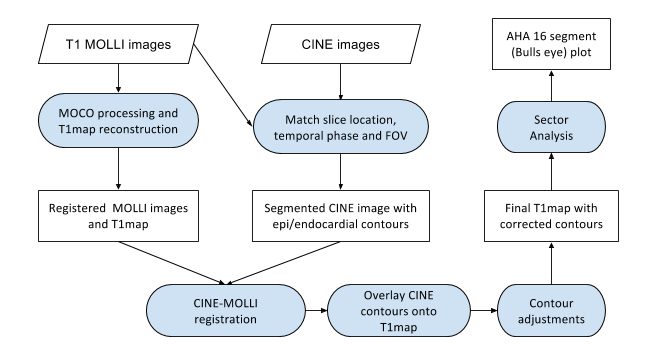
Flowchart representing the algorithm. The principal idea here is to use the CINE images for accurate and robust contouring. We then use those contours as a starting point to further adjust them over T1 maps
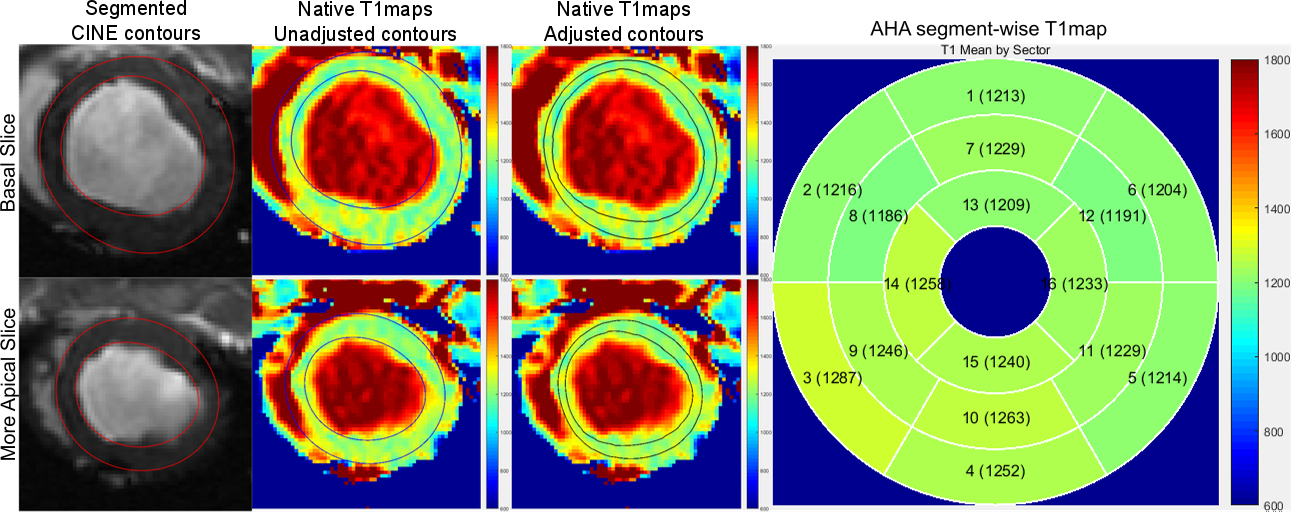
Results for two slices, one basal and another more apical, from a healthy animal are shown. The first column shows the segmented contours from CINE slices using a previously published algorithm. The second column shows the transferred, unadjusted contours onto the native T1map. The third column shows the final contours after further adjustments. The last column shows the 16-segment AHA model and T1map values by sector.
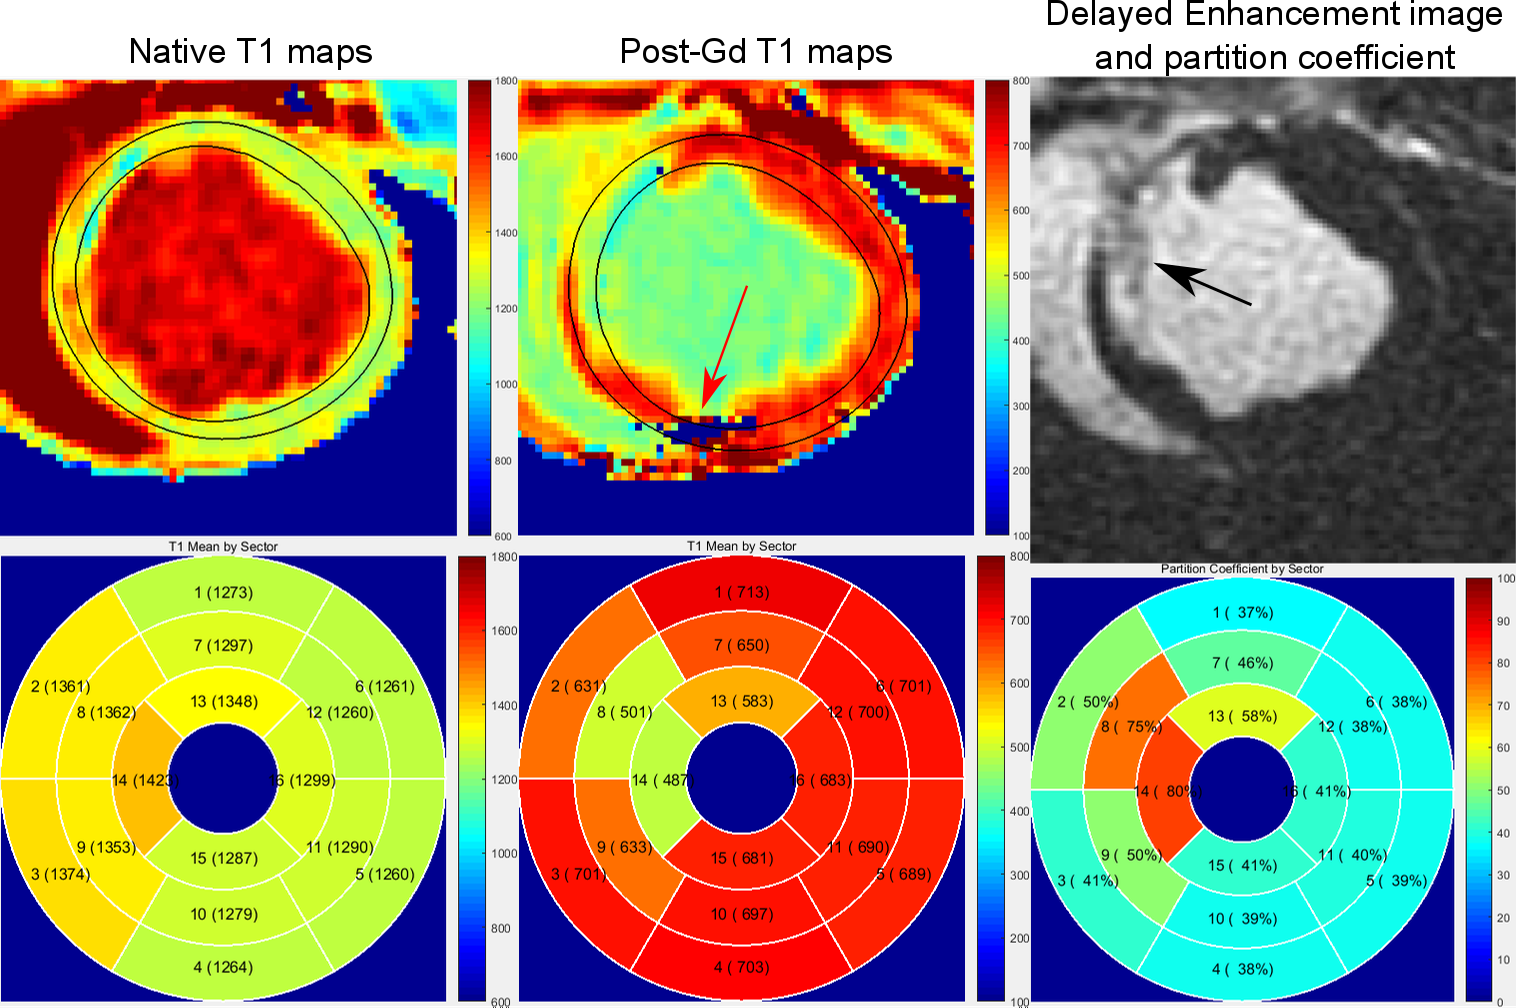
Results from an infarct model (1 week post-infarct) are shown. First row: Final contours from native and post-contrast T1 maps show that robust contouring is achieved even in the presence of infarcts and T1map reconstruction artifacts (red arrow). The LGE image shows the extent of infarct in the septal region (black arrow). Second row: The AHA segment-wise plots display the native-T1 maps, post-contrast T1 maps and the partition coefficient respectively. Significant changes in T1 and partition coefficient values are seen in the infarct area.