2900
Cardiac relaxometry in childhood acute lymphoblastic leukemia survivors.1Mechanical Engineering, Polytechnique Montreal, Montreal, QC, Canada, 2Computing and software engineering, Polytechnique Montreal, Montreal, QC, Canada, 3Research Center, Montreal Heart Institute, Montreal, QC, Canada, 4Research Center, CHU Sainte-Justine, Montreal, QC, Canada, 5Kinesiology, University of Montreal, Montreal, QC, Canada
Synopsis
The aim of this study was to evaluate T1 pre- and post-gadolinium enhancement and T2 relaxation times sensitivity to detect myocardial changes induced by doxorubicin-based chemotherapy in childhood acute lymphoblastic leukemia survivors. Myocardial changes such as increased fibrosis index and injury due to associated changes in myocardial free water content were found between risk groups of cancer survivors, suggesting T2, post-gadolinium T1 and particularly the partition coefficient as early indices for myocardial tissue damages in the onset of doxorubicin-induced cardiotoxicity. These computing tools will be pivotal in patient follow-up to anticipate pathology evolution.
Introduction
The use of T1 and T2 relaxation times allows detection of multiple tissue damages, based on hydrogen proton spin relaxation in different tissues. Within the heart, T1 is used to detect the presence of diffuse fibrosis while T2 is used to detect cardiac ischemia [1-3]. Contrast enhanced T1 imaging is one of the most expected to early detect doxorubicin-induced cardiotoxicity [4,5]. Reported changes with cardiotoxicity include the induction of reactive oxygen species, cellular apoptosis, diffuse fibrosis, premature ventricular contraction, extracellular matrix disorganization and other dose-dependent cardiomyopathies that may affect the cardiac function. The aim of this study was to evaluate T1 pre- and post-gadolinium enhancement and T2 relaxation times sensitivity to detect myocardial changes induced by doxorubicin-based chemotherapy in childhood acute lymphoblastic leukemia (cALL) survivors.Methods
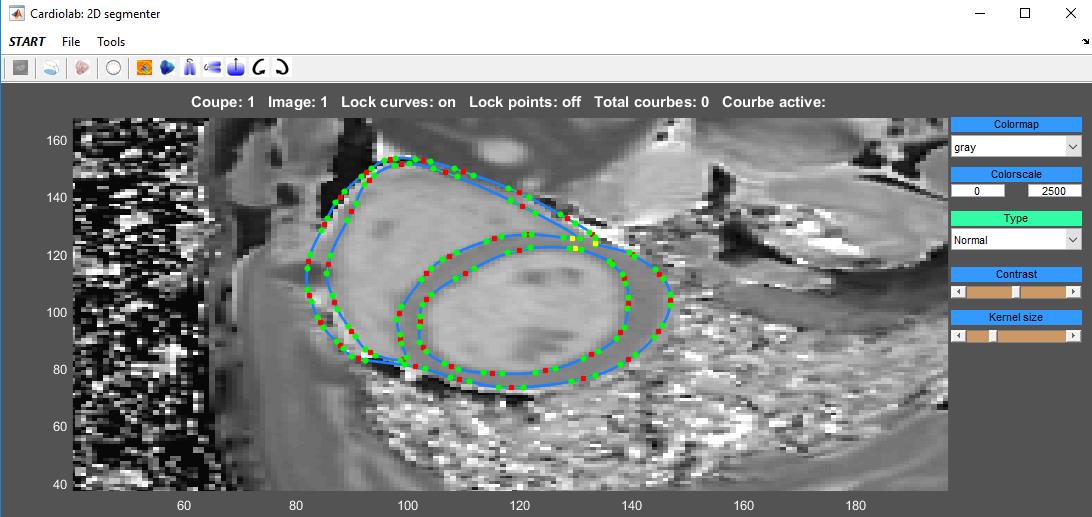
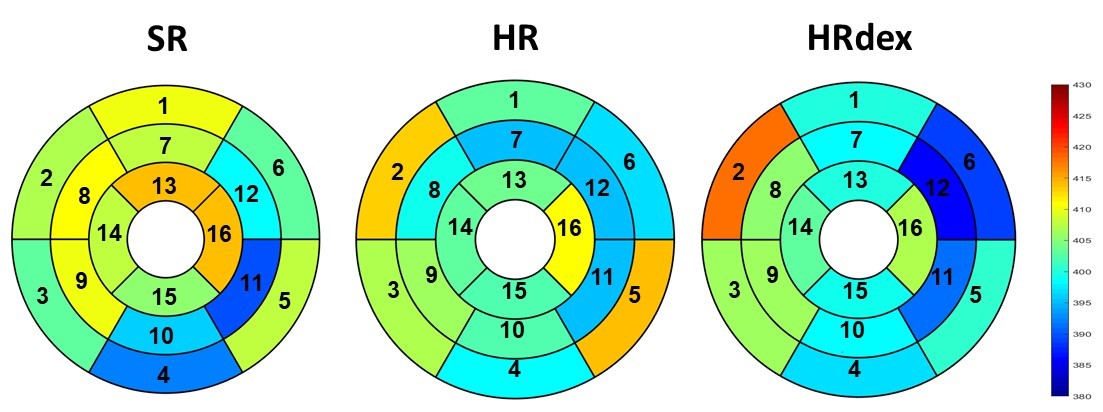
Eighty-nine cALL survivors (23±7 years old) were prospectively included Three groups were defined according to their prognostic risk: standard risk (SR, n=22), high risk (HR, n=30) and high risk group who received a cardioprotective agent (HRdex, n=37). Healthy subjects (n=10, 26±4 years old) were also included. The CMR acquisitions were performed on a Siemens Skyra 3T MR system using a 18-channel phased array body matrix coil and included a MOLLI sequence for T1 mapping and a T2-prepared TrueFISP sequence for T2 mapping (pixel resolution 1.4mmx1.4mmx8.0mm ) at apical, mid-ventricular and basal levels. Post-gadolinium T1 was acquired on cALL survivors only using Gadovist at 10-15 min post injection. Myocardial contours were semi-automatically segmented using an interactive implementation of cubic Bezier curves (Figure 1). The T1 maps were generated using phase sensitive inversion recovery fitting using a three parameter signal model with motion correction. Pixel-wise myocardial T2-maps were generated using unsupervised curve-fitting based on a two-parameter equation with motion correction. We also evaluated the partition coefficient (λ) of gadolinium. Statistical comparison was done using a one-way analysis of variance on the mean relaxation times for each myocardial segment to compare the different groups of volunteers and a two-way analysis of variance for repeated measure to analyze the interactions between segments and groups.Results
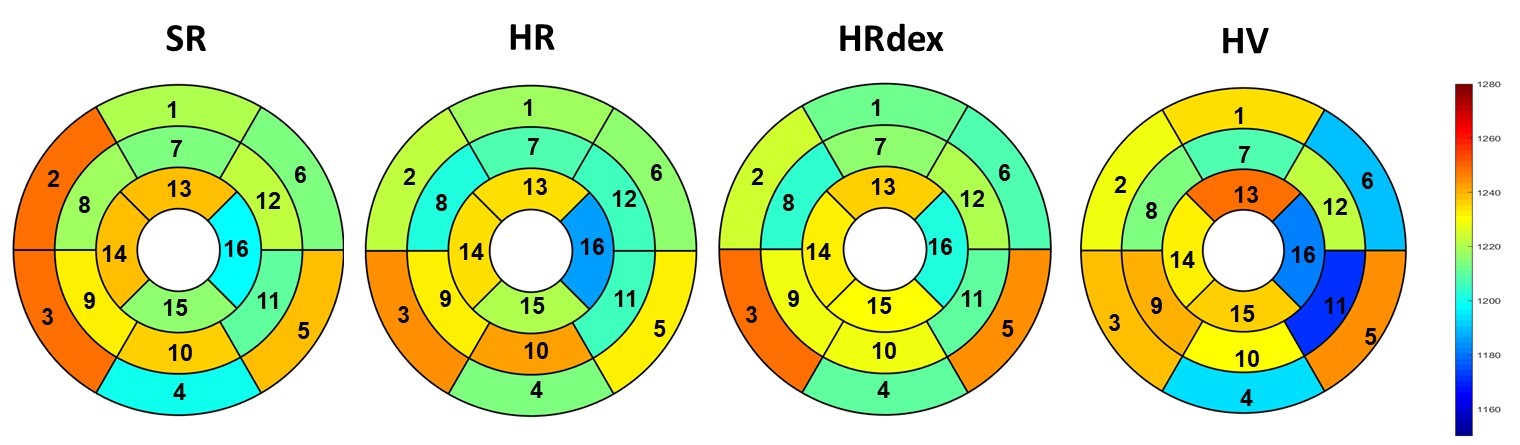
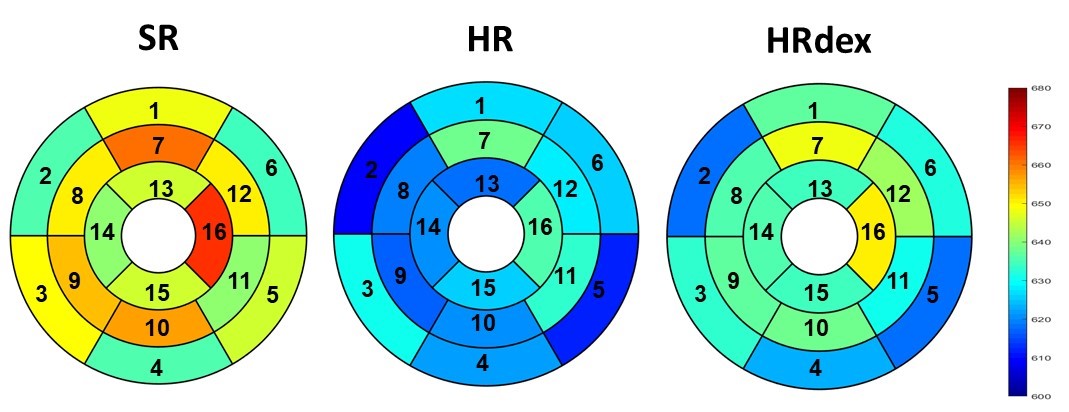
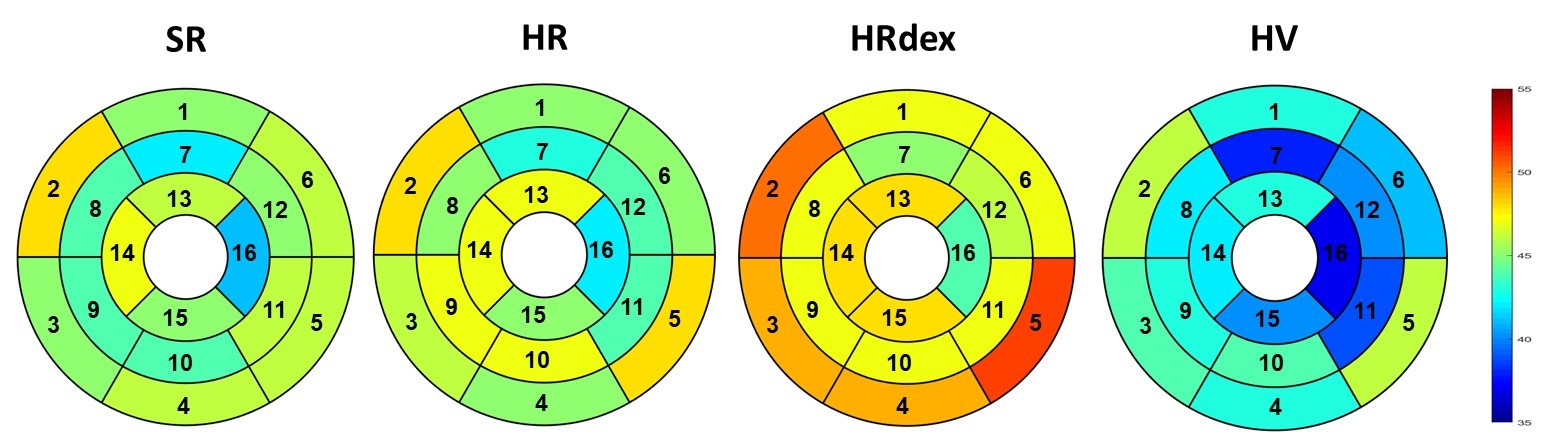
No differences were observed in native T1 between groups (Figure 2, p=0.65). Post-gadolinium T1 was lower in the HR group and higher in the SR group as compared to the HRdex group (Figure 3, p<0.001). Partition coefficient of gadolinium was smaller in the HV group and higher in the HRdex group as compared to the HR or SR group (Figure 4, p<0.001). These differences were distributed over the whole myocardial area rather than within specific myocardial segments. T2 was higher in the HR or SR group as compared to the HRdex group (Figure 5, p=0.02).Discussion
A robust method using skeleton-based segmentation was developed (intra class coefficient for repeatability of 0.91 for native T1, 0.84 for post-gadolinium T1 and 0.79 for T2). Both T1 and T2 maps were mostly noise-free within left ventricular and septal areas. The decrease in post-gadolinium T1 in the HR group might be related to myocardial diffuse fibrosis or fibrosis scar. Higher partition coefficient in cALL survivors than in healthy volunteers may suggest the presence of a reduced perfusion function. The partition coefficient of gadolinium also determines the fibrosis index, thus increased in cALL survivors. T2 changes might be related to infarcted myocardium, acute ischaemic or non-ischaemic injury due to associated changes in myocardial free water content.Conclusion
Myocardial changes were found between risk groups of cALL survivors in terms of T2, post-gadolinium T1 and partition coefficient. The use of T1 and T2 relaxation times, particularly the partition coefficient, as early indices for myocardial tissue damages in the onset of doxorubicin-induced cardiotoxicity should be further investigated along with multivariate analysis including several factors such as sex, age, cumulative dose of doxorubicin, cardiac output, ventricular pressure, myocardium contractility, myocardium passive mechanical properties, physical activity history of the patient… These computing tools will be pivotal in patient follow-up to anticipate pathology evolution, especially in children where disease progression and maturation make early cardiac sequelae detection challenging.Acknowledgements
Cole Foundation, NSERC (Discovery grant and CREATE-MEDITIS Program), FRQNT (team grant) and CIHR (team grant) for the financial support.References
1 Giri S, Chung YC, Merchant A, et al. T2 quantification for improved detection of myocardial edema. JCMR 2009;11:56.
2. Verhaert D, Thavendiranathan P, Giri S, et al. Direct T2 quantification of myocardial edema in acute ischemic injury. JACC: Cardiovascular Imaging 2011;4(3):269-278.
3. Ferreira VM, Piechnik SK, Dall’Armellina E, et al. Non-contrast T1-mapping detects acute myocardial edema with high diagnostic accuracy: a comparison to T2-weighted cardiovascular magnetic resonance. JCMR 2012;14(1):42.
4. Perel RD, Slaughter RE, Strugnell WE. Subendocardial late gadolinium enhancement in two patients with anthracycline cardiotoxicity following treatment for Ewing's sarcoma. JCMR 2006;8(6):789-791.
5. Wassmuth R, Lentzsch S, Erdbruegger U, et al. Subclinical cardiotoxic effects of anthracyclines as assessed by magnetic resonance imaging-a pilot study. American heart journal 2001;141(6):1007-1013.
Figures