2897
Prospective correction of patient-specific respiratory motion in T1 and T2 mapping1The Ohio State University, Columbus, OH, United States, 2Cardiovascular MR R&D, Siemens Medical Solutions USA, Inc., Columbus, OH, United States
Synopsis
Respiratory motion in cardiovascular MRI presents a challenging problem with many solutions. Current approaches require breath-holds, neglect through-plane motion or significantly increase scan time. Our patient-specific prospective motion correction strategy addresses these issues and corrects for respiratory motion in real time. Numerous cardiac imaging applications stand to benefit from our approach, including perfusion imaging, parameter mapping, and late gadolinium enhancement. By modeling on a patient-specific basis, and prospectively correcting for respiratory motion, we expect to significantly improve the reliability and efficiency of CMR. For demonstration, the proposed strategy was applied to improve the accuracy of free-breathing T1 and T2 mapping.
Introduction
Myocardial T1 and T2 mapping are emerging techniques that analyze diffuse and acute myocardial changes in various pathological conditions. Both techniques require multiple images acquired at varied parameters to generate pixel-by-pixel maps of T1 and T2 values. To generate these maps, source images are retrospectively registered to anatomically match pixels across multiple source images. However, respiratory motion reduces the effectiveness of retrospective image registration,1 degrading the accuracy of resulting parameter maps and the clinical efficacy of myocardial parameter mapping. Current methods for reducing motion-related artifacts include breath-holds, navigator gating and prospective slice tracking. While breath-holding is considered the gold standard, it is not possible for many patients, necessitating the use of free-breathing methods. Navigator gating is effective but at the expense of scan time, reducing scan efficiency by a factor of 2.5 to 5,2 and is incompatible with current T1 mapping acquisition schemes. To improve imaging efficiency and the accuracy of T1 and T2 mapping, we developed a patient-specific motion model that describes the motion of the heart throughout the respiratory cycle and corrects for that motion in real-time. This method is expected to reduce both through- and in-plane motions and allow for free-breathing data acquisition with 100% efficiency.Methods
Training data are acquired at the beginning of the scan to calibrate the patient-specific motion model. This data consists of single-shot images of the heart and diaphragmatic navigators captured simultaneously throughout the respiratory cycle in orthogonal planes. Heart motion is extracted by non-rigid registration and feature tracking, and modeled with respect to navigator position in 3D, as shown in Figure 1. Separate models are built for inspiratory and expiratory curves to account for hysteretic motion. A prototype pulse sequence developed for T1 and T2 mapping reads the coefficients of the motion model, and prospectively adjusts the slice plane to follow the heart throughout the respiratory cycle. All experiments were performed on a 3T Magnetom Trio a Tim system (Siemens Healthcare, Erlangen, Germany). A study was performed in 5 volunteers comparing T1 measurements between free-breathing (T1-NOCO) and free-breathing with prospective motion correction (T1-PROCO); depth of respiration was measured in each scan. Means and standard deviations of myocardial T1 measured in a single short-axis slice in each subject were compared. To validate that PROCO increases both accuracy and precision, a reproducibility study was performed where T2 maps were generated 10 times in a single volunteer with breath-hold (T2-BH), free-breathing (T2-NOCO), and free-breathing with prospective motion correction (T2-PROCO). 6 mid-ventricular segments were defined, numbered 1-6 starting at the RV insertion point and equally spaced around the circumference of the myocardium. Means and standard deviations of T2 measurements in each segment were measured for all T2 imaging conditions and compared with Bland-Altman analysis.Results
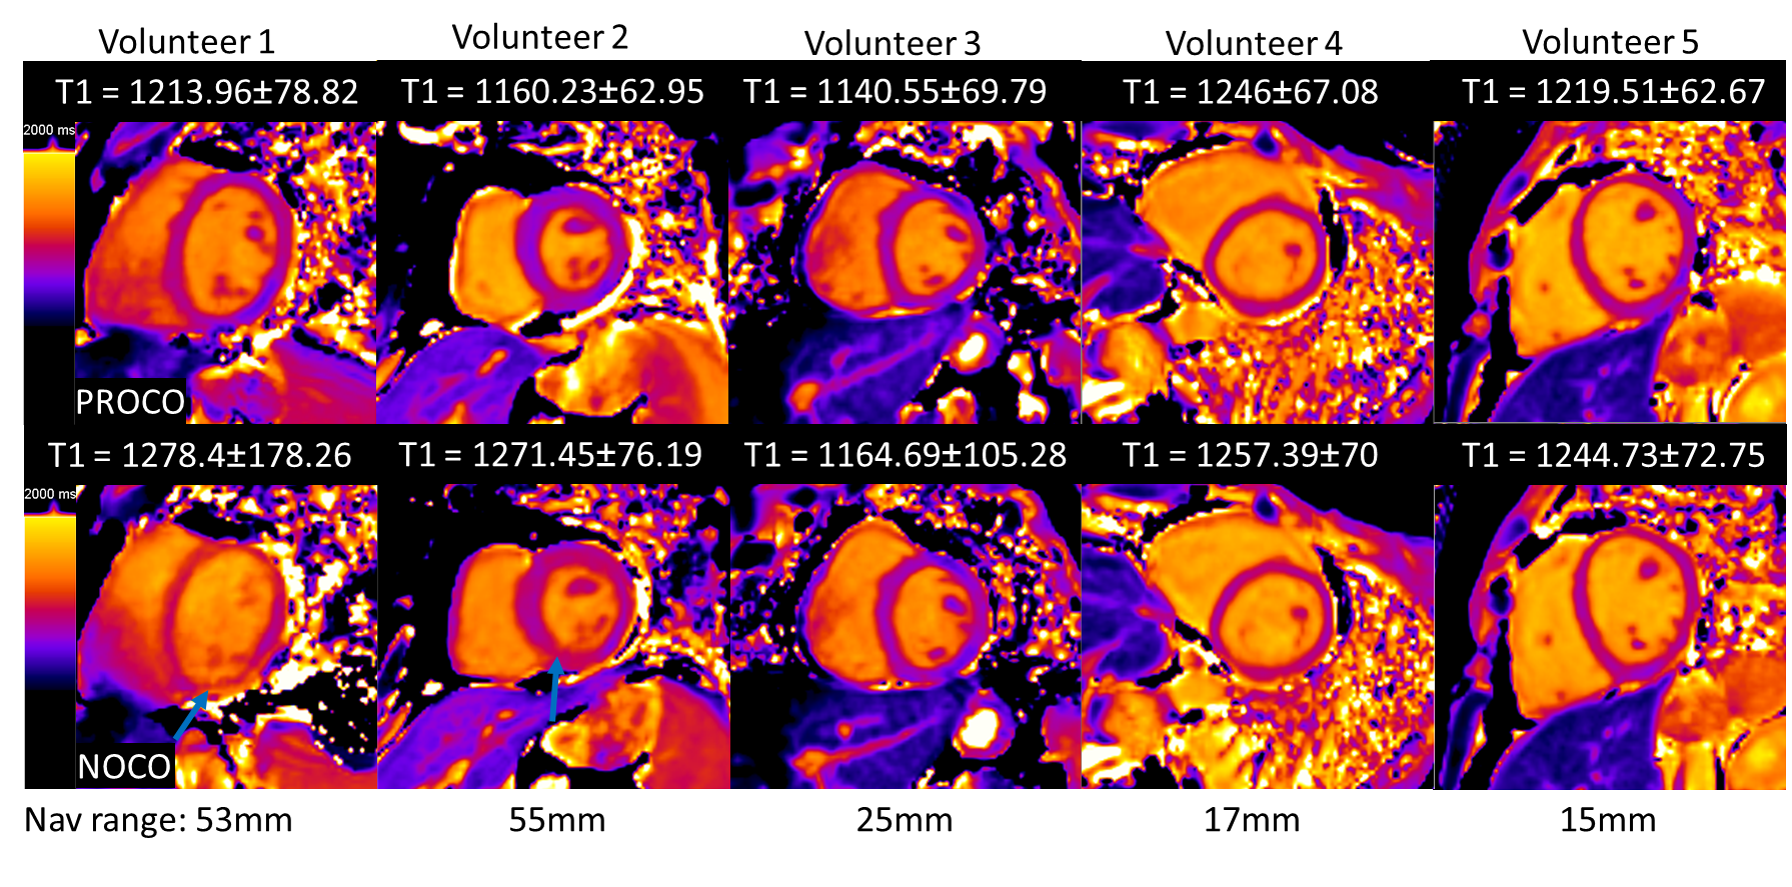
Standard deviations in myocardial T1 were reduced in all T1-PROCO acquisitions relative to T1-NOCO, as shown in Figure 2. This is likely due to reduction of blood pool signal influence on the myocardium that can occur with motion. T1 measurements were similar across all volunteers with T1-PROCO, while variability increased with deeper breathing in T1-NOCO. Previous literature reports mid-ventricular myocardial T1 at 3T in the range of 1020-1260 ms, which is consistent with our findings.3 While the lower average myocardial T1 observed with T1-PROCO is consistent with reduced blood pool contamination, further work is required to validate this.
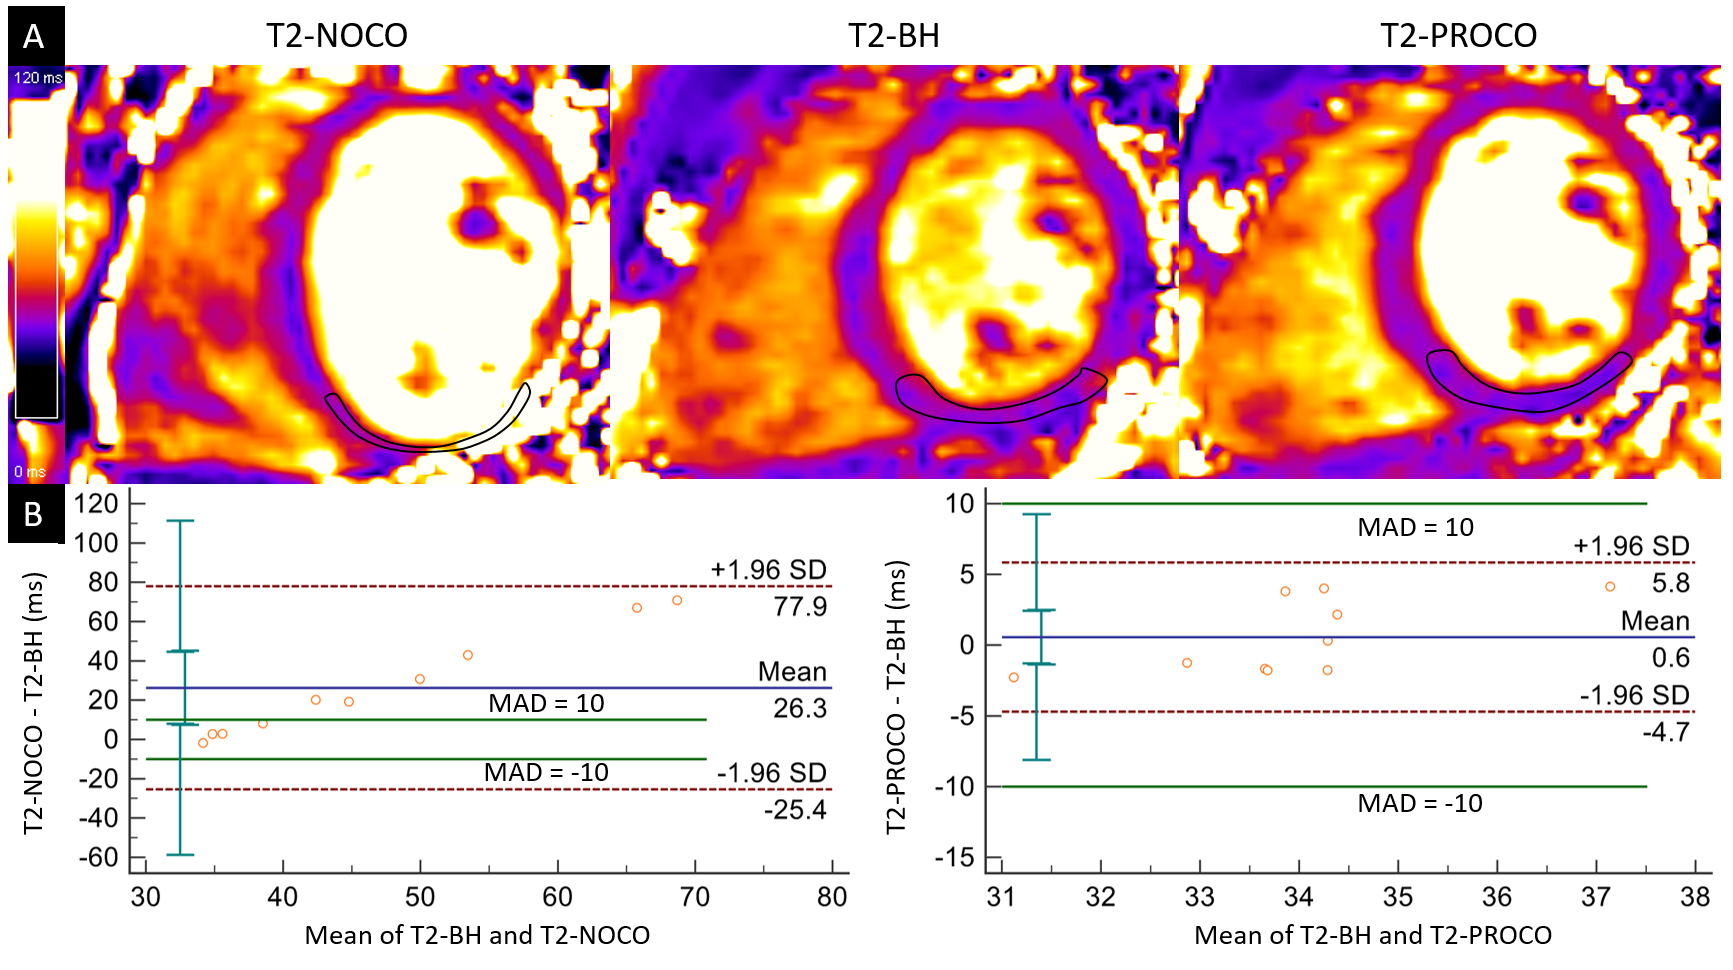
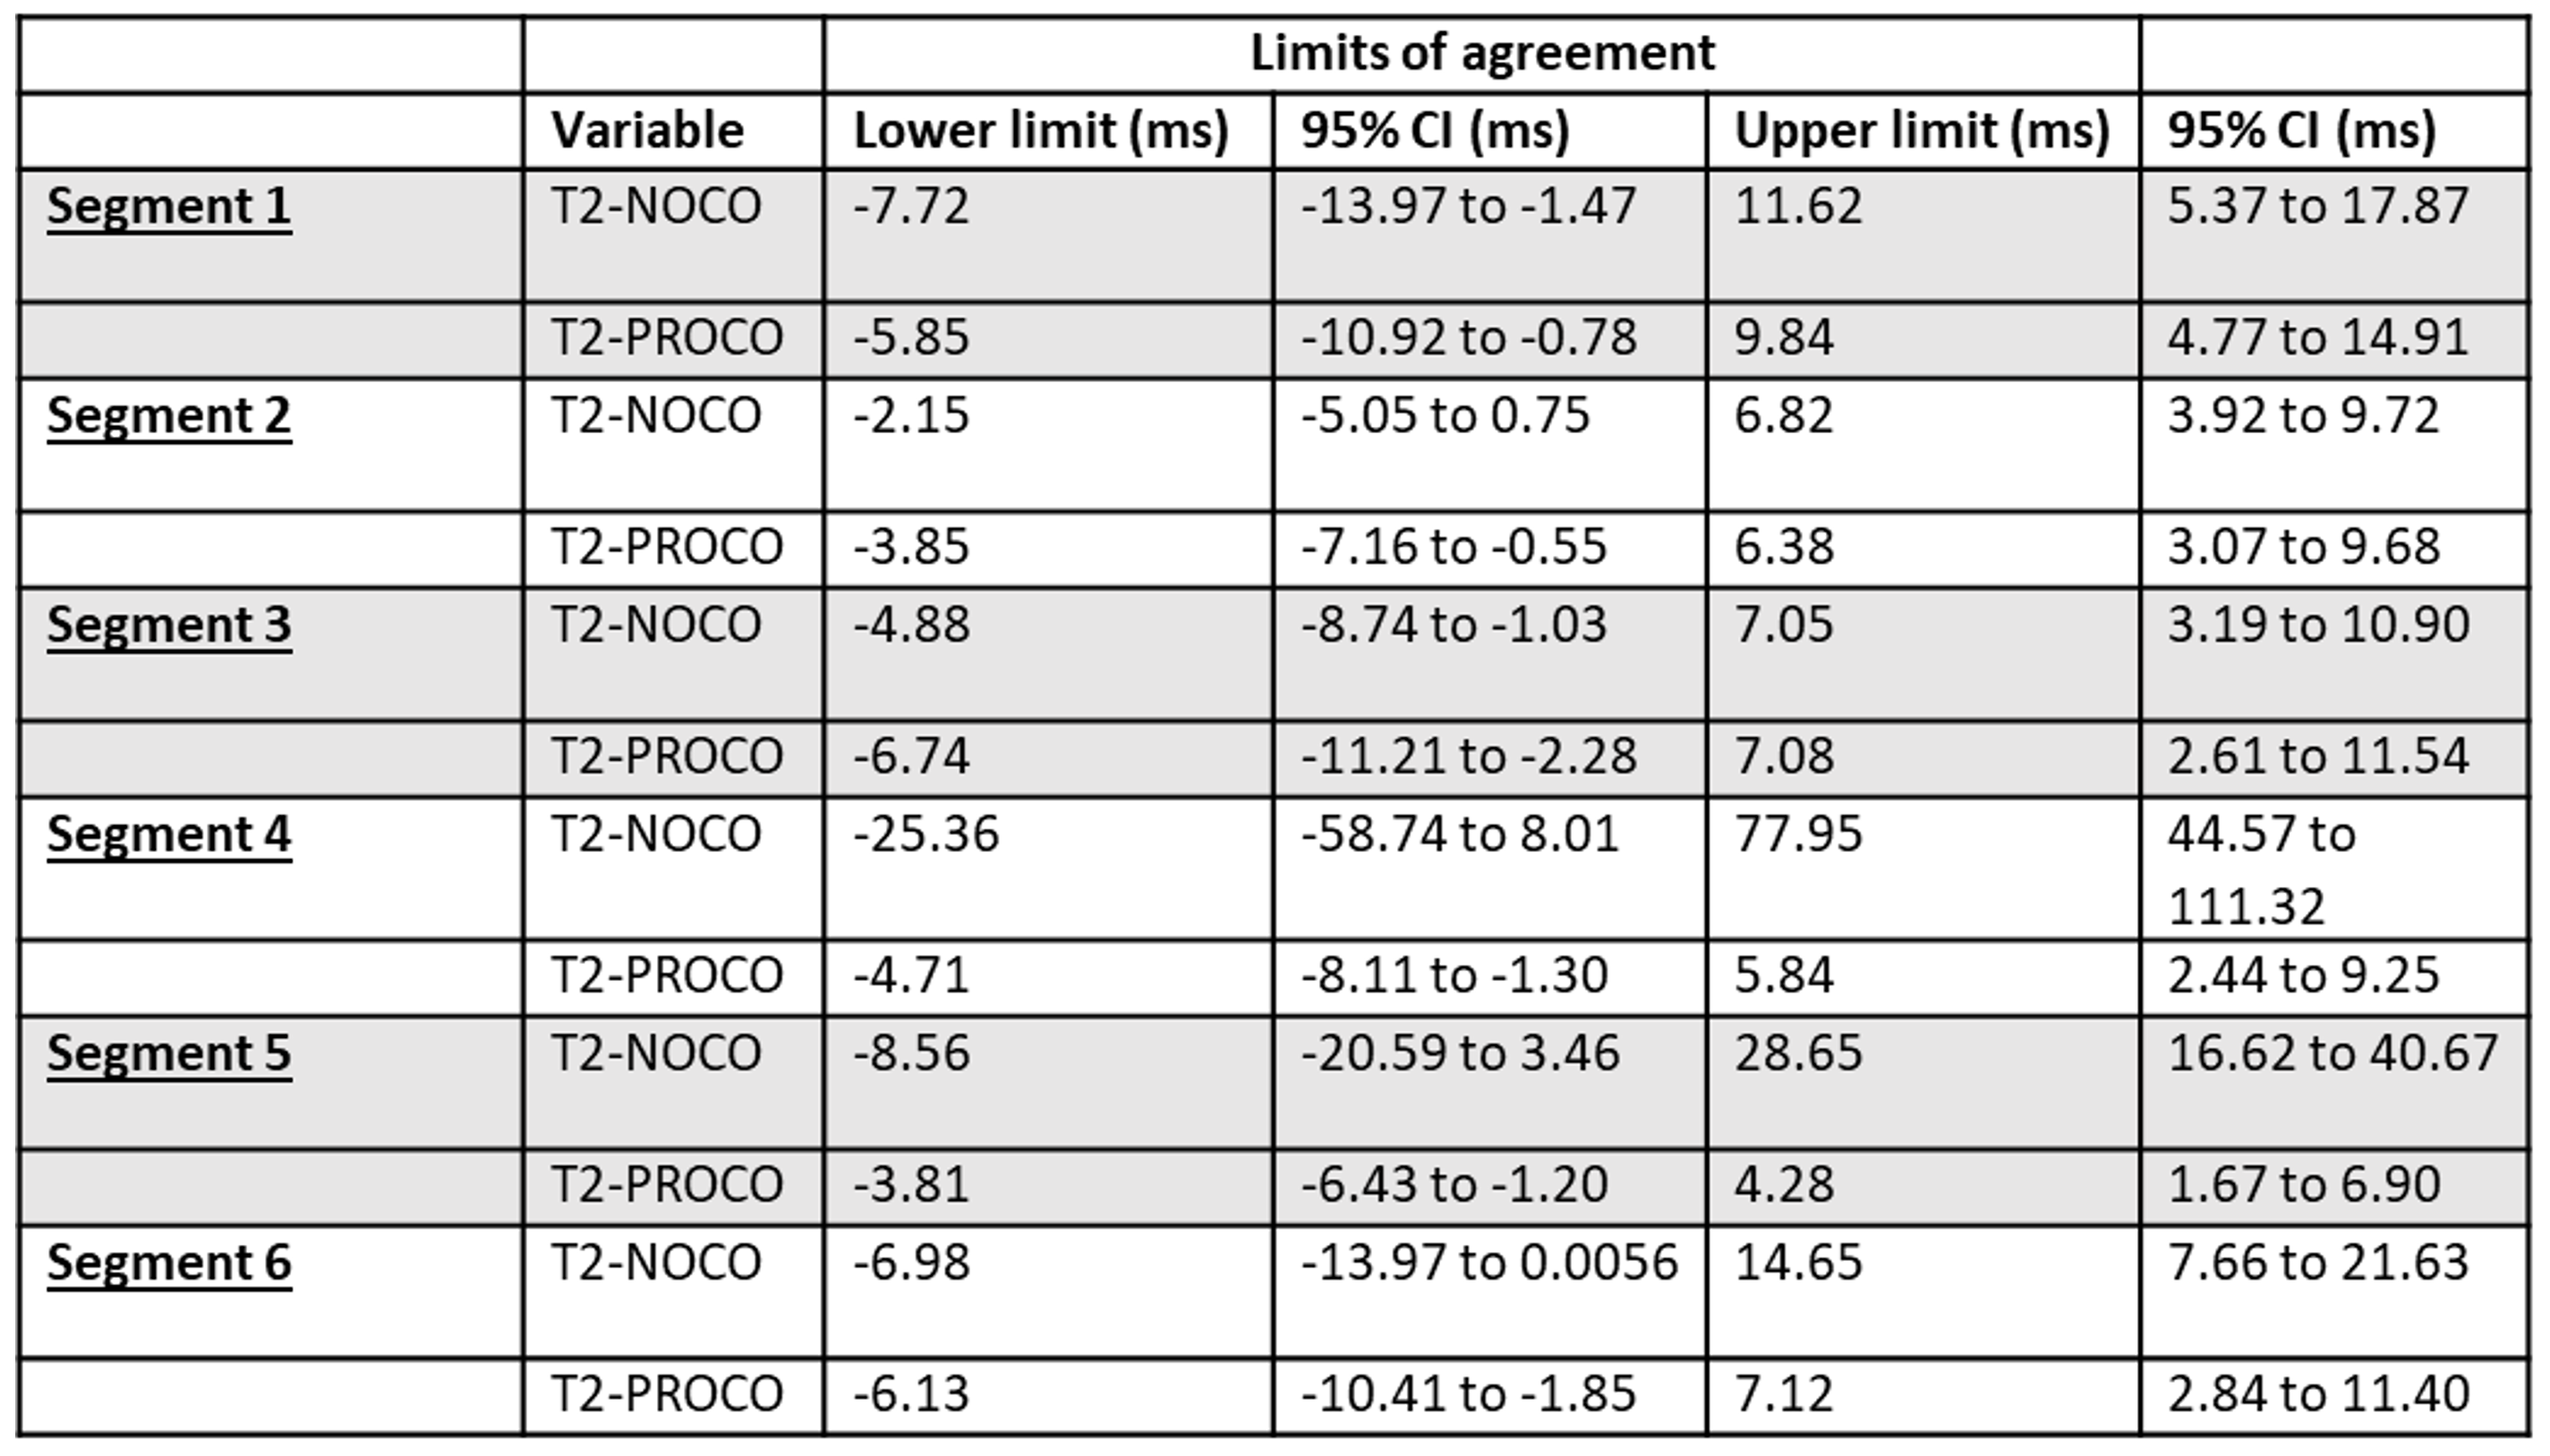
For T2 imaging reproducibility, Table 1 shows Bland-Altman analysis in all mid-ventricular segments, where T2-BH is the reference. An example measurement of segment 4 is shown in Figure 3A; this measurement is challenging in motion corrupted T2-NOCO, where segments 4-6 show significant blood-pool contamination, which is not present in T2-BH-PROCO. Bland-Altman analysis of segment 4 is shown in Figure 3B. Previous literature reports 95% confidence intervals for T2 of approximately 10 ms; therefore, maximum allowable difference (MAD) is set to 10 ms for relative comparison.3 T2-PROCO produces limits of agreement (LOA) well within 10 ms, whereas T2-NOCO is significantly greater than these bounds. T2-PROCO produces significantly smaller LOA compared to T2-NOCO in segments 4-6, as shown in Table 1. In addition, T2-PROCO measurements are within an MAD of 10 ms for all segments, compared to 2/6 with T2-NOCO.
Conclusion
PROCO reduces variations in T1 and T2 mapping while maintaining a 100% data acceptance rate, improving the accuracy, precision, and efficiency of parametric mapping. T1-PROCO reduced standard deviations in T1 measurements compared to T1-NOCO. T2-PROCO produced T2 measurements within an MAD of 10 ms in all 6 mid-ventricular segments, where T2-NOCO did so in 2/6.Acknowledgements
Funded by TL1 Award Number Grant TL1TR001069References
1. Scott AD, Keegan J, Firmin DN. Motion in cardiovascular MR imaging. Radiology. 2009;250(2):331-351. doi:10.1148/radiol.2502071998.
2. Jhooti P, Keegan J, Firmin DN. A fully automatic and highly efficient navigator gating technique for high-resolution free-breathing acquisitions: Continuously adaptive windowing strategy. Magn Reson Med. 2010;64(4):1015-1026. doi:10.1002/mrm.22491.
3. von Knobelsdorff-Brenkenhoff F, Prothmann M, Dieringer MA, et al. Myocardial T1 and T2 mapping at 3 T: reference values, influencing factors and implications. J Cardiovasc Magn Reson. 2013;15(1):53. doi:10.1186/1532-429X-15-53.
Figures