2896
Simultaneous high-resolution cardiac T1 mapping and cine imaging using model-based iterative image reconstruction1Physikalisch-Technische Bundesanstalt (PTB), Braunschweig and Berlin, Germany, 2Working Group on Cardiovascular Magnetic Resonance, Experimental and Clinical Research Center (ECRC), DZHK partner site Berlin, Berlin, Germany, 3Charité Medical Faculty University Medicine, Berlin, Germany, 4Department of Cardiology and Nephrology, HELIOS Klinikum Berlin Buch, Berlin, Germany, 5Division of Imaging Sciences and Biomedical Engineerin, King's College London, London, United Kingdom
Synopsis
Native myocardial T1 mapping provides information for the detection of diffuse fibrosis in different cardiac diseases. Here we present simultaneous T1 mapping and cine imaging with a resolution of 1.3x1.3mm² using model-based iterative reconstruction. T1 times in the septum were 1285±46ms compared to 1240±28ms obtained with MOLLI. In contrast to MOLLI, the proposed approach did not show any heart rate dependence of T1. In addition, the approach allows T1 mapping of challenging structures, such as the right ventricle and the apex. Functional assessment of reconstructed cine images did not show any significant differences compared to a standard Cartesian cine scan.
Introduction
Native myocardial T1 mapping provides information for the detection of diffuse fibrosis in different cardiac diseases such as cardiomyopathies.1 Commonly, cine imaging is performed to quantify cardiac function and wall motion abnormalities. The combination of both allows the identification of subtle changes. Currently T1 maps and cine images are obtained in separate scans, leading to long examination times. We have demonstrated the feasibility of combining accurate T1 mapping and cine imaging in a single breath-hold for an in-plane resolution of 2x2mm² using a model-based iterative reconstruction approach.2
Here we extend this approach to obtain high-resolution (1.3x1.3mm²) T1 maps and cine images. We compare this technique to Modified Look-Locker Inversion Recovery (MOLLI) T1 maps and standard Cartesian cine scans in a volunteer study in 10 subjects.
Methods
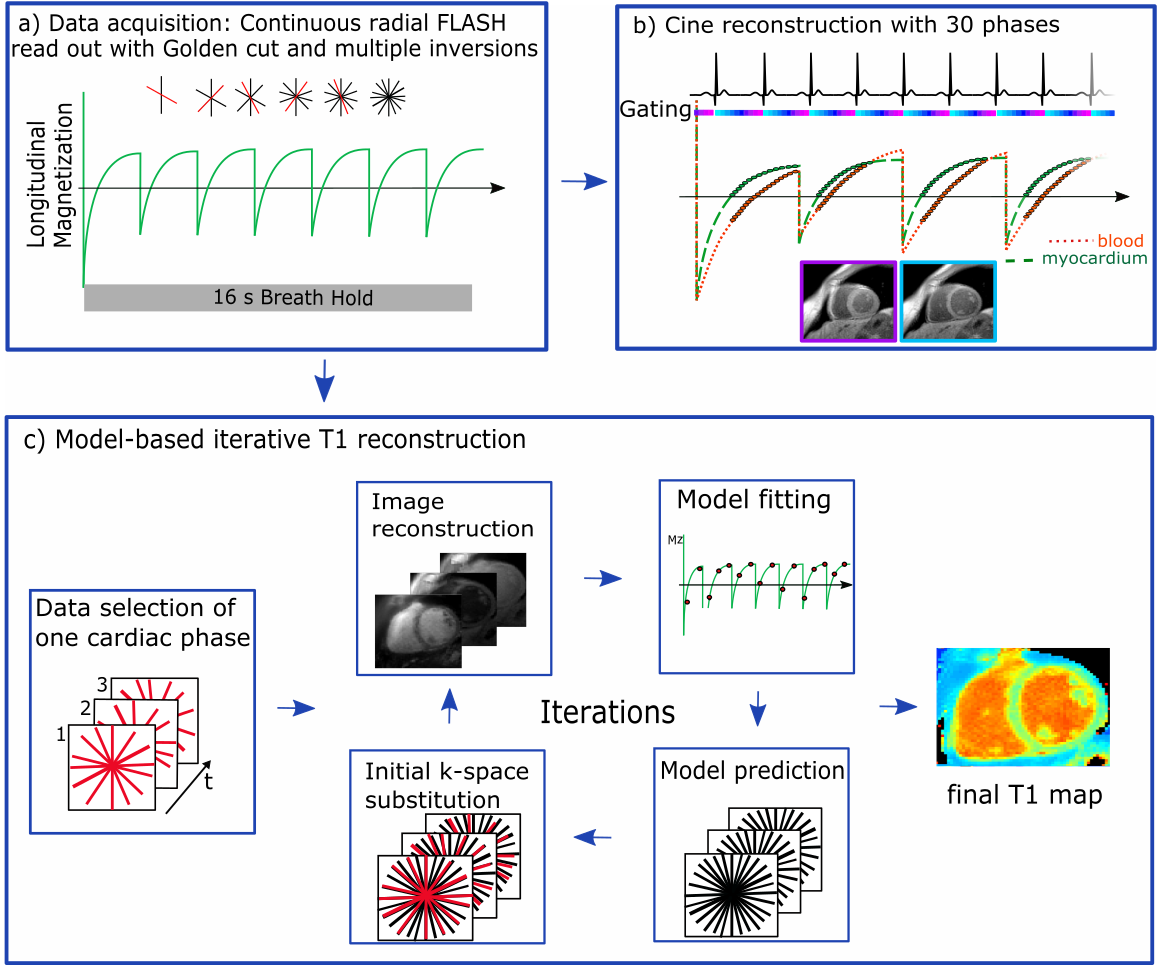
Data acquisition: The 2D data acquisition utilizes a continuous golden-angle radial sampling scheme (Figure 1). Multiple inversion pulses were applied at constant time intervals independent of the ECG signal.
Image reconstruction: T1 maps were obtained by model-based iterative reconstruction (Figure 1).2,3 Data was selected ones for diastole and ones for systole. At each iteration, images were reconstructed and T1 values were estimated by pixel-wise fitting to a three-parameter signal model. The signal model describes the behavior of the FLASH signal during continuous data acquisition and multiple inversions. Data consistency was ensured by substitution of model predictions by the acquired k-space data. The process was stopped after a fixed number of iterations.
Cine images were reconstructed using the same raw data. To ensure high contrast between blood and myocardium, data was selected such that the signal from myocardium after each inversion was positive (Figure 1). Since blood has a longer T1 its signal experiences zero-crossing resulting in a dark-blood contrast.2 Cine images were reconstructed with iterative kt-SENSE.4
In vivo imaging: In 10 healthy subjects (6 males, aged 31.3±8.4years), 2D slices were acquired within a 16s breath-hold: flip angle: 5°, TE/TR: 2.03/4.93ms, FOV: 320x320mm², resolution: 1.3x1.3x8.0mm³. Inversion pulses were applied every 2276ms. Slices were oriented in a mid-ventricular short axis (SAX) and four-chamber view (4ChV). SAX slices were acquired twice to test the repeatability of T1. T1 maps were reconstructed for mid-diastole and mid-systole within a 168ms window. Cine images were reconstructed with 30 cardiac phases. For comparison purposes, a diastolic 3(3)3(3)5 MOLLI T1 map (resolution: 2.1x1.4mm², acquisition window: 396ms) and a FLASH-based Cartesian cine scan (resolution: 1.7x1.7mm²) were also acquired.
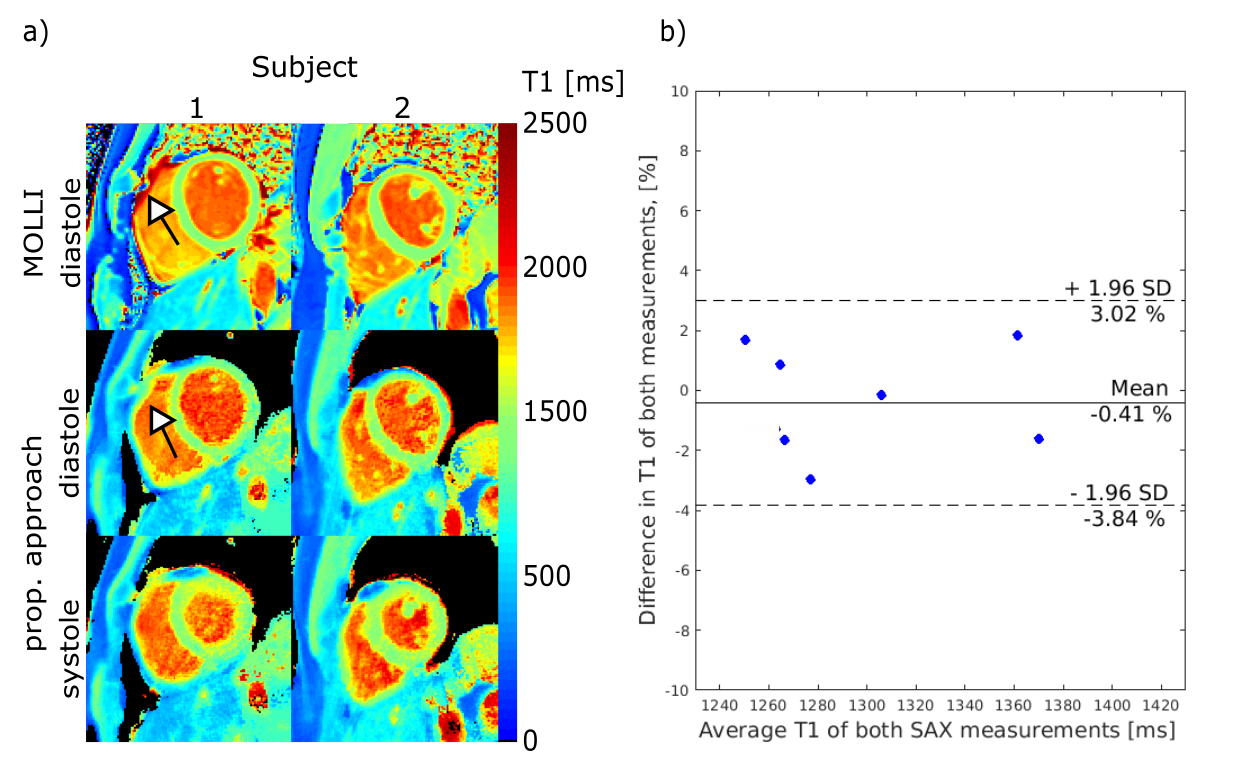
Data analysis: T1 values were measured in a septal region of interest. To evaluate the robustness of the in vivo T1 mapping, repeatability was assessed by comparison of the computed septal T1 values of two repeated SAX acquisitions by a Wilcoxon test in eight subjects. T1 values in the septum were compared to the T1 obtained by MOLLI using a Friedman test with Dunn’s multiple comparison correction. Heart rate dependency was studied using Person’s linear correlation.
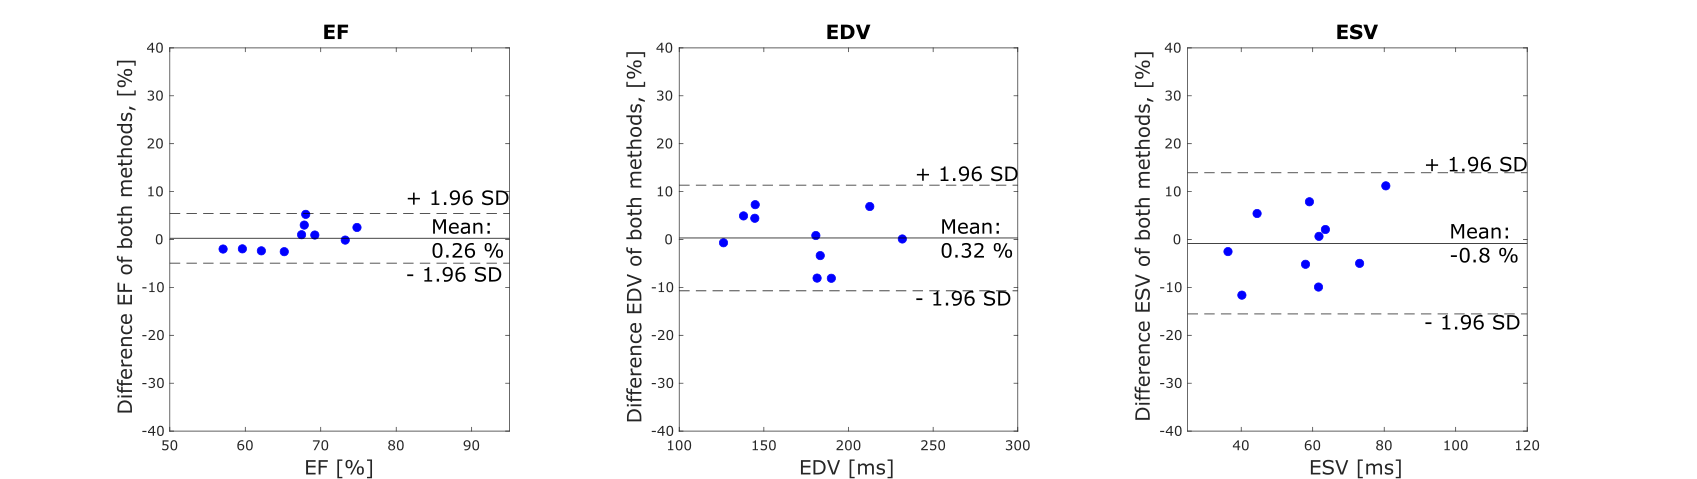
Left-ventricular functional analysis (end-diastolic volume (EDV), end-systolic volume (ESV) and ejection fraction (EF)) was performed based on the 4ChV and the SAX images by the hemisphere-cylinder model.5,6
Results and Discussion
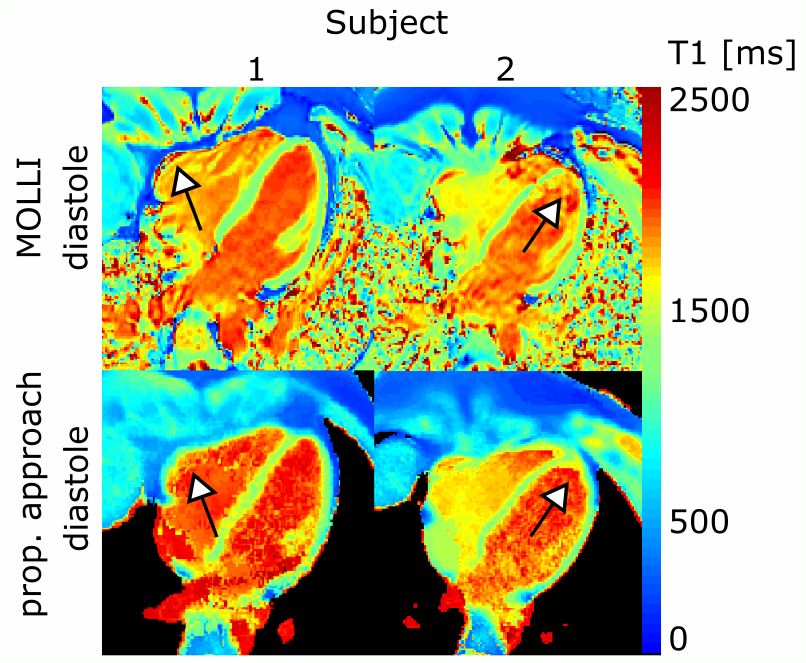
Figure 2 and 3 show T1 maps for diastole and systole. In the 10 subjects, for our approach, average diastolic and systolic T1 in SAX were 1285±46ms and 1323±78ms, respectively (no significant difference). Diastolic MOLLI T1 values were 1240±28ms in SAX. No significant differences were found between MOLLI T1 values and diastolic T1 obtained by our method. No dependence on the heart rate was seen in SAX (P=0.89, heart rates: 46–76bpm), whereas T1 obtained by MOLLI was inverse correlated to the heart rate (P=0.02), which is in agreement with previous studies.7
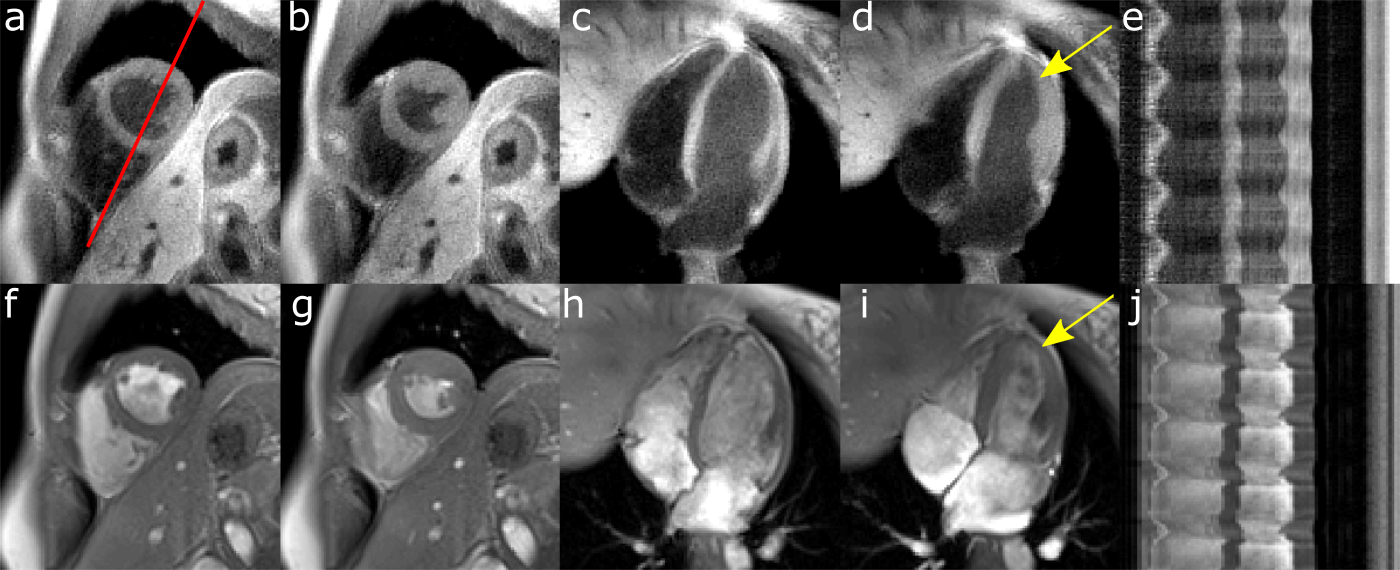
Reconstructed cine images had a consistent dark-blood contrast over all phases. The dark-blood contrast ensures high image contrast between blood and myocardium also in regions which are challenging for standard cine scans, such as the apical region (Figure 4). Functional parameter did not differ compared to the Cartesian cine scan (EF: P=0.65, EDV: P=0.97, ESV: P=0.94). So far, cine images were used for functional assessment, but they could also be utilized for cardiac motion estimation and correction to further improve the efficiency of the proposed method.
Conclusion
The presented approach provides high-resolution (1.3x1.3mm²) quantitative T1 maps for multiple cardiac phases within 16s. T1 values were accurate, robust and independent of the heart rate. The improved spatial resolution and the motion robustness of radial sampling ensures accurate T1 mapping of the left ventricle and also of otherwise challenging structures, such as the right ventricle or the apex. Additionally, functional assessment was possible from the same data, strongly improving the diagnostic value of the acquisition.Acknowledgements
No acknowledgement found.References
1. Bohl S, Schulz-Menger J. Cardiovascular magnetic resonance imaging of non-ischaemic heart disease: established and emerging applications. Heart Lung Circ. 2010;19(3):117-132.
2. Becker KM, Schulz-Menger J, Schaeffter T, Kolbitsch C. Multi-parametric cardiac MRI for T1 mapping and cine imaging using iterative model-based image reconstruction. Proc. Intl. Soc. Mag. Reson. Med 25. 2017.
3. Tran-Gia J, Stäb D, Wech T, et al. Model-based Acceleration of Parameter mapping (MAP) for saturation prepared radially acquired data. Magn Reson Med. 2013;70(1992):1524-1534.
4. Tsao J, Boesiger P, Pruessmann KP. k-t BLAST and k-t SENSE: dynamic MRI with high frame rate exploiting spatiotemporal correlations. Magn Reson Imaging. 2003;50:1031–1042.
5. Lang RM, Bierig M, Devereux RB, et al. Recommendations for chamber quantification: a report from the American Society of Echocardiography's Guidelines and Standards Committee and the Chamber Quantification Writing Group, developed in conjunction with the European Association of Echocardiography, a branch of the European Society of Cardiology. Eur J Echocardiography. 2006;7:79-108.
6. Thiele H, Paetsch I, Schnackenburg B, et al. Improved accuracy of quantitative assessment of left ventricular volume and ejection fraction by geometric models with steady-state free precession. J Cardiovasc Magn Reson. 2002;4(3):327-39.
7. Weingaertner S, Akçakaya M, Basha T, et al. Combined Saturation/inversion Recovery Sequence for Improved Evaluation of Scar and Diffuse Fibrosis in Patients with Arrhythmia or Heart Rate Variability. Magn Reson Med. 2014;71:1024-1034.
Figures