2895
Simultaneous Quantification of T1, T2, and Off-resonance Using FISP-MRF with a Rosette Trajectory and Readout Segmentation1Biomedical Engineering, Case Western Reserve University, Cleveland, OH, United States, 2Radiology, University Hospitals, Cleveland, OH, United States
Synopsis
Artifacts due to off-resonance effects are a significant challenge for non-Cartesian MRI. In FISP-based MRF sequences, if the entire spiral readout is employed to generate a highly undersampled image, any off-resonance during the readout will lead to blurring. However, short portions of the readout will be mostly free of dephasing due to off-resonance effects. By gridding only segments of the readout, it may be possible to quantify the resonance frequency along with T1 and T2. This work shows a proof-of-principle application of this idea using the cardiac MRF sequence with the rosette trajectory in simulations.
Introduction
Artifacts due to off-resonance effects caused by B0 field inhomogeneity and fat signals are a significant challenge for non-Cartesian MRI. The original bSSFP MRF sequence is sensitive to off-resonance effects but may also result in banding artifacts1. In FISP-based MRF sequences2,3, if the entire spiral readout is employed to generate a highly undersampled image, any off-resonance during the readout will lead to blurring but not banding artifacts. However, short portions of the readout will be mostly free of dephasing due to off-resonance effects. By gridding only segments of the readout, it may be possible to quantify the resonance frequency along with T1 and T2.
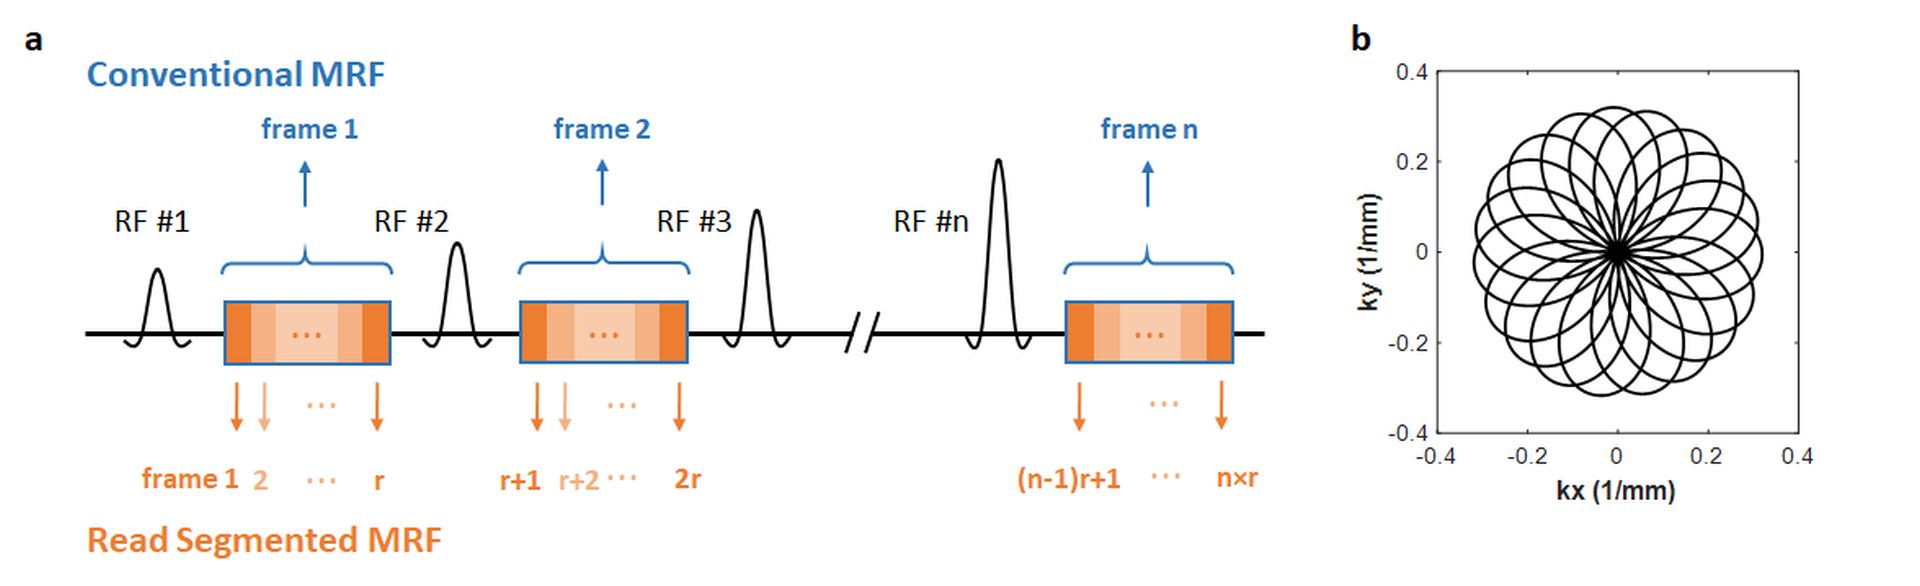
Here we propose an approach to quantify T1, T2, and off-resonance simultaneously based on FISP-MRF framework with a rosette trajectory. In order to measure off-resonance effects, the signal evolution is modeled during the readout time. Data points acquired during one rosette interleaf after one excitation are divided into multiple segments, such that the dephasing between water and fat is sufficiently small during one segment, and the total number of segments is adequate to model off-resonance accumulation (Figure 1a). This work shows a proof-of-principle application of this idea using the cardiac MRF sequence with the rosette trajectory in simulations.
Methods
Simulation studies were performed on an open-source numerical cardiac phantom (MRXCAT)4. The phantom was modified to have T1 and T2 values corresponding to those of the heart at 1.5T, with T1 values from 250 ms to 1200 ms, T2 values from 20 ms to 100 ms, and off-resonance values of 0 and -220 Hz representing water and fat, respectively. B0 field inhomogeneity was simulated arbitrarily as a linear variation from -50 Hz to 50 Hz from left to right. A rosette trajectory was designed with 1700 readout points in one interleaf and nineteen zero-crossings (Figure 1b). A total of 48 excitations were acquired every heartbeat. The scan duration was 15 heartbeats, and a constant heart rate of 60 bpm was simulated. The rosette interleaf was rotated by the golden angle (111°) between excitations. Inversion and T2 preparation pulses were employed as in the original cardiac MRF sequence3. Linearly varying flip angles were employed with the minimal flip angle of 4° and the maximal flip angles of 12°, 18°, 25°, 25°, and 25° for every five successive heart beats. A constant TR/TE of 5.1/1.39 ms was used. Other parameters are: 300×300 mm2 field of view; 192×192 matrix.
Each rosette interleaf was divided into 85 groups of 20 readout points each, which were gridded to form a highly undersampled image using the NUFFT5. Thus instead of the typical 48x15=720 images collected for conventional MRF, 48x15x85=61200 images were available for T1, T2, and off-resonance quantification. Note that dephasing between water and fat within the duration of a 20-point segment is 0.02π in the current simulation study, and thus negligible. For dictionary generation, a Bloch simulation was performed using an isochromat of 100 spins. Signal evolutions not only over excitations but also within one excitation over the 85 segments were simulated to incorporate off-resonance information. The MRF signal is calculated by taking a complex average of the transverse magnetization over the entire isochromat. The dictionary resolution, denoted by min:step:max, was T1 [190:20:400, 700:20:1000, 1100:20:1300] ms, T2 [10:5:60, 90:10:110] ms, off-resonance [-50:5:50, -230:10:-210] Hz. The dictionary had a total of 12,768 entries. Unrealistic pairs of T1 and T2 were not simulated, including T2>T1. Dot product pattern matching was performed to select the MRF dictionary entry which most closely fit the undersampled images to extract T1, T2 and off-resonance values.
Results
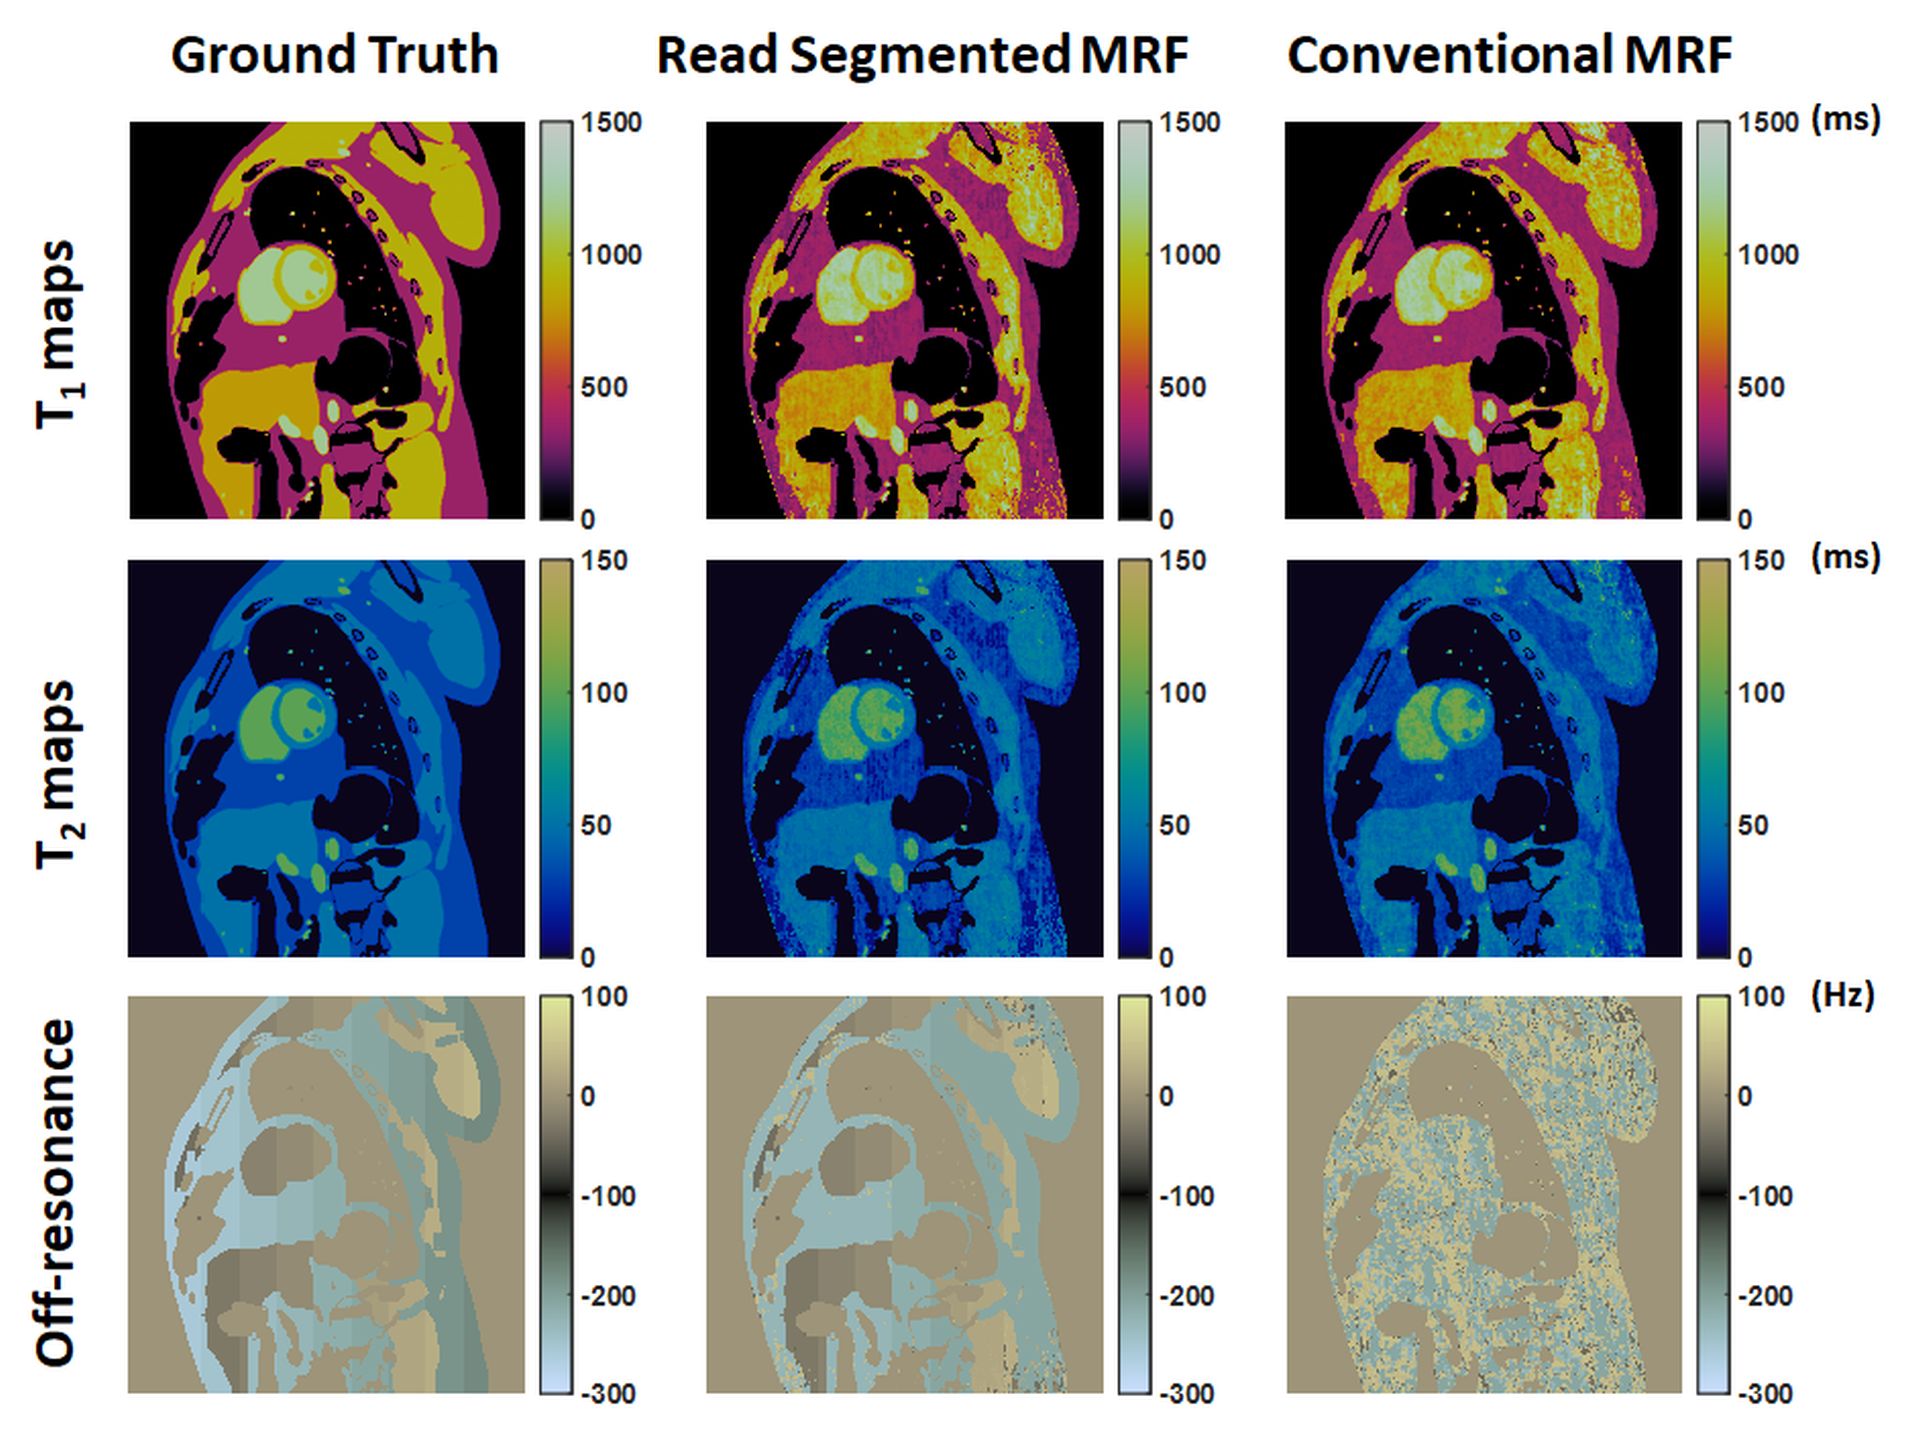
Figure 2 shows the ground truth tissue property maps, conventional MRF maps, and the read segmented MRF maps. Compared to ground truth, normalized RMSE in T1, T2 maps over the entire phantom are 9.6%, 12.4% of conventional MRF and 12%, 16.1% of read segmented MRF, respectively. The off-resonance map of read segmented MRF shows good agreement with ground truth. In addition to mapping the B0 field inhomogeneity, fat and water can also be distinguished.Discussion
This study shows that off-resonance information (including fat/water discrimination) can be retrieved along with T1 and T2 values in FISP-MRF sequence framework by considering the effects of off-resonance during the MRF readout. A rosette trajectory was used instead of a spiral trajectory due to the need to sample the center of k-space more frequently when fewer points are gridded to generate each undersampled image. Further improvement may be achieved by using iterative pattern matching3,6.Acknowledgements
R01HL094557, R01DK098503, CBET 1553441, Siemens Healthineers (Erlangen, Germany).References
1. Ma D, Gulani V, Seiberlich N, Liu K, Sunshine JL, Duerk JL, Griswold MA. Magnetic resonance fingerprinting. Nature 2013;495: 187–192.
2. Jiang Y, Ma D, Seiberlich N, Gulani V, Griswold MA. MR fingerprinting using fast imaging with steady state precession (FISP) with spiral readout. Magn Reson Med 2015;74:1621–1631.
3. Hamilton J, Jiang Y, Chen Y, Ma D, Lo W, Griswold M, Seiberlich. MR Fingerprinting for Rapid Quantification of Myocardial T1,T2, and Proton Spin Density. Magn Reson Med 2017;77:1446-1458.
4. Wissmann L, Santelli C, Segars WP, Kozerke S. MRXCAT: realistic numerical phantoms for cardiovascular magnetic resonance. J Cardiovasc Magn Reson 2014;16:63.
5. Fessler JA. On NUFFT-based gridding for non-Cartesian MRI. J Magn Reson 2007;188:191–195.
6. Pierre EY, Ma D, Chen Y, Badve C, Griswold MA. Multiscale Reconstruction for MR Fingerprinting. Magn Reson Med 2016;75:2481–2492.
Figures