2889
Interior-Point and Particle-Swarm Optimization of an Inversion-Recovery Prepared Spoiled Gradient Echo Magnetic Resonance Fingerprinting Sequence1Department of Radiological Sciences, David Geffen School of Medicine, University of California, Los Angeles, Los Angeles, CA, United States, 2Department of Bioengineering, University of California, Los Angeles, Los Angeles, CA, United States
Synopsis
Magnetic Resonance Fingerprinting (MRF) permits simultaneous quantitative mapping of multiple MR parameters. We propose a framework for optimizing the sequence parameters of an inversion recovery prepared spoiled gradient echo (IR spoiled-GRE) based MRF sequence, with interior-point (IP) method and particle-swarm optimization (PSO). By using an designed exponential cost function to maximize the discrimination between tissue types, with combined sinusoidal wave functions as input to generate sequence parameters, substantial improvement of accuracy for T1 and T2* quantification can be achieved. Simultaneous high accuracy of T1 and T2* estimations can be achieved within 0.7s for SNR≥5; within 0.5s for SNR≥10.
Introduction
Magnetic resonance fingerprinting (MRF)1 is a novel technique for simultaneous quantitative mapping of multiple MR parameters. MRF generates unique signal evolutions for different tissue types and reconstructs the parameter maps based on pattern-matching. In this study, an MRF acquisition scheme based on an inversion recovery prepared spoiled gradient echo (IR spoiled-GRE) sequence is optimized to improve the accuracy of parameter quantification, using Interior-point (IP) method2 and particle swarm optimization (PSO). The performance of both algorithms were evaluated based on the accuracy for T1 and T2* measurements, optimization speed and cost function value. An initial sequence design framework for MRF is proposed.Methods
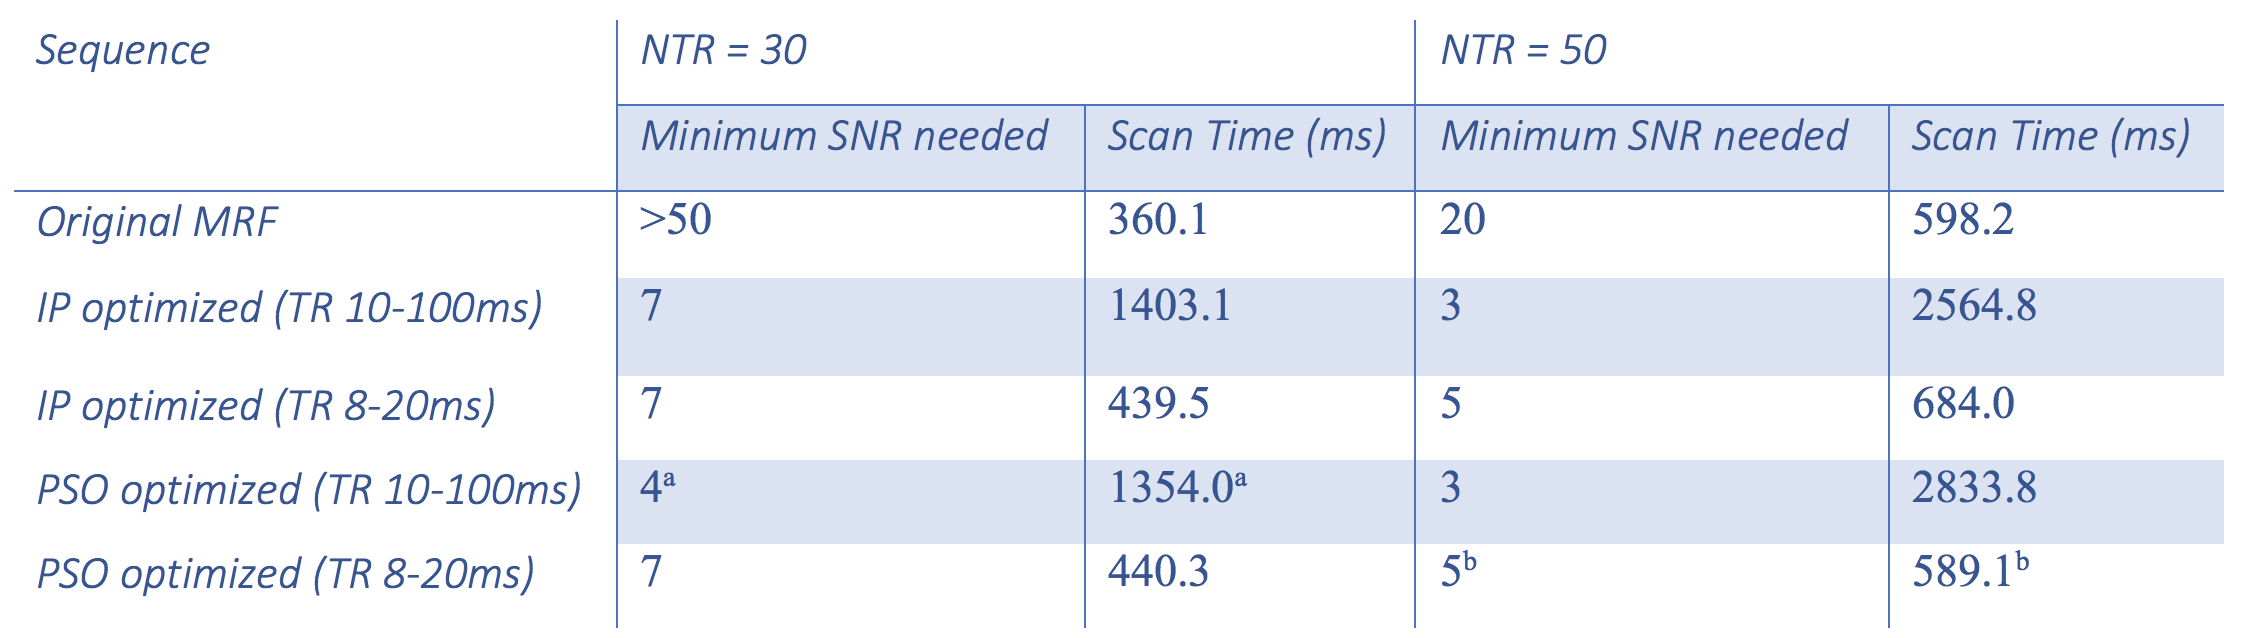
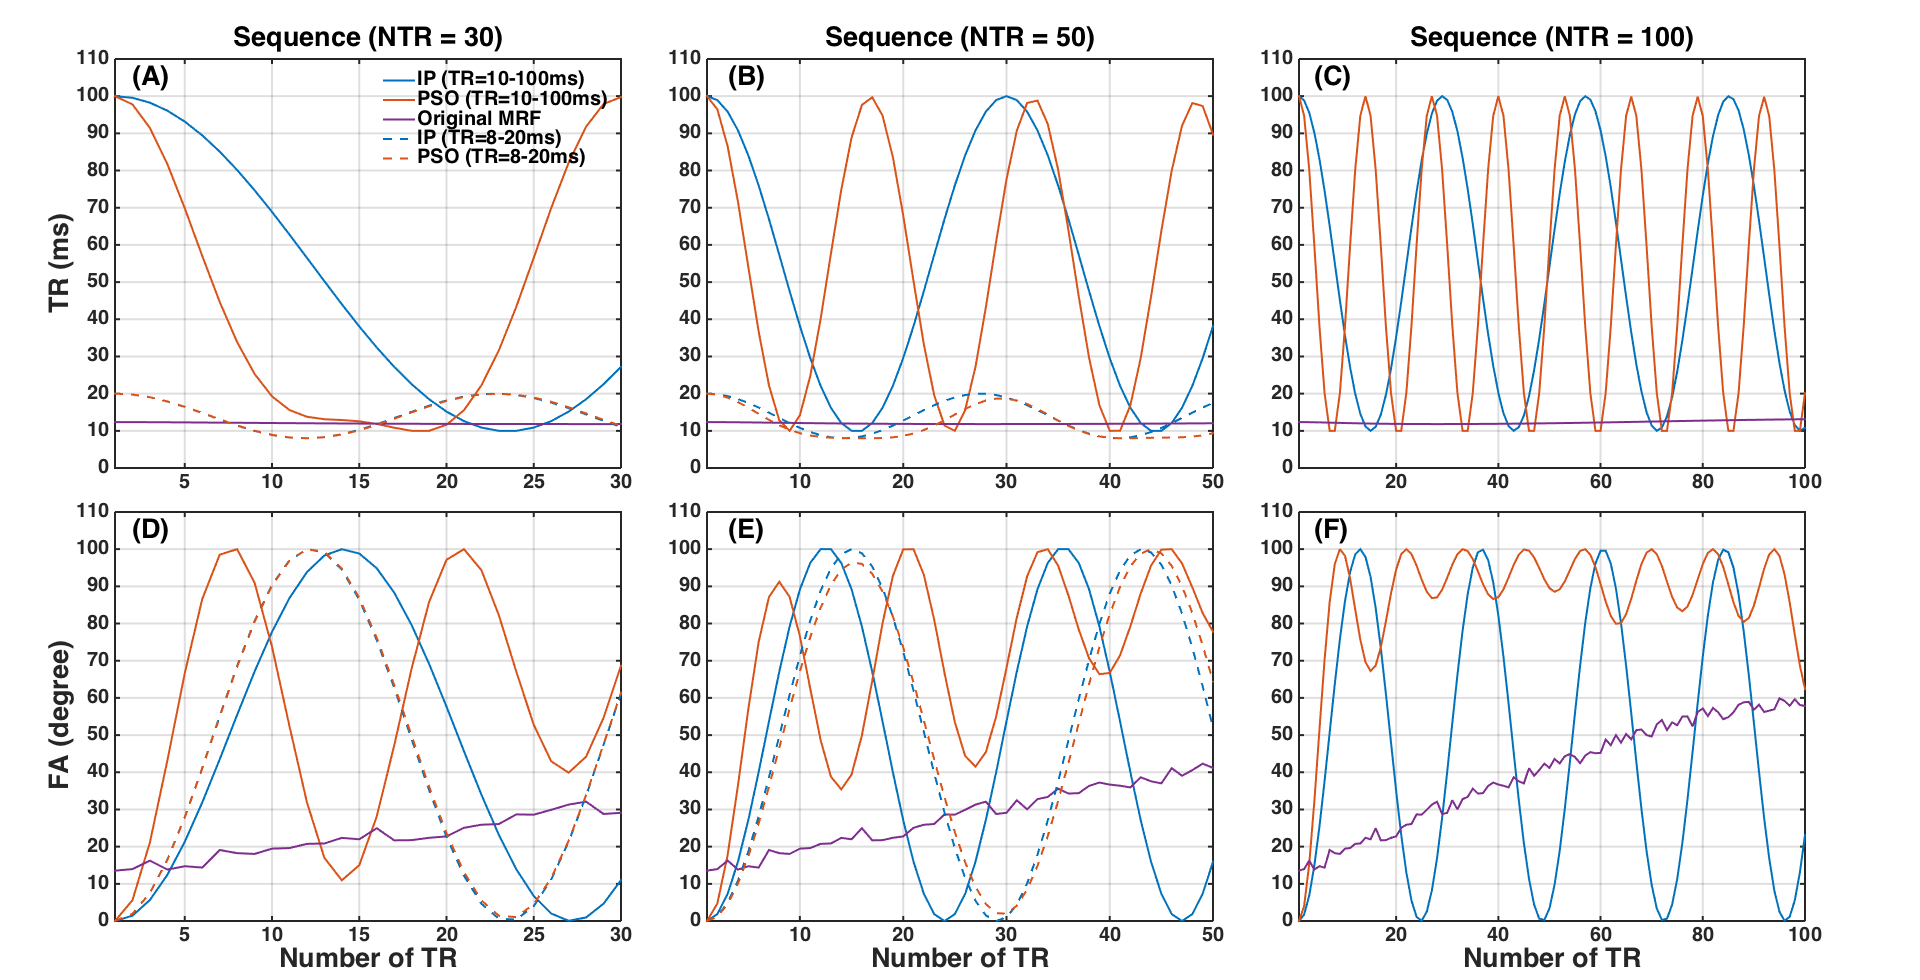
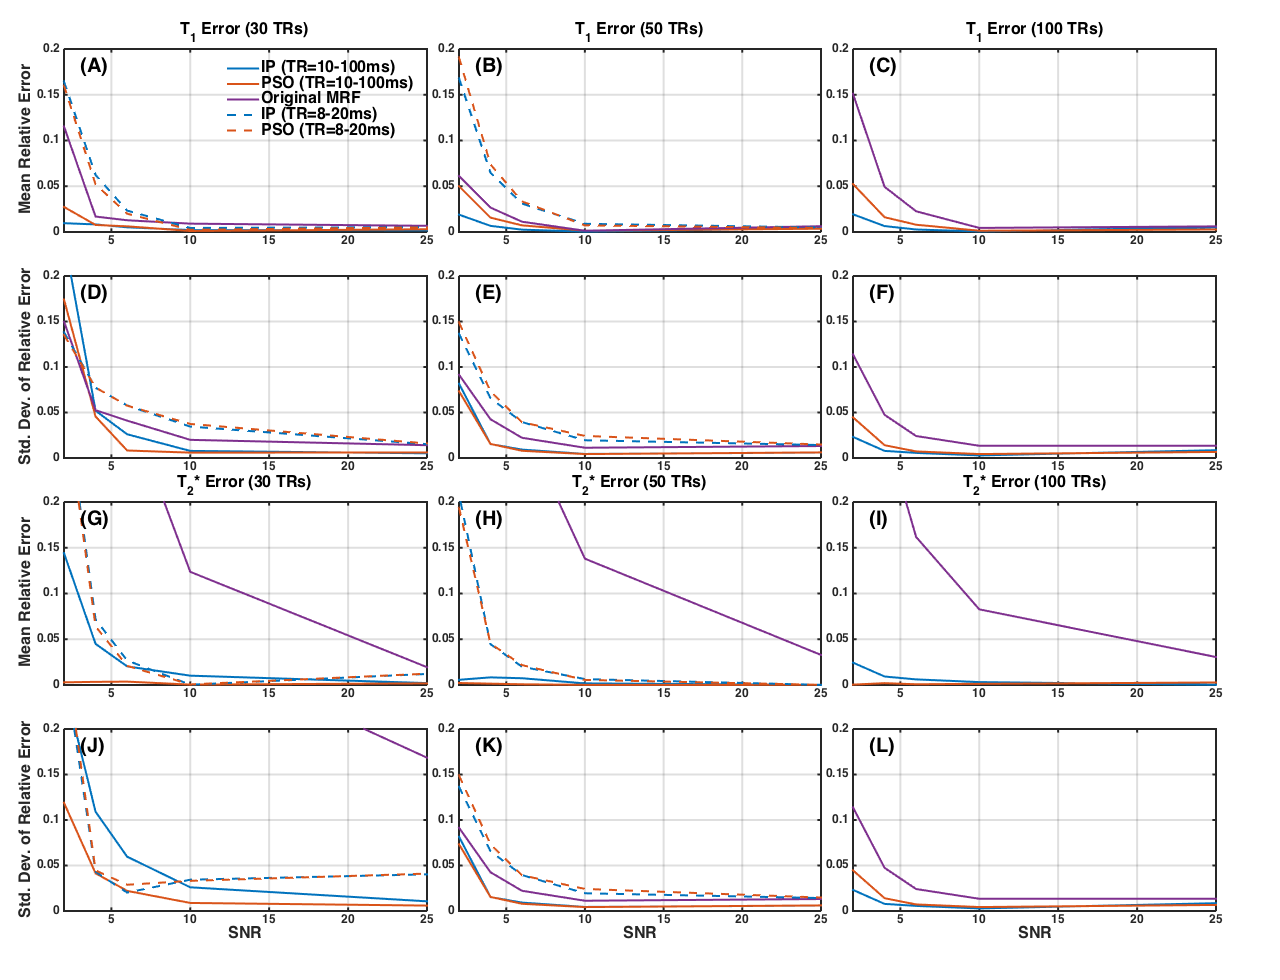
MRF Acquisition Scheme Optimization: The goal is to optimize the variation of the sequence parameters, TRs and flip angles (FAs), for MRF with IR spoiled-GRE. We performed IP and PSO optimizations using fmincon and particleswarm functions in MATLAB. TRs and FAs were constrained in the range of 10-100ms (or 8-20ms for higher time efficiency) and 0-100o, with number of consecutive TRs (NTR) of 30, 50, or 100. The ranges of T1 and T2* were 200-2500ms and 10-150ms, for both optimization and evaluation. The optimization methods used a cost function that maximizes the discrimination between tissue types, which is quantified by the distance between the dot product matrix H = DTD of a training dictionary D (100 entries) and the exponential matrix E (Ei,j=exp(-di,j/0.2): Nx=‖DxTDx-E‖F. In this equation, di,j is the L2 distance of two entries in T1 and T2* space, x represents the acquisition schedule. Instead of optimizing individual TRs and FAs, functions of combined sinusoidal waves (NTR/5 waves) were used to generate the combinations of TR and FA, of which the frequencies (0.1-NTR/2) and amplitudes (0-1) were optimized. Evaluations: The dictionaries of original MRF1, IP optimized, and PSO optimized sequences were built with 7455 entries, using extended phase graph (EPG) simulation. The simulated signals with added complex Gaussian white noise (SNR 2-50) were pattern-matched with the dictionaries to estimate T1 and T2* values. The mean and standard deviation of relative errors were calculated as metrics to assess the accuracy of T1 and T2* estimation. The optimized and unoptimized sequences were compared based on minimum SNR needed to maintain high accuracy (mean and standard deviation of relative errors ≤5% for both T1 and T2*). The optimization methods were further compared according to optimization time and cost function value.Results
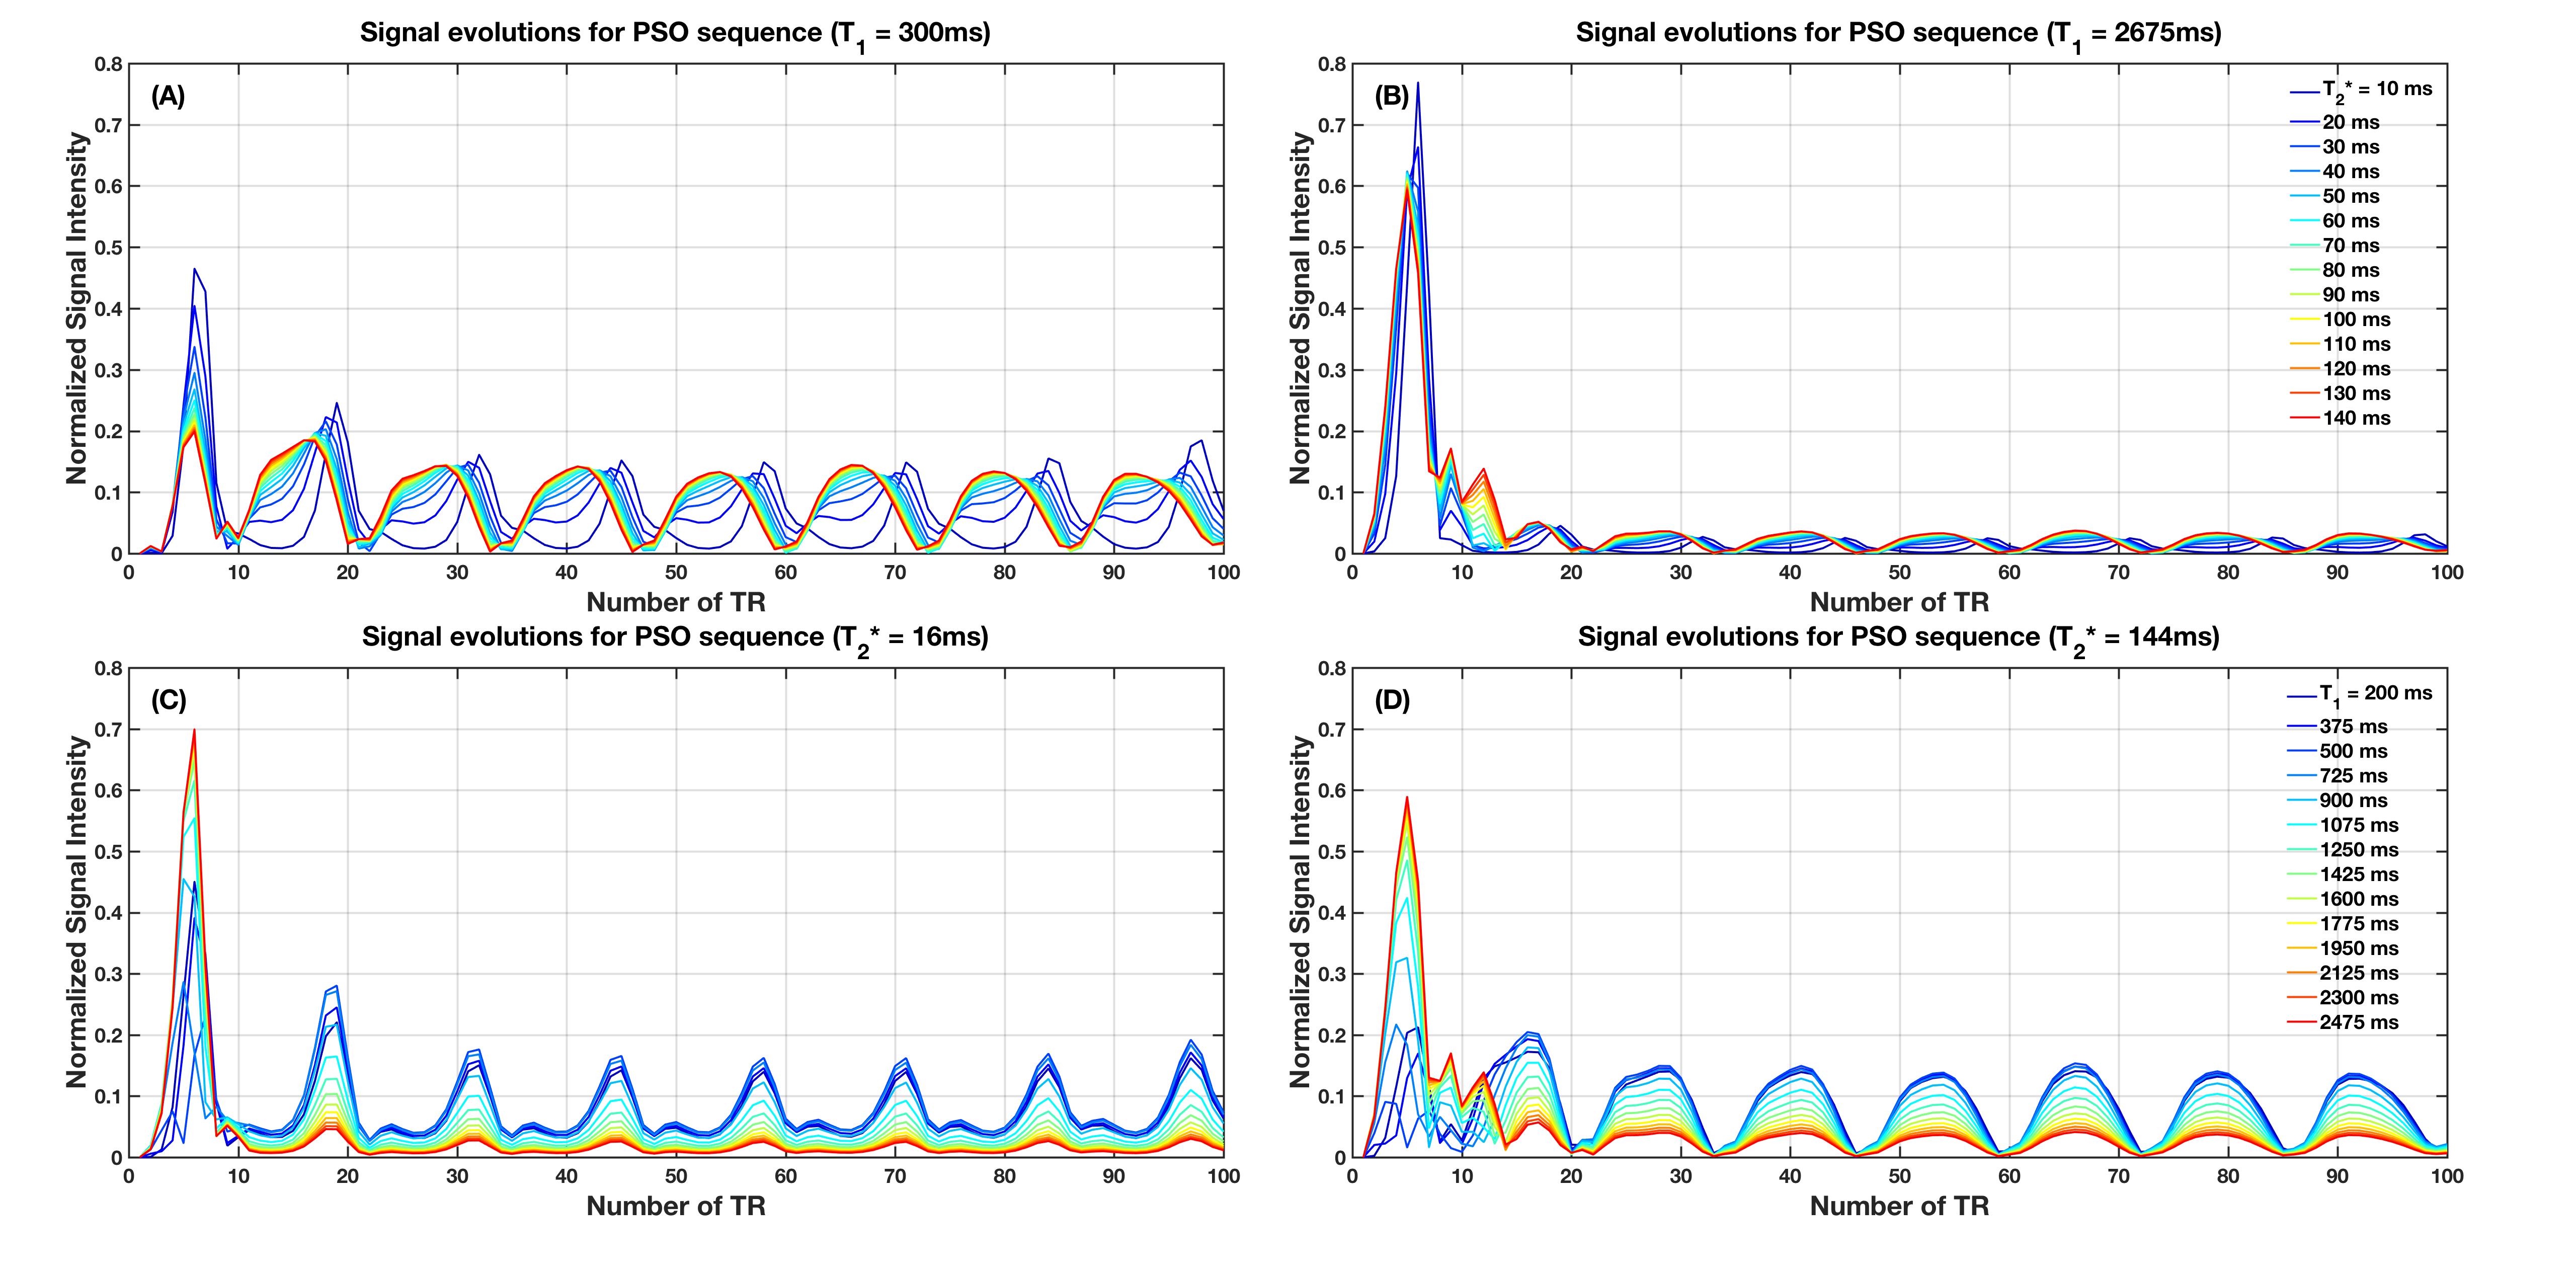
Figure 1 shows the original MRF sequence and the IP and PSO optimized sequences. Example signal intensity evolutions are shown in Figure 2. The resulting mean and standard deviation of relative errors of T1 and T2* estimations are shown in Figure 3. The minimum SNR required to achieve simultaneous accurate T1 and T2* mapping and the total scan time for original and optimized sequences are shown in Table 1. Simultaneous accurate mapping of T1 and T2* can be achieved within NTR=50 (<0.7s) for SNR≥5; within NTR=30 (<0.5s) for SNR≥10, for both IP and PSO methods. On average, PSO method requires 4.26 times longer optimization time, and achieves 4.28% lower cost function value, compared to IP method.Discussion
The results indicate that for an IR spoiled-GRE MRF sequence, both sequence optimizations substantially improve the accuracy of T1 and T2* quantification, reducing the SNR needed for simultaneous accurate T1 and T2* estimation by more than 4 fold, while increasing the scan time by only ~20%, compared to the original MRF sequence. Increasing sequence NTR increases accuracy more efficiently than increasing TR durations (Table 1). Overall, PSO and IP perform comparably for MRF sequence optimization. Advantages of this MRF sequence design framework include: (1) using exponentially weighted cost function avoids mismatching to dictionary entries far from the true values; (2) using combined sinusoidal wave functions to reduce the search space dimensionality, improve the optimization speed, and increase the possibility of finding global optimum within limited number of iterations. Future work could include better understanding the physics and signal evolution for different generation functions of TRs and FAs, investigating the trade-off between NTR and durations of TRs for optimum efficiency, validating the method with phantom experiments and in vivo experiments, and generalization to optimize other sequence types.Conclusion
A framework for optimizing the IR spoiled-GRE MRF pulse sequence using interior-point and particle-swarm algorithms has been proposed. By using PSO/IP algorithms to minimize the cost function of ‖DxTDx-E‖F with combined sinusoidal wave parameters as input, more accurate quantification of T1 and T2* can be achieved, compared to the original MRF.Acknowledgements
No acknowledgement found.References
[1] Ma D, Gulani V, Seiberlich N, Liu K, Sunshine JL, Duerk JL, et al. Magnetic resonance fingerprinting. Nature 2013;495(7440):187-92.
[2] Cohen O, Rosen MS. Algorithm comparison for schedule optimization in MR fingerprinting. Magn Reson Imaging 2017;41:15-21.
Figures