2882
Visualizing the Spatial Propagation of Ventilation and Perfusion Signal with Fourier-Decomposition MRI1Department of Radiology, University Hospital Munich, LMU, Munich, Germany, 2Comprehensive Pneumology Center Munich (CPC-M), Helmholtz Zentrum München, Munich, Germany, 3Siemens healthcare GmbH, Erlangen, Germany
Synopsis
Fourier decomposition (FD) MRI offers functional imaging without exposing patient to contrast agents during free breathing measurements, facilitating the examination of patients with impaired respiration. The presented method visualizes signal progression in the lung by using the phase information of the FD-method and addresses recently raised concern that variable-frequency signals can lead to errors in ventilation and perfusion phase estimates. With the signal progression maps it is further shown how localized signal delays caused by pathologies can be identified.
Introduction
The phase information of the Fourier decomposition (FD) method has been previously suggested for resolving cardiac phases in the lung1, 2. however, a recent study3 highlighted a significant problem with sinusoidal fitting on realistic signals with fluctuating frequencies. Contributions of the different frequencies overlap and introduce a cumulative error. In the frequency domain, i.e. after discrete Fourier transform (DFT) of the signal, the frequency amplitudes close to each other will similarly overlap due to spectral leakage4. In this study these issues have been addressed by improving upon the pre-processing of the acquired data, yielding a method for the visualization of the spatial propagation of the ventilation and perfusion signal in the lung that maintains the simplicity of the FD-method.Methods
Five healthy test subjects and one patient with suspicion of chronic thromboembolic pulmonary hypertension (CTEPH) underwent non-contrast enhanced MRI examination under free breathing conditions. Measurements were performed in supine position and images were recorded in coronal orientation. The measurements were performed on a 1.5T whole body scanner (Siemens MAGNETOM Aera; Siemens Healthcare, Erlangen Germany) with a 30-channel body coil and the spine matrix coil using a prototype 2DTrueFISP sequence5. The following imaging parameters were used: FOV=450×450mm2, matrix=96×96voxels, slice thickness=15mm, repetition time=1.03ms, echo time=0.36ms, flip angle= 25°, temporal resolution = 115ms/image, number of dynamic images = 1024, acquisition time = 117s. A non-rigid registration of the images was performed via prototype software, FMRLung4.5 (Siemens Corporate Research, NJ, USA).
Perfusion and ventilation weighted images were extracted in accordance with standard FD-method with the TrueFISP sequence6. A 1-D hamming window followed by DFT was then applied in the temporal dimension of the two image series to generate the complex maps. Phase-angle maps were calculated from the formula $$$\alpha(f) = atan(\frac{imag(FI(f))}{real(FI(f))})$$$ where FI were the Fourier Images and the frequency f was manually selected from the extracted ventilation and perfusion frequencies. Intensity maps were also generated from the magnitude of the FI to highlight where signal was expected.
To avoid phase folding, a 2D phase-unwrapping algorithm7 was used. A voxels with the lowest time delay in the pulmonary trunc was chosen as reference voxel for the perfusion weighted phase maps and in the parenchyma for the ventilation weighted.
Results
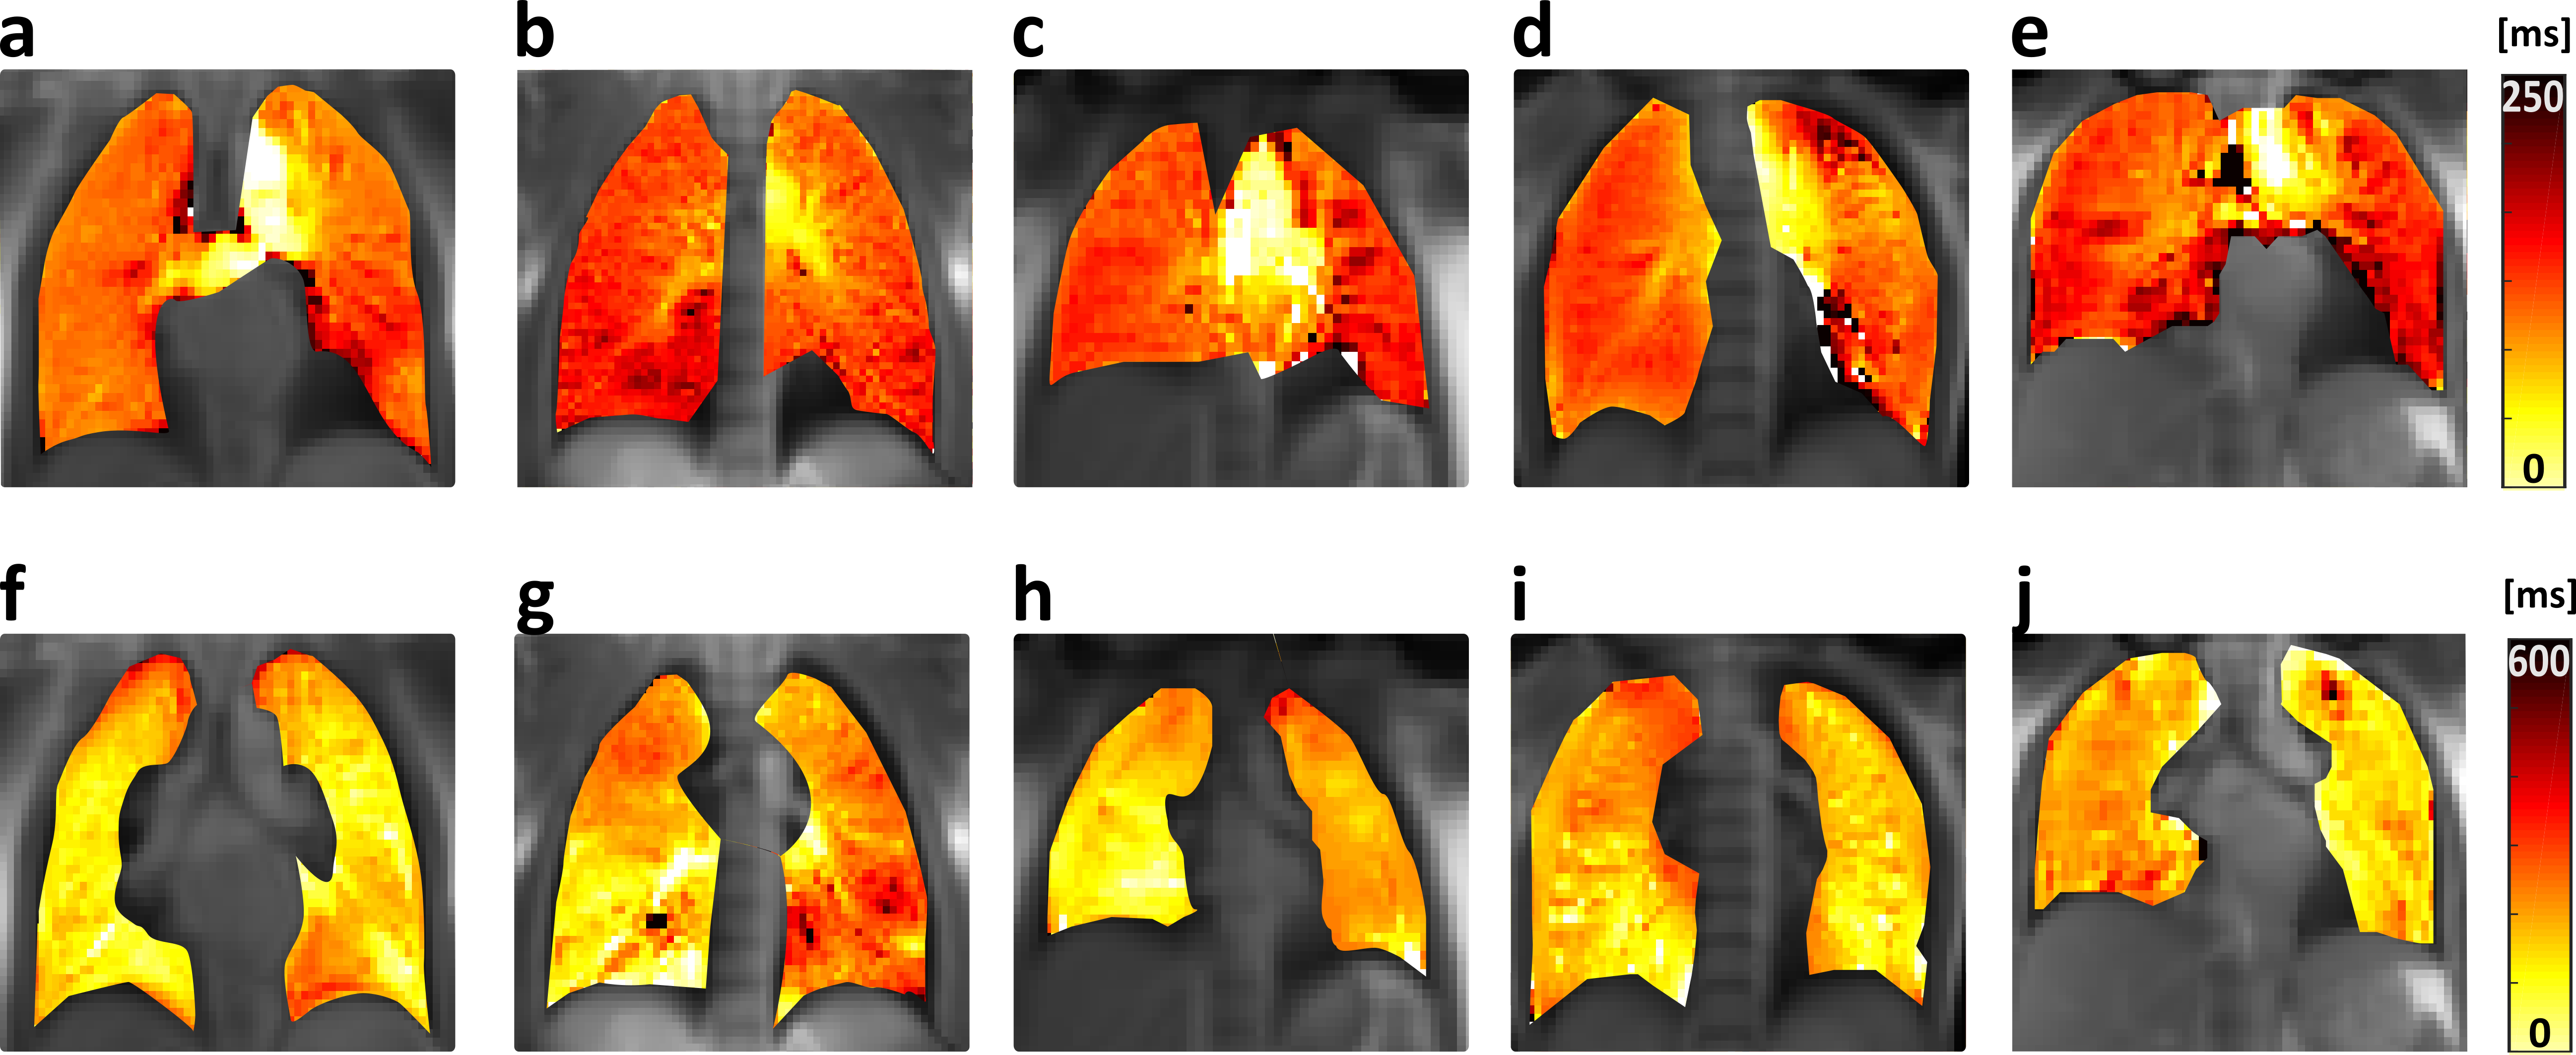
Figure 1 displays progression maps belonging to all five healthy test subjects. The perfusion signal (top row) perceptibly progresses from centre to the lung periphery in about 120ms. In the ventilation results (bottom row), a clear progression direction cannot be determined. However, different lobes seem to inflate and deflate with some delay. For the ventilation signal, it takes typically about 180-250ms to reach most parts of the lung.
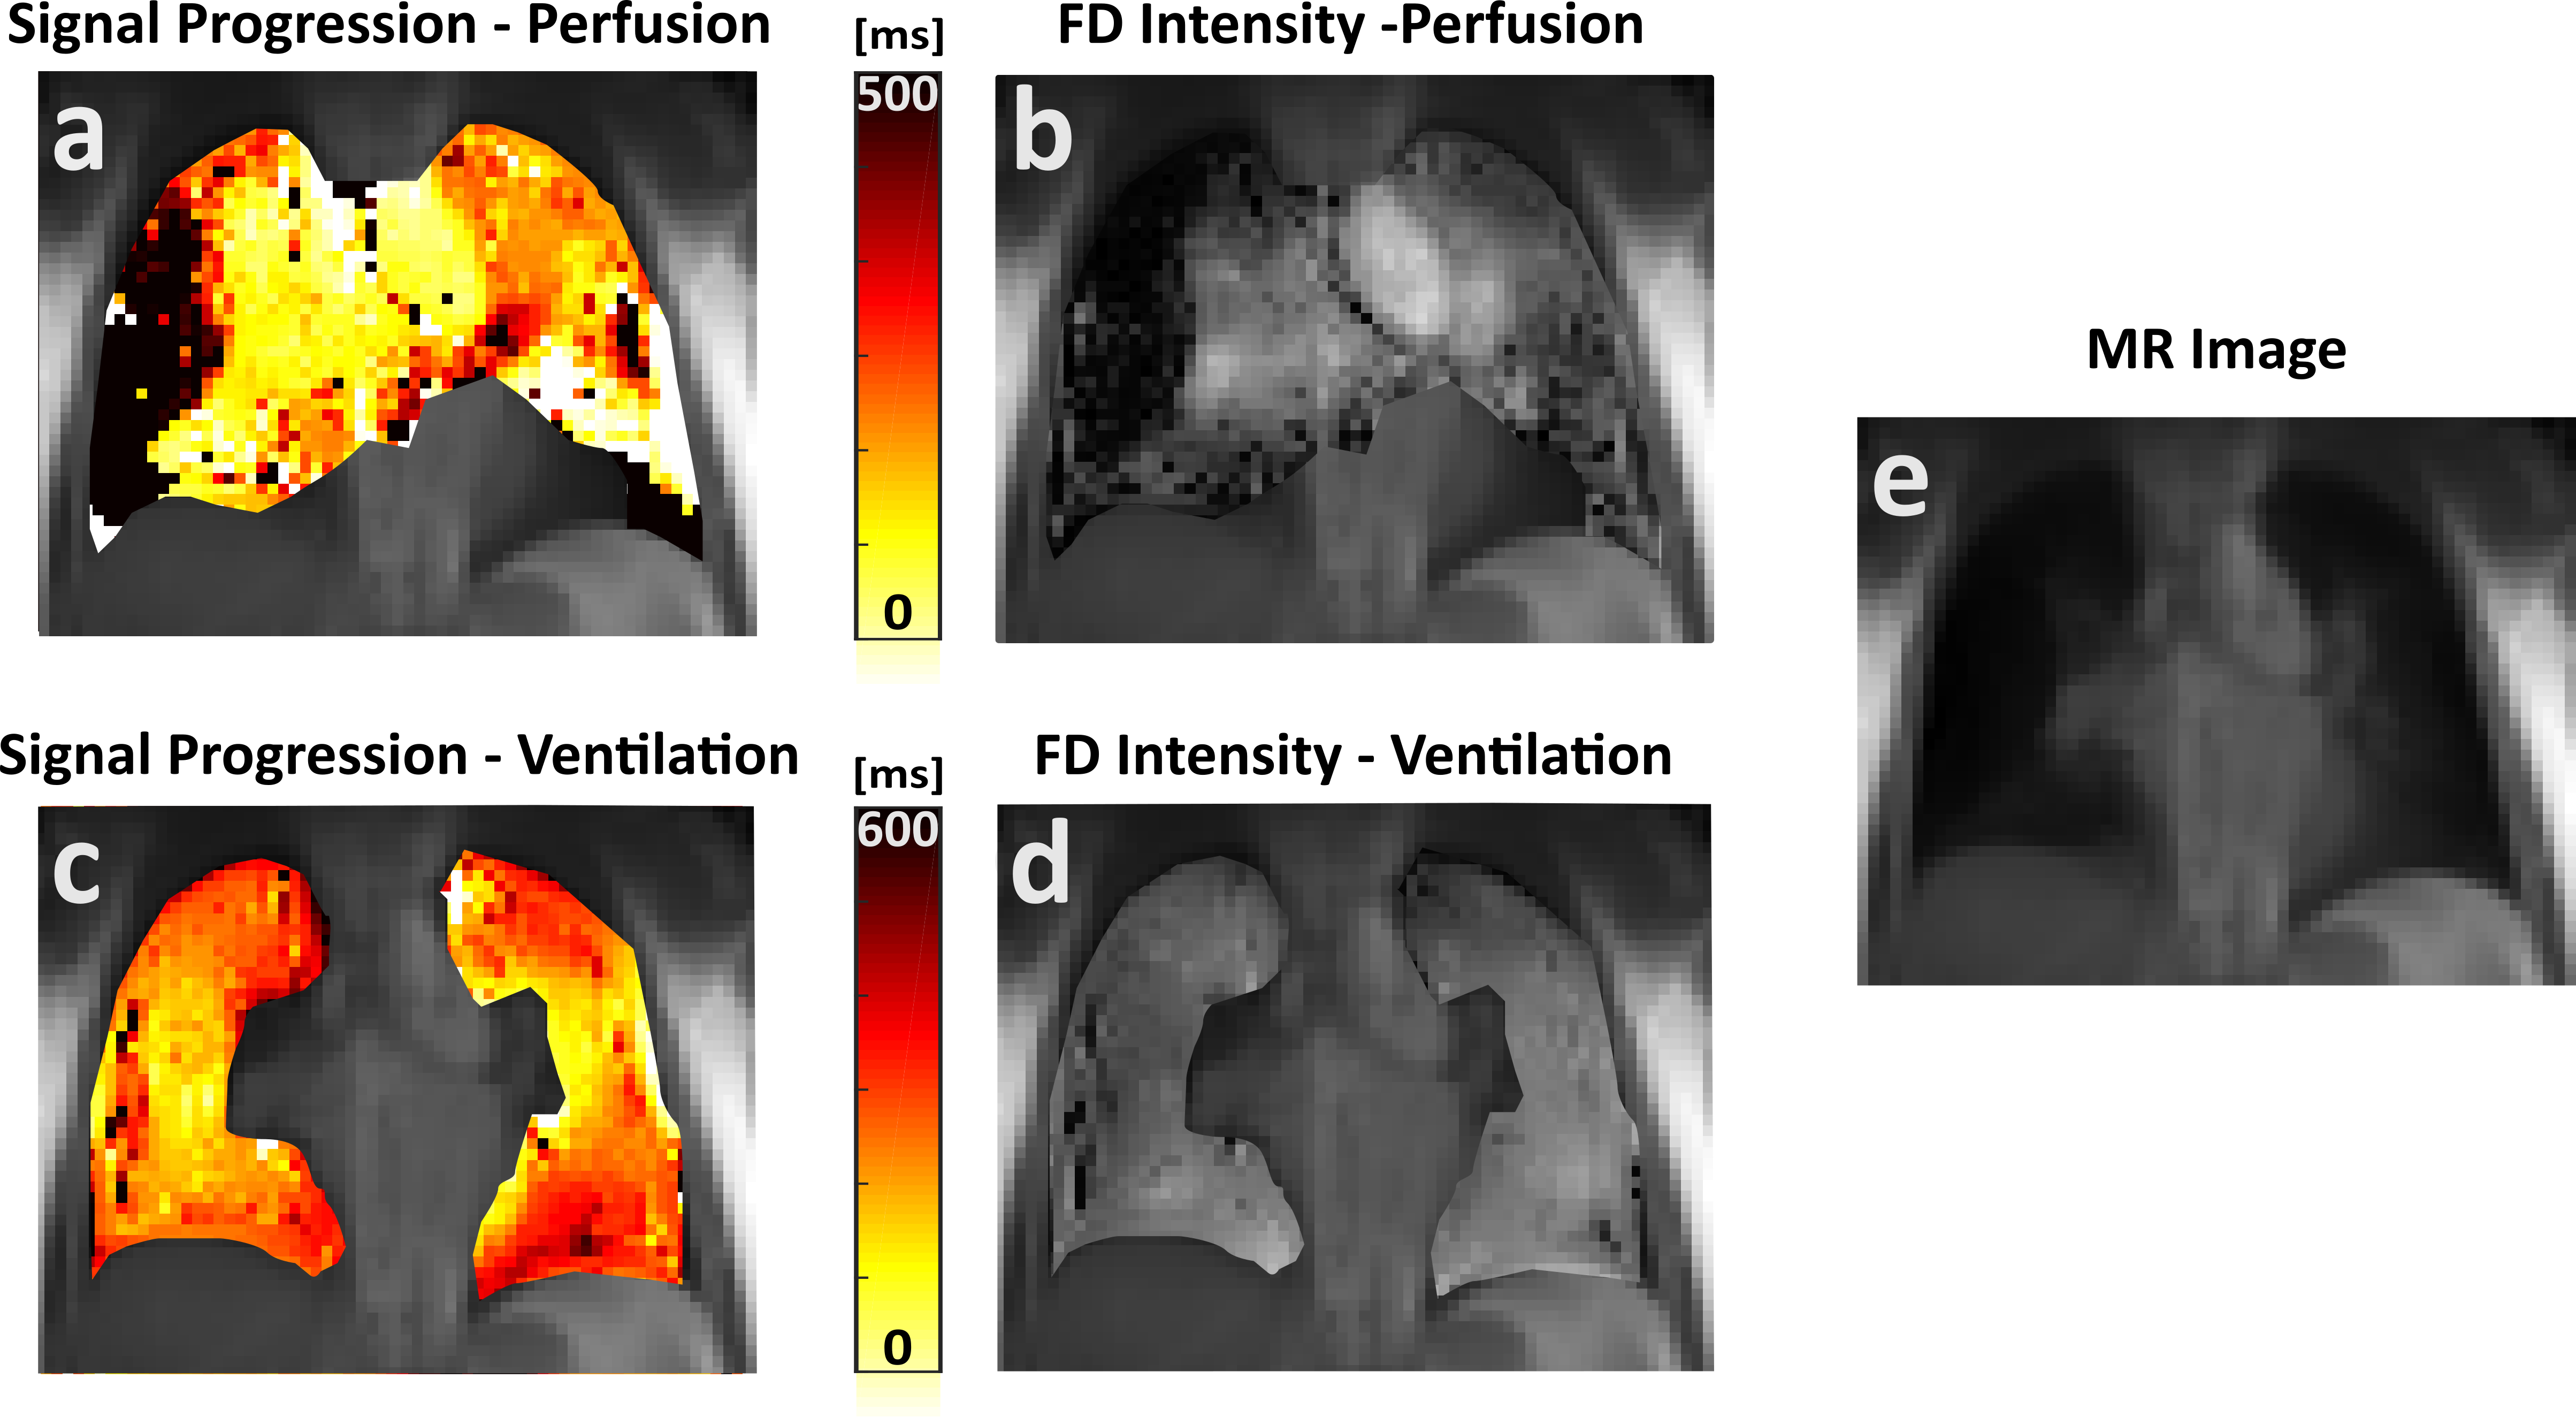
Figure 2 displays results from the patient showing large perfusion defects in FD intensity images (Figure 2b). As in the healthy test subjects, perfusion signal progression from centre to periphery takes about 120ms in the healthy part of the lung. However, for the diseased tissue, the signal is delayed up to 500ms. Ventilation propagation is again spreading inhomogeneously throughout different lobes.
Discussion
This study demonstrates feasibility to extract further functional information from the FD-method about parenchymal ventilation and perfusion without image resorting or self-gating techniques. By applying windows specialized to minimize spectral leakage on the time signals, the issue of overlapping contributions to the DFT peaks were diminished. It has been shown that this method can find localized signal delays caused by pathologies and map signal progression. Differences in delay substantially below the temporal resolution of the acquisition time can be distinguished since DFT is fitting in the frequency domain, meaning that no set time resolution exists. Accuracy of phase shift estimate is rather dependent on the quality of the fit. Perfusion maps all show blood pulsatility following the path aorta- pulmonary trunc -larger pulmonary veins-smaller pulmonary veins-parenchyma in accordance with current understanding of pulmonary circulation. Ventilation progression times between 180-250ms are comparable to values found for gas progression in the lung8 but due to the intricacies how bronchial structures are branching, it might require 3D-imaging to display progression direction.Conclussion
In this study, we present a new method based on Fourier decomposition MRI for quantifying and visualizing the progression of the perfusion and ventilation signal in the lungs. With the highly resolved signal progression, further understanding of blood flow and alveolar ventilation can be obtained. It should be noticed that ventilation phase information amalgamates inflation/deflation cycles and it could be useful to separate the two.Acknowledgements
The authors acknowledge partial funding by the German Center for Lung Research (DZL), but received no specific grant for this research from any funding agency in the public, commercial or not-for-profit sector. We thank Dr. Oliver Bieri (Universitätsspital Basel, Switzerland) for his work on optimizing the TrueFISP sequence.References
1. Bauman G, Eichinger M and Uecker M 2012 High temporal resolution radial bSSFP sequence with nonlinear inverse reconstruction for the measurement of the pulmonary blood inflow time using Fourier decomposition MRI. Proc. of 20th Annual Meeting of ISMRM, Melbourne, Australia, p. 1340.
2. Veldhoen S, Weng A M, Wirth C, Kunz A S, Knapp J N, Stäb D, Segerer F, Hebestreit H U, Bley T A and Köstler H, 2016 Pulmonary Phase Imaging using Self-Gated Fourier Decomposition MRI in Patients with Cystic Fibrosis. Proc. of 24th Annual Meeting of ISMRM, Singapore, p. 1144.
3. Voskrebenzev A, Gutberlet M, Klimeš F, Kaireit T F, Schönfeld C, Rotärmel A, Wacker F, Vogel-Claussen J, 2017. Feasibility of quantitative regional ventilation and perfusion mapping with phase-resolved functional lung (PREFUL) MRI in healthy volunteers and COPD, CTEPH, and CF patients. Magn. Reson. Med. doi:10.1002/mrm.26893
4. Harris F J, 1978. On the use of windows for harmonic analysis with the discrete Fourier transform. Proc. IEEE 66, 51–83. doi:10.1109/PROC.1978.10837
5. Bieri O, 2013. Ultra-fast steady state free precession and its application to in vivo (1)H morphological and functional lung imaging at 1.5 tesla. Magn. Reson. Med. 70, 657–663. doi:10.1002/mrm.24858
6. Bauman G, Puderbach M, Deimling M, Jellus V, Chefd’hotel C, Dinkel J, Hintze C, Kauczor H U and Schad L R, 2009. Non-contrast-enhanced perfusion and ventilation assessment of the human lung by means of fourier decomposition in proton MRI. Magn. Reson. Med. 62, 656–664. doi:10.1002/mrm.22031
7. Goldstein R M, Zebker H A and Werner C L, 1988. Satellite radar interferometry: Two-dimensional phase unwrapping Radio Sci. 23, 713–720. doi:10.1029/RS023i004p00713 8. Salerno M, Altes T A, Brookeman J R, de Lange E E and Mugler J P, 2001 Dynamic spiral MRI of pulmonary gas flow using hyperpolarized (3)He: preliminary studies in healthy and diseased lungs. Magn. Reson. Med. 46, 667–677.
8. Salerno M, Altes T A, Brookeman J R, de Lange E E and Mugler J P, 2001 Dynamic spiral MRI of pulmonary gas flow using hyperpolarized (3)He: preliminary studies in healthy and diseased lungs. Magn. Reson. Med. 46, 667–677.
Figures